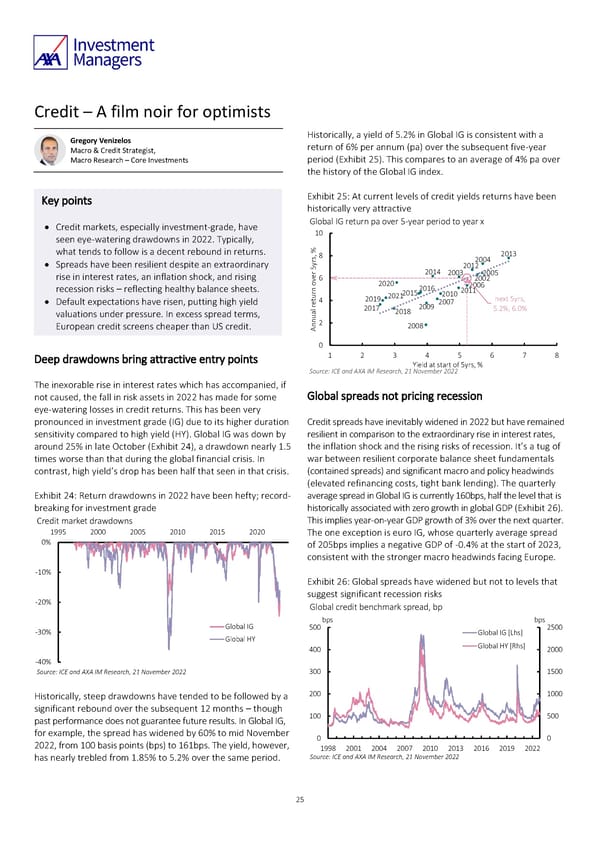
Credit – A film noir for optimists Gregory Venizelos Historically, a yield of 5.2% in Global IG is consistent with a Macro & Credit Strategist, return of 6% per annum (pa) over the subsequent five-year Macro Research – Core Investments period (Exhibit 25). This compares to an average of 4% pa over the history of the Global IG index. Key points Exhibit 25: At current levels of credit yields returns have been historically very attractive • Credit markets, especially investment-grade, have Global IG return pa over 5-year period to year x seen eye-watering drawdowns in 2022. Typically, 10 what tends to follow is a decent rebound in returns. ,% 8 2013 • Spreads have been resilient despite an extraordinary rsy 2004 5r 2014 2012 rise in interest rates, an inflation shock, and rising e6 2003 2005 ov 2020 2002 recession risks – reflecting healthy balance sheets. n 2016 2006 ur 2015 2010 2011 • Default expectations have risen, putting high yield ret4 2019 2021 2007 next 5yrs, valuations under pressure. In excess spread terms, al 2017 2018 2009 5.2%, 6.0% European credit screens cheaper than US credit. Annu2 2008 0 Deep drawdowns bring attractive entry points 1 2 3 4 5 6 7 8 Yield at start of 5yrs, % Source: ICE and AXA IM Research, 21 November 2022 The inexorable rise in interest rates which has accompanied, if not caused, the fall in risk assets in 2022 has made for some Global spreads not pricing recession eye-watering losses in credit returns. This has been very pronounced in investment grade (IG) due to its higher duration Credit spreads have inevitably widened in 2022 but have remained sensitivity compared to high yield (HY). Global IG was down by resilient in comparison to the extraordinary rise in interest rates, around 25% in late October (Exhibit 24), a drawdown nearly 1.5 the inflation shock and the rising risks of recession. It’s a tug of times worse than that during the global financial crisis. In war between resilient corporate balance sheet fundamentals contrast, high yield’s drop has been half that seen in that crisis. (contained spreads) and significant macro and policy headwinds (elevated refinancing costs, tight bank lending). The quarterly Exhibit 24: Return drawdowns in 2022 have been hefty; record- average spread in Global IG is currently 160bps, half the level that is breaking for investment grade historically associated with zero growth in global GDP (Exhibit 26). Credit market drawdowns This implies year-on-year GDP growth of 3% over the next quarter. 1995 2000 2005 2010 2015 2020 The one exception is euro IG, whose quarterly average spread 0% of 205bps implies a negative GDP of -0.4% at the start of 2023, consistent with the stronger macro headwinds facing Europe. -10% Exhibit 26: Global spreads have widened but not to levels that suggest significant recession risks -20% Global credit benchmark spread, bp Global IG bps bps -30% 500 Global IG [Lhs] 2500 Global HY Global HY [Rhs] 400 2000 -40% Source: ICE and AXA IM Research, 21 November 2022 300 1500 Historically, steep drawdowns have tended to be followed by a 200 1000 significant rebound over the subsequent 12 months – though 100 500 past performance does not guarantee future results. In Global IG, for example, the spread has widened by 60% to mid November 0 0 2022, from 100 basis points (bps) to 161bps. The yield, however, 1998 2001 2004 2007 2010 2013 2016 2019 2022 has nearly trebled from 1.85% to 5.2% over the same period. Source: ICE and AXA IM Research, 21 November 2022 25
 AXA IM Outlook 2023 full report Page 24 Page 26