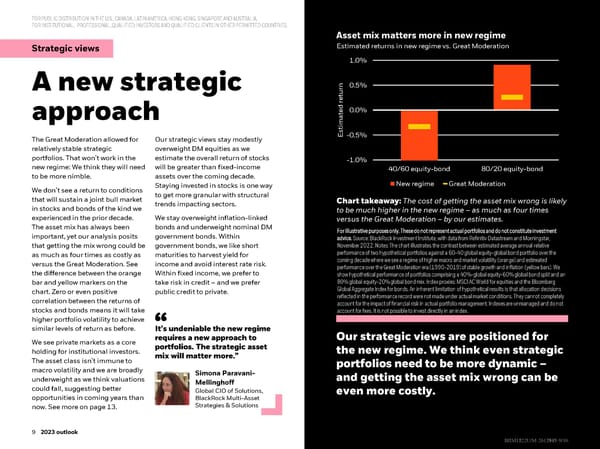
FOR PUBLIC DISTRIBUTION IN THE U.S., CANADA, LATIN AMERICA, HONGKONG, SINGAPORE AND AUSTRALIA. FOR INSTITUTIONAL, PROFESSIONAL, QUALIFIED INVESTORS AND QUALIFIED CLIENTS IN OTHER PERMITTED COUNTRIES. Asset mix matters more in new regime Strategic views Estimated returns in new regime vs. Great Moderation 1.0% A new strategic n 0.5% eturr approach ated 0.0% mti The Great Moderation allowed for Our strategic views stay modestly Es-0.5% relatively stable strategic overweight DM equities as we portfolios. That won’t work in the estimate the overall return of stocks -1.0% new regime: We think they will need will be greater than fixed-income 40/60 equity-bond 80/20 equity-bond to be more nimble. assets over the coming decade. Staying invested in stocks is one way New regime Great Moderation We don’t see a return to conditions to get more granular with structural that will sustain a joint bull market trends impacting sectors. Chart takeaway: The cost of getting the asset mix wrong is likely in stocks and bonds of the kind we to be much higher in the new regime –as much as four times experienced in the prior decade. We stay overweight inflation-linked versus the Great Moderation –by our estimates. The asset mix has always been bonds and underweight nominal DM For illustrative purposes only. These do not represent actual portfolios and do not constitute investment important, yet our analysis posits government bonds. Within advice. Source: BlackRock Investment Institute, with data from Refinitiv Datastream and Morningstar, that getting the mix wrong could be government bonds, we like short November 2022. Notes: The chart illustrates the contrast between estimated average annual relative as much as four times as costly as maturities to harvest yield for performance of two hypothetical portfolios against a 60-40 global equity-global bond portfolio over the versus the Great Moderation. See income and avoid interest rate risk. coming decade where we see a regime of higher macro and market volatility (orange) and estimated performance over the Great Moderation era (1990-2019) of stable growth and inflation (yellow bars). We the difference between the orange Within fixed income, we prefer to show hypothetical performance of portfolios comprising a 40%-global equity-60% global bond split and an bar and yellow markers on the take risk in credit – and we prefer 80% global equity-20% global bond mix. Index proxies: MSCI AC World for equities and the Bloomberg chart. Zero or even positive public credit to private. Global Aggregate Index for bonds. An inherent limitation of hypothetical results is that allocation decisions correlation between the returns of reflected in the performance record were not made under actual market conditions. They cannot completely account for the impact of financial risk in actual portfolio management. Indexes are unmanaged and do not stocks and bonds means it will take account for fees. It is not possible to invest directly in an index. higher portfolio volatility to achieve similar levels of return as before. It’s undeniable the new regime Our strategic views are positioned for We see private markets as a core requires a new approach to holding for institutional investors. portfolios. The strategic asset the new regime. We think even strategic mix will matter more.” The asset class isn’t immune to portfolios need to be more dynamic – macro volatility and we are broadly Simona Paravani- and getting the asset mix wrong can be underweight as we think valuations Mellinghoff could fall, suggesting better Global CIO of Solutions, even more costly. opportunities in coming years than BlackRock Multi-Asset now. See more on page 13. Strategies & Solutions 99 2023 outlook 9 2022 midyear outlook BBIIIIMM1122U/M1222U/M--26121472617935--99/16/16
 BlackRock 2023 Global Outlook Page 8 Page 10