Citi ESG Report
2021 Environmental, Social & Governance Report
ESG at Citi 5 Letter from Our CEO 8 Our ESG Strategy 10 ESG Governance at Citi 13 Our Material ESG Issues: Citi in a Global Context 16 Citi and the Sustainable Development Goals 17 Stakeholder Engagement at Citi Sustainable Finance 20 Our $1 Trillion Commitment Sustainable Progress 33 Financing the Low-Carbon Transition 37 Climate Risk and Net Zero 50 Sustainable Operations Equitable and Resilient Communities 62 Our Commitment to Social Finance 66 Action for Racial Equity 70 Citi Impact Fund 72 COVID-19 Relief and Recovery 75 Affordable Housing 78 Strategic Philanthropy Talent and Diversity , Equity & Inclusion 81 Return to Office and the Future of Work 83 Diversity, Equity & Inclusion 97 Using Our Corporate Voice to Drive Change 99 Employment Data Risk Management and Responsible Business 104 Our Transformation 110 Risk Management 121 Serving Our Customers and Clients Responsibly 125 Human Rights 134 Responsible Sourcing Appendices 139 GRI Content Index 150 Sustainability Accounting Standards Board Index 155 The Principles for Responsible Banking Index 168 Task Force on Climate-related Financial Disclosures Index 170 United Nations Global Compact Index 172 United Nations Guiding Principles Reporting Framework Index 176 Assurance Table of Contents Contents ESGatCiti SustainableFinance SustainableProgress Equitable&ResilientCommunities Talent&DEI RiskManagement&ResponsibleBusiness Appendices CITI 2021 ESG REPORT 2
About This Report This report illustrates how we bring our mission to life through our business; it covers our environmental, social and governance (ESG) activities, performance and approach for calendar year 2021, focusing on the issues we have determined to be of material 1 importance from an ESG perspective, which is a broader standard than that used in our financial disclosures. This report has been prepared in accordance with the GRI Standards: Core option. We also used three relevant sector standards from the Sustainability Accounting Standards Board, the Principles for Responsible Banking, the United Nations (UN) Global Compact and the UN Guiding Principles on Business and Human Rights frameworks to guide our reporting. (See related indexes .) We have embedded the UN Sustainable Development Goals into relevant sections of the report where Citi plays a direct role in making progress toward specific goals. Additionally, we include an index that indicates where report content is specifically aligned to the recommendations of the Financial Stability Board’s Task Force on Climate-related Financial Disclosures. Finally, this report supplements information published in our 2021 Annual R eport . All reporting and performance data are limited to information for the owned and o perated facilities of Citigroup Inc. a nd i ts su bsidiaries, u nless s tated o therwise. A dditional i nformation a bout C iti c an b e f ound o n o ur website . For more information on Citi’s ESG initiatives, please visit citigroup.com/citi/about/esg/ or contact: Global Public Affairs Citigroup Inc . 388 Greenwich St. New York, NY 10013 [email protected] FPO IMAGE 1. Refer to page 16 for our definition of material issues in the context of this report. Contents ESGatCiti SustainableFinance SustainableProgress Equitable&ResilientCommunities Talent&DEI RiskManagement&ResponsibleBusiness Appendices CITI 2021 ESG REPORT 3
In This Section 5 Letter from Our CEO 8 Our ESG Strategy 10 ESG Governance at Citi 13 Our Material ESG Issues: Citi in a Global Context 16 Citi and the Sustainable Development Goals 17 Stakeholder Engagement at Citi ESG at Citi Contents ESGatCiti SustainableFinance SustainableProgress Equitable&ReslientCommunities Talent&DEI RiskManagement&ResponsibleBusines s Appendices CITI 2021 ESG REPORT 4
Letter from Our CEO As I write this note in late April, a war is raging in Ukraine with significant global ramifications. From the beginning, we have prioritized the humanitarian crisis, doing everything we can to help the people in Ukraine, including our own colleagues, whilst keeping our business there operating so we can support critical supply chains and the NGOs delivering essen - tial aid. We are also helping our multinational clients who have decided to wind down their business in Russia. Although it might be too early to predict the war’s long-term impact on the world order, it’s not too soon to begin asking what it means for the issues at the heart of our ESG agenda — and the ESG agendas of so many other companies. I recently returned from seeing clients in Europe and the Middle East, and it is security — be it energy, food, defense, cyber or operational — that’s now consuming their attention. The challenges facing our society have not only reinforced the need for businesses such as Citi to step up, but also the critical importance of collaboration on a global scale. Consider the climate crisis. At Citi, we’ve been proud to play a leading role in our industry’s drive to a more sustainable future, and in recent months, we released our initial plan for reaching net zero emissions by 2050. But Russia’s role as a major energy producer is forcing governments to reevaluate their energy security and supply. Ultimately, combating climate change cannot be done by any company or country alone; we need businesses making the right investments to achieve the necessary shift in supply, and consumers joining companies in advocating for governments to create the policy frame - works that will be essential to stimulating demand for clean technologies and providing the foundation for the clean energy transition. This tension, of course, is not new. While Citi plays an enabling role in the transition to a net zero economy, we understand that it cannot occur overnight. We have to be thoughtful with the transition, meeting our clients where they are in their efforts, and then helping and pushing them to accelerate their low-carbon transitions. Similarly, our efforts to expand financial access and opportunity have also gained new urgency. We have engaged every level of our business to think and act in support of equity and the goal of helping close the racial wealth gap and increase economic mobility in the United States. In order to effectively do this work and serve our clients and communities, we’ve set — and recently exceeded — talent representation goals to further diversify our own workforce and make progress toward pay equity at Citi. We also continue to advance financial inclusion in underserved communities globally, expanding the scope of our work to areas such as health - care, education, affordable housing and basic infrastructure. These efforts have become even more important amidst surging inflation and an emerging global food crisis that could be devastating for the world’s poorest coun - tries, which import much of their food and where households spend more than half of their income on food. There are, of course, lessons to learn and apply to these challenges, particularly from the pandemic. COVID-19’s disregard for borders underscored t he i nterconnectedness o f s ociety. It also reminded us that global challenges demand a global, collective response. As the world becomes more fragmented, it is even more important for our global community of business to come together to confront the big challenges of our time. At Citi, this sense of responsibility is something that continues to shape our decisions, business strategy, and firm-wide goals and commit - ments. We continue to be focused on action and partnering with like-minded organizations that are also doing the work. A nd f or u s, i t’s not just about the big numbers; it’s the small number — helping society get closer to zero. Zero carbon emissions. Zero wealth gap. Zero pay gap. Zero poverty. Some might say this is idealistic, but having ambitious goals is what helps us make meaningful progress. And it’s going to take all of us, working together, to make sure we continue to go in the right direction. I invite you to learn more about these initiatives in the pages that follow. Our ESG agenda is not a separate layer that sits above what we do day-to-day. It is an effort that we began at Citi many years ago that has become core to who we are as a company and our daily worth as a bank. While our efforts will continue to evolve to reflect new global challenges, our commitment to transparency and accountability will remain constant. We will continue to share our progress and lessons learned, and we will continue to innovate and push to use our core capabilities, expertise and talent to lead by example and demonstrate how Citi is truly a bank with a brain and a soul. JANE FRASER Chief Executive Officer Contents ESGatCiti SustainableFinance SustainableProgress Equitable&ResilientCommunities Talent&DEI RiskManagement&ResponsibleBusiness Appendices CITI 2021 ESG REPORT 5
• Unveiled initial plan to reach net zero emissions by 2050, including 2030 targets for our Energy and Power loan portfolios • Co-founded the Net Zero Banking Alliance, which will help establish an industry framework for decarbonizing the banking sector Played a leading role in driving the transition to net zero • Invested $1 billion in strategic initiatives as part of Citi and the Citi Foundation’s Action for Racial Equity commitment in year one of a three- year commitment • Launched the Diverse Financial Institutions Group to lead and expand firm-wide engagement with minority depository institutions, diverse broker-dealers and diverse asset managers • Worked exclusively with five Black-owned firms to syndicate a $2.5 billion bond issuance • Directed 68% of the Citi Impact Fund’s 2021 asset allocation to women and/or racially/ethnically diverse founders of companies Deepened our efforts to help close the racial wealth gap and increase economic mobility in the U.S. • Committed $1 trillion in sustainable finance by 2030, including $500 billion for environmental finance and $500 billion for social finance • Financed and facilitated $222 billion in sustainable finance activity in 2020 and 2021 Furthered the acceleration to a sustainable, low-carbon economy that supports the needs of society ESG at Citi At Citi, our ESG agenda reflects the role and responsibility we feel as a global bank to help solve many of society’s toughest challenges. It’s a part of our business model, and embedded in the products and services we offer. As we continue to evolve our ESG priorities to address ever-changing realities around the world, we remain committed to sharing our progress — as we believe transparency and accountability are key to success. • Issued a first-of-its-kind $1 billion social finance bond to expand access to essential services in emerging markets • Announced a new commitment, through which we aim to invest in opportunities for 15 million low-income households, including 10 million women, globally by 2025 Maximized positive social impact and advanced financial innovations in emerging markets 2021 Highlights • Provided $5.6 billion in loans for affordable housing projects in 2021, making Citi the largest U.S. affordable housing development lender for the 12th consecutive year Increased affordable housing in the U.S. • Disclosed annual, public update on our pay equity review, highlighting progress on median pay for women globally and U.S. minorities • Exceeded our three-year representation goals set in 2018 to increase representation for women globally and for Black talent in the U.S. • Promoted one of the largest and most diverse Managing Director classes in recent years Continued transparency around pay equity and increased diverse representation Contents ESGatCiti SustainableFinance SustainableProgress Equitable&ResilientCommunities Talent&DEI RiskManagement&ResponsibleBusiness Appendices CITI 2021 ESG REPORT 6
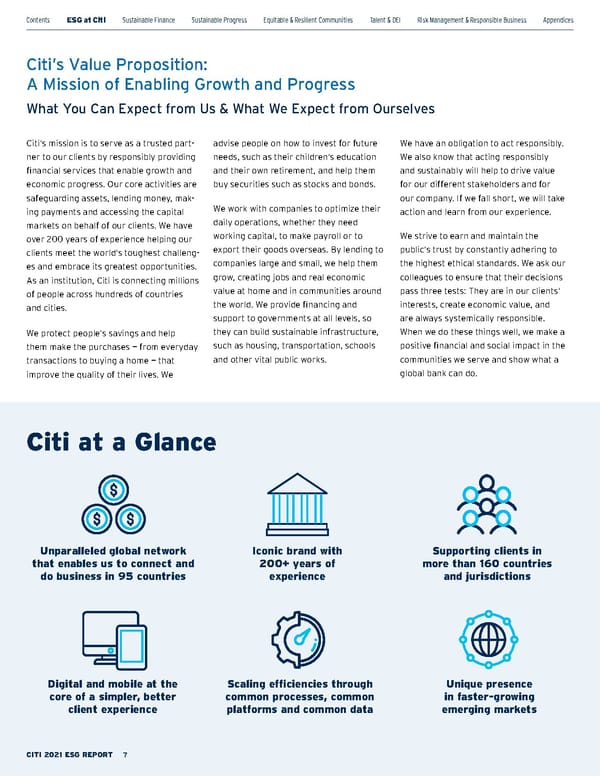
Citi’s mission is to serve as a trusted part - ner to our clients by responsibly providing financial services that enable growth and economic progress. Our core activities are safeguarding assets, lending money, mak - ing payments and accessing the capital markets on behalf of our clients. We have over 200 years of experience helping our clients meet the world’s toughest challeng - es and embrace its greatest opportunities. As an institution, Citi is connecting millions of people across hundreds of countries and cities. We protect people’s savings and help them make the purchases — from everyday transactions to buying a home — that improve the quality of their lives. We advise people on how to invest for future needs, such as their children’s education and their own retirement, and help them buy securities such as stocks and bonds. We work with companies to optimize their daily operations, whether they need working capital, to make payroll or to export their goods overseas. By lending to companies large and small, we help them grow, creating jobs and real economic value at home and in communities around the world. We provide financing and support to governments at all levels, so they can build sustainable infrastructure, such as housing, transportation, schools and other vital public works. We have an obligation to act responsibly. We also know that acting responsibly and sustainably will help to drive value for our different stakeholders and for our company. If we fall short, we will take action and learn from our experience. We strive to earn and maintain the public’s trust by constantly adhering to the highest ethical standards. We ask our colleagues to ensure that their decisions pass three tests: They are in our clients’ interests, create economic value, and are always systemically responsible. When we do these things well, we make a positive financial and social impact in the communities we serve and show what a global bank can do. Citi at a Glance Unparalleled global network that enables us to connect and do business in 95 countries Digital and mobile at the core of a simpler, better client experience Scaling efficiencies through common processes, common platforms and common data Unique presence in faster-growing emerging markets Iconic brand with 200+ years of experience Supporting clients in more than 160 countries and jurisdictions Citi’s Value Proposition: A Mission of Enabling Growth and Progress What You Can Expect from Us & What We Expect from Ourselves Contents ESGatCiti SustainableFinance SustainableProgress Equitable&ResilientCommunities Talent&DEI RiskManagement&ResponsibleBusiness Appendices CITI 2021 ESG REPORT 7
Our ESG Strategy Through our business, we address some of society’s greatest challenges. In recent years, we have continued to advance our leadership and partnerships across the industry as we further hone our environmental, social and governance (ESG) strategy and approach to managing ESG issues and opportunities. Helping t o c lose t he ra cial w ealth g ap in t he U nited S tates ra nks a mong o ur top p riorities, a nd i n 2 021, w e m ade tremendous p rogress o n o ur Action for Racial Equity c ommitment, w orking a cross our b usinesses t o i dentify w ays w e c an help a ddress t he ra cial w ealth g ap. A s of N ovember 2 021 — o ne y ear i nto o ur three-year c ommitment — C iti a nd t he C iti Foundation h ad a lready i nvested $ 1 b illion in s trategic i nitiatives t o h elp c lose t he racial w ealth g ap a nd i ncrease e conomic mobility in the United States. We committed to c onduct a t hird-party ra cial e quity a udit to e valuate o ur Action for Racial Equity goals a nd l aunched t he Di verse F inancial Institutions G roup, a c entralized t eam within C iti t hat i s s erving a s a h ub t o l ead and e xpand fi rm-wide en gagement w ith minority d epository ins titutions ( MDIs), diverse b roker-dealers a nd di verse a sset managers. R ead m ore a bout o ur ra cial equity i nitiatives i n t he Equitable an d Resilient Co mmunities s ection. Additionally in 2021, we announced two significant, new ESG commitments: a pledge to achieve net zero greenhouse gas (GHG) emissions by 2050 and a commitment of $1 trillion in sustainable finance by 2030 to address the impacts of climate change and other pivotal environmental and social issues that align with the United Nations Sustainable Development Goals (SDGs). These followed our most recent Sustainable Pr ogress Strategy , which we launched one year earlier. Our ESG strategy is a central element of our business model and critical to our strategy for growth. To help us achieve our $500 Billion Social Finance Goal, we broadened the focus of the Citi Social Finance team (formerly Citi Inclusive Finance) to develop platforms and client solutions to help expand financial inclusion, accelerate access to basic services, boost job creation and scale social infrastructure development in emerging m arkets. We believe that global financial institutions like Citi have the opportunity — and the responsibility — to play a leading role in helping to drive the transition to a low-carbon economy. We are prepared to implement the significant changes needed in our business, and to support the substantial changes that will be required for the world to transition and align with the goals of the Paris Agreement. Contents ESGatCiti SustainableFinance SustainableProgress Equitable&ResilientCommunities Talent&DEI RiskManagement&ResponsibleBusiness Appendices CITI 2021 ESG REPORT 8
Net zero involves rethinking our business and helping our clients rethink theirs. We can have the biggest impact by reducing Scope 3 financed emissions, 1 particularly for carbon-intensive sectors such as Agriculture, Aluminum, Cement, Coal, Commercial Real Estate, Iron and Steel, Oil and Gas, Power Generation and Transport. To reach our net zero target, we will need to work closely with our clients on their own transitions. Following our net zero announcement, we formed an internal Net Zero Task Force to help determine a framework, scope and the methodologies to guide our progress toward this commitment. For our Energy and Power loan portfolios, we conducted an initial assessment of base - line emissions, set interim 2030 emissions reduction targets, and developed initial transition plans. Learn more in the Climate Risk & Net Zero section and in our 2021 Task Force on Climate-related Financial Disclosures (TCFD) Report: Citi’s Approach to Climate Change and Net Zero . ESG Across Our Business Our ESG focus is essential to our firm-wide business strategy, and many of our busi - ness units have expanded their capacity and capabilities to serve the growing ESG-related needs of our clients. Across the firm, our business units are prepared to support and work with our clients through sustainable finance, providing a variety of products and services with environmental and/or social themes. We h ave E SG s pecialists i n B anking, C apital Markets and Advisory; Global Markets; Treasury and Trade Solutions; and Citi Global Wealth. We have expanded our global Social Finance specialist group and formed new teams to engage with clients on ESG goals and targets. Together, these businesses contribute to our $1 trillion sustainable fin ance commitment. ESG Principles and Guidelines In response to the increasing need for clients to see how we are addressing ESG — and in step with global best prac - tices — we have aligned our reporting with the frameworks and guidance of the Global Reporting Initiative and UN G uiding Principles Reporting Framework . We are also using three relevant sector standards from the Sustainability A ccounting Standards B oard , and we’re addressing the Principles for Responsible Banking . We also include examples of our work that align with the UN SDGs and the UN Global Compact . In addition, we recently released our 2021 TCFD Report , which further illustrates how climate-related risks and opportunities are central to our business. 1. Financed emissions are the GHG emissions generated by the operations and entities that financial institutions lend money to or invest in. Contents ESGatCiti SustainableFinance SustainableProgress Equitable&ResilientCommunities Talent&DEI RiskManagement&ResponsibleBusiness Appendices CITI 2021 ESG REPORT 9
ESG Governance at Citi Good governance is a fundamental principle at Citi, and we work to ensure that we are at the leading edge of best practices. We strive to maintain the highest standards of ethical conduct — reporting with accuracy and transparency and complying with the laws, rules and regulations that govern Citi’s businesses. Corporate Governance Our governance structures, policies and processes serve employee, client and community needs; promote a culture of accountability and ethical conduct across our firm; and support our commitment to address global challenges through our core business. Citi’s Board of Directors plays an important role in providing oversight of our efforts to ensure responsible business practices. For example, the Personnel and Compensation Committee reviews all compensation programs, including incentive compensation, so that they do not, among other things, encourage imprudent risk taking. The Nomination, Governance and Public Affairs Committee (NGPAC) oversees Citi’s global ESG activities and performance. Our Ethics, Conduct and Culture Committee reflects our commitment to promote a strong culture of ethical conduct. The Risk Management Committee also provides oversight of climate risk. Standing committees of our Board include: • Audit • Ethics, Conduct and Culture • Executive • Nomination, Governance and Public Affairs • Personnel a nd C ompensation • Risk Management In addition, the Board formed the Transformation Oversight Committee, an ad hoc committee to provide oversight of management’s remediation of the issues identified in the consent orders with the Federal Reserve Board and Office of the Comptroller of the Currency. See our website for more information about Citi’s corporate governance, includ - ing our Board committee charters. See our 2021 TCFD Report for details on our gover - nance for climate change specifically. ESG Governance The NGPAC oversees our ESG activities. This committee’s responsibilities include reviewing our policies and programs for sustainability, climate change, human rights, diversity and other material ESG issues, as well as advising on engage - ment with external stakeholders. For more information on the roles and responsibilities of this committee, see the Nomination, Governance and Public Affairs Committee charter . In July 2021, we formed a new Global ESG Council to provide a senior management forum for oversight of our ESG commit - ments and ambition. The formation of the Council highlights our commitment to ESG matters, including our climate-related strategies, at the highest level of our organization. Chaired by our CEO, the Council meets on a near-monthly basis and includes members of the Executive Management Team as well as internal Contents ESGatCiti SustainableFinance SustainableProgress Equitable&ResilientCommunities Talent&DEI RiskManagement&ResponsibleBusiness Appendices CITI 2021 ESG REPORT 10
subject matter experts. Steering groups, including the Climate Risk Steering Group, the Net Zero Task Force and Global Sustainability Steering Committee, continue to operate, and the leads of those steering groups are members of and provide reports to the Global ESG Council. Learn more in our 2021 TCFD Report . Sustainability and Climate Change Citi’s Board of Directors and senior management continue to expand the governance of climate risk and integrate climate considerations into their priorities. In 2021, in addition to the announcement of our net zero commitment and the creation of our new Global ESG Council, we accomplished t he f ollowing: • Grew our dedicated Climate Risk team with additional expertise in credit risk, scenario analysis, stress testing and regulatory en gagement • Rolled out our first training module on climate risk • Created the Natural Resources & Clean Energy Transition team to combine our Energy, Power and Chemicals businesses in order to assist our clients across these sectors as they transition • Established our Net Zero Task Force, a cross-functional group to support the development and launch of our net zero plan. The Task Force is led by our Chief Sustainability Officer and includes leaders from diverse business units such as Independent Risk Management; Banking, Capital Markets, and Advisory; Global Markets; Personal Banking & Wealth Management; as well as Global Public Affairs, Enterprise Operations & Technology, Legal and Finance. The Board and senior management have also increased the frequency and depth of conversations regarding climate matters. Citi’s Board has ultimate oversight of Citi’s approaches to considering, evaluating and integrating climate-related risks and opportunities throughout the organization. The Board receives reports from key personnel on Citi’s progress and key issues on a periodic basis. In addition to reporting to the full Board, the NGPAC provides oversight of sustainability activities and performance generally and the firm’s climate change efforts specifically, and the Risk Management Committee (RMC) provides oversight of climate change risk. The N GPAC r eceives p eriodic u pdates f rom Citi’s C hief S ustainability O fficer ( CSO) and t he h ead o f C ommunity I nvesting a nd Development. T he N GPAC a lso r eviews Citi’s g overnance a nd s ignificant p olicies and p rograms f or su stainability a nd climate c hange i ssues a nd a dvises m anage - ment o n o ur e ngagement w ith i nvestors and e xternal s takeholders o n t hese t opics. For more information on the roles and responsibilities o f t he N GPAC, p lease s ee our NGPAC C harter . T he R MC p rovides oversight o f C iti’s R isk M anagement function a nd r eviews C iti’s r isk p olicies a nd frameworks. F or m ore i nformation on t he roles and responsibilities of this commit - tee, p lease s ee o ur RMC Charter . In 2020 into 2021, the NGPAC reviewed and discussed investor and market devel - opments related to net zero, including a shareholder proposal pertaining to net zero, and considerations for Citi as it delib - erated on the implications of a potential net zero commitment. These discussions continued with the full Board throughout 2021. During 2021, the full Board partic - ipated in a climate education session facilitated by the Head of Climate Risk, the CSO and the Head of Corporate Banking. The full Board received reports from the CSO regarding sustainability activities and performance, including those related to climate change and Citi’s net zero plan, and the RMC received reports from the Head of Climate Risk regarding emerging bank regulatory trends on climate risk and Citi’s approach to meeting them. Members of the Board also participated in investor calls on a variety of governance, climate risk and environmental and social matters. Senior managers from Global Public Affairs, Risk, Finance, Legal, Operations & Technology and various business units from our Institutional Clients Group also contribute expertise to address the chal - lenges presented by climate change. Learn more in the Climate Risk section and in our 2021 TCFD Report . Community Investing Citi C ommunity I nvesting a nd D evelopment (CID) is an integrated team that works across Citi’s businesses and functions to catalyze positive social impact in commu - nities around the world. CID comprises the following teams: • Citi Impact Fund invests in “double bottom line” companies that are addressing societal challenges, including workforce development, sustainability, physical and social infrastructure, and financial inclusion. • Citi Social Finance works across Citi businesses globally to catalyze scalable business platforms and client solutions that enable the bank, our clients and our partners to expand financial inclusion, accelerate access to basic services, boost job creation and scale social infrastructure development in emerging m arkets. • U.S. Business Partnerships leads Citi’s relationships with national civil rights and consumer protection organizations to gain insights into issues affecting low- and moderate-income communi - ties and communities of color, and catalyze product and service innova - tions that help expand financial access and close the racial wealth gap. Contents ESGatCiti SustainableFinance SustainableProgress Equitable&ResilientCommunities Talent&DEI RiskManagement&ResponsibleBusiness Appendices CITI 2021 ESG REPORT 11
• The U.S. Community Relations team, which includes Citi Volunteers, catalyzes social impact by engaging and partnering with local community leaders and organizations across the country. The team connects Citi’s people, expertise, resources, products and services to help expand equitable opportunities for all. The Citi Foundation is a separate legal entity funded by Citi to organize flagship community programming in three areas: youth economic opportunities, financial inclusion and community solutions. Underlying our approach is the notion that complex societal challenges require multifaceted solutions. We strive to share our expertise with, and learn from, our partners and stakeholders about ways we can enhance impact. This approach contributes directly to the UN Sustainable Development Goal SDG 17 , which seeks to strengthen the means of implementation and revitalize the global partnership for sustainable development. In particular, Citi’s efforts contribute to target 17.3 , which seeks to mobilize additional finan - cial resources for developing countries from multiple sources , including the private sector, to ensure that sufficient financing is available to achieve the SDGs. SDG Goal 17: Partnerships for the Goals Learn more about this team’s efforts in the Equitable and Resilient Communities section . Talent and DEI Citi’s Chief Diversity, Equity and Inclusion (DEI) Officer and Global Head of Talent oversees our efforts to promote diversity, equity and inclusion in the workplace. Reporting to the Global Head of Human Resources, the Chief DEI Officer and Global Head of Talent works in partnership with senior management, particularly members of the Executive Management Team, who co-chair our Affinity groups. Our talent and DEI efforts are governed by the Citi Board of Directors. Ethics and Business Practices Ethics and responsible business practices are among the most material ESG issues for Citi and our stakeholders. The Ethics, Conduct and Culture Committee of the Board oversees management’s efforts to foster a culture of ethics within the company and receives regular reports from senior management on the progress of those efforts. To learn more about the responsibilities of the committee, download the Ethics, Conduct and Culture Committee C harter . The Ethics and Culture section of this report also provides more information about efforts to encourage a culture of ethics at Citi. Among its responsibilities, the Board’s Risk Management Committee reviews Citi’s risk appetite framework, including reputational risk appetite, and reviews and approves key risk policies, including those focused on environmental and social risk. Remuneration The Personnel and Compensation Committee of the Board holds senior executives responsible, and in turn senior executives hold their team members responsible, for managing our sustainability and other ESG-related efforts through incentive compensation decisions. Citi’s incentive compensation program is discre - tionary, not formulaic. Management of sustainability efforts is taken into account in the program in two ways. First, senior executives are held accountable for busi - ness performance through specific metrics designated on a position-by-position basis. Progress on our $1 trillion sustainable finance commitment and milestones for our net zero plan are incorporated into the executive scorecards of our CEO, the CEO of Citi’s Institutional Clients Group and our Head of Global Public Affairs. Second, climate change strategy and risk management performance goals are incor - porated i nto a nnual g oals a nd p erformance review processes for a number of our senior managers and their teams who are responsible for developing and implement - ing our approach to climate change. These managers include the Chief Sustainability Officer, Head of Environmental and Social Risk Management (ESRM), Head of Climate Risk and the Head of Construction and Sustainability, whose team is responsible for our environmental footprint goals. Corporate performance against scorecard metrics and individual performance against annual goals are two factors, among others, that are taken into account in determining incentive compensation. Diversity, equity and inclusion, including representation of women and U.S. Black colleagues at the Assistant Vice President to Managing Director levels, continue to be included in scorecards for our senior executives. Citi also incorporates share - holder and stakeholder input on executive pay into our Compensation Philosophy. Contents ESGatCiti SustainableFinance SustainableProgress Equitable&ResilientCommunities Talent&DEI RiskManagement&ResponsibleBusiness Appendices CITI 2021 ESG REPORT 12
Our Material ESG Issues: Citi in a Global Context In 2020, we conducted a materiality assessment to identify our most relevant (or “material”) reporting topics from an ESG perspective — which is a broader standard than that used in our financial disclosures. These topics are incorporated in the material issues table on the next page. Based o n i nternal s takeholder i nterviews and external research, the ESG topics identified, w hich w e r efer t o a s “m aterial ESG i ssues” t hroughout t his r eport, i nform which i ssues w e r eport o n, w hich i ssues w e consider r aising t o o ur B oard o f D irectors, and how we establish our ESG priorities. When t aken a s a s et, t he i ssues t hat su rfaced in the ESG materiality analysis indicate an increase in s takeholder e xpectations, in particular w ith r egard t o i ssues c onnected to climate change and social justice. The pandemic a lso p laced in creased e mphasis on employee health and well-being. Most of t he m aterial E SG i ssues o utlined o n t he following pages are not new to Citi nor to our stakeholders. What is new, however, is t he m agnitude a nd c omplexity o f t he changes required to rise to these challenges. For example, there is wide recognition that climate change is happening faster and with more i mpact t han p reviously r ealized; i n parallel, s ociety i s r eacting t o u nacceptable levels of social inequity. This assessment mirrors — and informs — our increased st rategic e fforts on t hese i ssues. It h as a lso d riven o ur in creased r eporting o n these ma terial t opics. Contents ESGatCiti SustainableFinance SustainableProgress Equitable&ResilientCommunities Talent&DEI RiskManagement&ResponsibleBusiness Appendices CITI 2021 ESG REPORT 13
Material ESG Topics * Material ESG Topics* K ey Stakeholders Clients and Customers Employees Suppliers Communities and NGOs Shareholders Government & Regulators Environmental Biodiversity Climate Change Environmental Justice Operational Footprint Products and Services with Environmental or Social Benefits Social Community Investment COVID-19 Employee Health and Well-being Financial Inclusion Human Rights Racial Equity/Racial Justice Talent Attraction, Retention and Development Workforce Diversity, Inclusion and Equal Opportunity Governance Business Ethics Business Model Resilience Data Security/ Financial Product Safety ESG Governancee Innovation and Digitization Public Policy and Regulation Reform Stakeholder Engagement Systemic Risk Management Transparency and Trust * These are the topics identified during the materiality assessment we conducted in 2020. Contents ESGatCiti SustainableFinance SustainableProgress Equitable&ResilientCommunities Talent&DEI RiskManagement&ResponsibleBusiness Appendices CITI 2021 ESG REPORT 14
Material Topics Definitions/Relevance to Citi Biodiversity Our role in preventing the decline in the number, genetic variability and variety of species essential to global and bioregional ecosystem resilience through our financing Business Ethics Following our policies, including compliance with laws, anti-corruption and bribery, anti-competitive behavior, paying taxes and transparent political engagement Business Model Resilience Creating, developing and deploying a business model that can meet significant challenges such as natural disasters, health pandemics and global climate change Climate Change Reducing our own contribution to climate change while financing and facilitating projects that accelerate the transition to a low-carbon economy Community Investment Enabling greater cohesion with community stakeholders through public-private partnerships, monetary or in-kind donations, volunteer time or employee fundraising/match schemes COVID-19 Adjusting our operations and long-term strategy to allow us to respond effectively to current and future global health crises Data Security/Financial Product Safety Executing the policies, procedures and programs designed to safeguard the privacy of information shared by employees, customers and clients Employee Health and Well-being Creating workspaces that promote employee wellness, and engaging employees in our effort to maintain a culture of safety, sustainability and wellness Environmental Justice Enacting environmental policies and practices that ensure the fair treatment and involvement of people of all races, national origins and income ESG Governance Aligning with stakeholder interests while protecting the environment, advancing social causes and conducting ourselves responsibly Financial Inclusion Engaging with community banks and low-income stakeholders, and orienting the company’s place in the market to serve underserved communities Human Rights Respecting the basic rights and freedoms of clients, customers, employees, suppliers and Indigenous communities in all our banking activities Innovation and Digitization Problem-solving with clients, partnering with experts and fostering an environment that values experimentation and technological advancements Operational Footprint Reducing direct impacts by managing energy use, water consumption, recycling, waste and green building design Products and Services with Environmental or Social Benefits Providing products and services that drive more equity in society and that protect the environment Public Policy and Regulation Reform Advocating for public policies that support the interests of our company, clients and employees in the countries and regions where we operate Racial Equity/Racial Justice Implementing policies and programs that promote equal opportunity and treatment for people of all races Stakeholder Engagement Actively exchanging input, insights, expertise and perspectives with a wide array of stakeholders as we pursue our sustainability objectives Systemic Risk Management Navigating an evolving risk landscape to make responsible decisions and serve the long-term interests of our clients and the communities in which they operate Talent Attraction, Retention and Development Adopting an approach to recruiting, hiring, developing and retaining employees to create positive working conditions so that our employees can thrive Transparency and Trust Protecting the confidentiality of our clients’ information while disclosing information to stakeholders that demonstrates our accountability and credibility Workforce Diversity, Inclusion and Equal Opportunity Enhancing our efforts to promote equal opportunities for all people, and supporting a culture of diversity, equity and inclusion in the workplace Contents ESGatCiti SustainableFinance SustainableProgress Equitable&ResilientCommunities Talent&DEI RiskManagement&ResponsibleBusiness Appendices CITI 2021 ESG REPORT 15
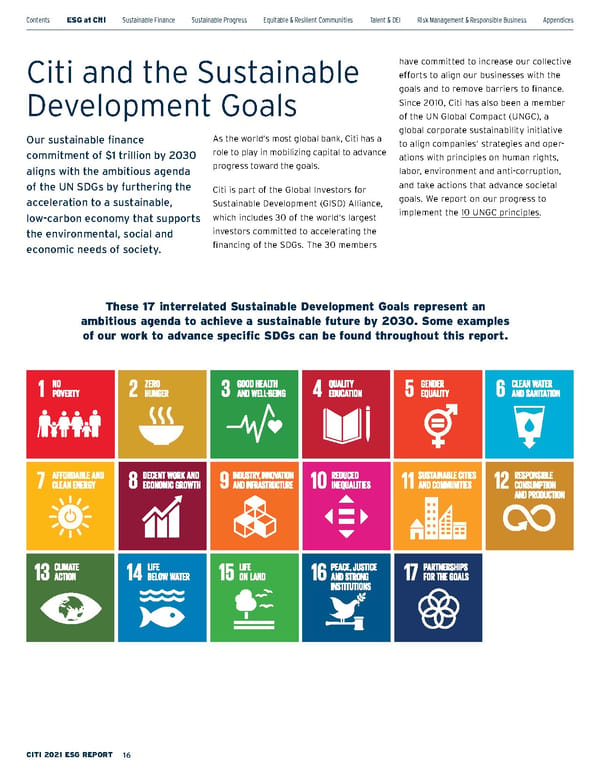
These 17 interrelated Sustainable Development Goals represent an ambitious agenda to achieve a sustainable future by 2030. Some examples of our work to advance specific SDGs can be found throughout this report. Citi and the Sustainable Development Goals Our sustainable finance commitment of $1 trillion by 2030 aligns with the ambitious agenda of the UN SDGs by furthering the acceleration to a sustainable, low-carbon economy that supports the environmental, social and economic needs of society. As the world’s most global bank, Citi has a role to play in mobilizing capital to advance progress toward the goals. Citi i s p art o f t he G lobal I nvestors f or Sustainable D evelopment ( GISD) A lliance, which i ncludes 3 0 o f t he w orld’s l argest investors c ommitted t o ac celerating t he financing o f t he S DGs. T he 3 0 m embers have c ommitted t o i ncrease o ur c ollective efforts t o a lign o ur b usinesses w ith t he goals a nd t o r emove b arriers t o fi nance. Since 2 010, C iti h as a lso b een a m ember of t he U N G lobal C ompact ( UNGC), a global c orporate s ustainability i nitiative to a lign c ompanies’ s trategies a nd o per - ations w ith p rinciples o n h uman r ights, labor, e nvironment a nd a nti-corruption, and t ake a ctions t hat a dvance s ocietal goals. W e r eport o n our p rogress t o implement t he 10 U NGC p rinciples . Contents ESGatCiti SustainableFinance SustainableProgress Equitable&ResilientCommunities Talent&DEI RiskManagement&ResponsibleBusiness Appendices CITI 2021 ESG REPORT 16
Stakeholder Engagement at Citi As a signatory to the Business Roundtable’s Statement on the Purpose of a Corporation , Citi is committed to ongoing and extensive engagement with our stakeholders. We su bscribe t o a b road s takeholder c api - talism approach, believing that we are best able t o c reate b usiness v alue w hen w e s erve the i nterests o f a w ide a rray o f s takeholders, including our shareholders. We made a deliberate e ffort t o c ontinue st akeholder engagement i n a p andemic en vironment. To fu lfill t his a pproach, w e r egularly r eview our s takeholder p artnerships a cross a range o f f unctions, in cluding P ublic A ffairs, Investor R elations, H uman R esources and C orporate G overnance, a s w ell a s Sustainability, G overnment A ffairs a nd o ther teams in P ublic A ffairs. The table below includes examples of our recent st akeholder e ngagement e fforts. AMERICA’S MOST JUST COMPANIES In recognition of our ESG performance, Citi was named among the Top 15 companies in JUST Capital’s 2022 rankings . Stakeholder Group How We Engage Examples from 2021 Clients and Customers • Meetings to share Citi’s ESG perfor - mance and to understand our clients’ approaches to climate change as well as managing environmental and social risks • Social media, including our Customer Service Twitter handle (@AskCiti) • Customer satisfaction survey • Citi Blog • Hosted a feedback session for stakeholders including clients, investors and NGOs to provide commentary on our TCFD disclosures and our approach toward setting net zero targets and measuring our baseline emissions. Learn more in the Climate Risk & Net Zero section • Worked with clients on sustainable finance transactions • Engaged with clients to discuss our approach to environmental, social and climate risk management and disclosure • Participated in a number of materiality exercises for clients’ ESG reporting Employees • Company intranet, email, mail and meetings • Voice of the Employee surveys • Affinity Networks and Green Champions • Online training • Performance reviews • Citi Blog • Nearly 196,000 staff completed Financial Crimes compliance training, including on anti-money laundering, sanctions and anti- bribery topics • Rolled out a new Climate Risk training for employees in Risk functions • Featured stories on Citi’s intranet and in blog posts from Citi senior executives, employees and partners, highlighting our progress on ESG priorities • Our Global Sustainability Network consists of employees from across Citi whose work directly relates to sustainability and ESG, to promote knowledge sharing and alignment on related activities • Our Champions groups within our Banking, Capital Markets and Advisory; Global Markets; and Treasury and Trade Solutions businesses are comprised of employee volunteers. The Champions have quarterly global calls and monthly regional calls to share business updates and best practices for sustainable finance, net zero transition and market developments. Suppliers • Meetings, calls, conferences and workshops • Corporate Responsibility Questionnaire to help assess management of ESG issues, including environmental sustainability and modern slavery • Hosted multiple events to create opportunities to engage with diverse suppliers and help to build their capacity, including sustainable business practices Contents ESGatCiti SustainableFinance SustainableProgress Equitable&ResilientCommunities Talent&DEI RiskManagement&ResponsibleBusiness Appendices CITI 2021 ESG REPORT 17
Stakeholder Group How We Engage Examples from 2021 Communities and Nongovernmental Organizations (NGOs) • Specialized websites, including our Communities and Sustainability websites • Collaboration with community organizations and NGOs on issues relevant to their organizations and our business • Dialogue sessions with community advocates and leaders, civil rights and consumer protection organizations • Employee volunteering events • Our Head of Community Investing and Development chairs Living Cities, a collaborative of the largest philanthropic foundations in the United States dedicated to closing racial wealth gaps • Our Chief Sustainability Officer joined the board of the GOOD Institute, a social impact alliance • Thousands of employees participated in Citi’s annual Global Community Day Reimagined 2021, with more than 61,000 volunteer engagements across 81 countries and territories • Citi Foundation provides grants and works with local and national community organizations • The President of Citi Foundation serves on the Board of Directors of the Council on Foundations, a community of diverse philanthropic organizations advocating for progress Shareholders • Group calls and meetings (quarterly earnings calls, investor conferences and Citi-hosted group meetings) • One-on-one meetings to discuss financial performance and ESG issues • Communications through our Investor Relations and Corporate Governance teams • Engaged in person and virtually with more than 20 individual investor groups as part of our annual ESG investor roadshow, focused on climate change and diversity—our fourth year of dedicated ESG engagement Government and Regulators • Meetings, conference calls, lobbying activities, industry associations, public policy forums, press conferences, con - ferences and convenings • Membership on government councils and committees • Engaged with trade associations, such as the United States Chamber of Commerce, the Business Roundtable, and financial industry associations to help build the case for climate policy and supportive regulation • Member of the CEO Climate Dialogue, a cross-industry effort committed to advancing climate action and durable federal climate policy in the United States • Led the workstream to revitalize minority depository institutions (MDIs) and promote fair and equal access to financial products and services as part of the Office of the Comptroller of the Currency’s Project REACh Other Financial Institutions • Working groups • Joint projects • Industry groups, roundtables, workshops and events • Member of the Glasgow Financial Alliance for Net Zero (GFANZ) Principals Group and the Net Zero Banking Alliance (NZBA) Steering Group • Member of United Nations Environment Programme Finance Initiative’s (UNEP FI) Global Steering Committee and the Institute for International Finance’s Sustainable Finance Working Group • Joined the Corporate Call to Action: Coalition for Equity & Opportunity launched by the Connecticut Office of the Treasurer and the Ford Foundation • Led a working group focused on assessing best practices for developing effective operational level grievance mechanisms and enabling effective remedy for adverse human right impacts in project-related finance • Joined the UNEP FI’s Taskforce on Nature-related Financial Disclosures Forum Contents ESGatCiti SustainableFinance SustainableProgress Equitable&ResilientCommunities Talent&DEI RiskManagement&ResponsibleBusiness Appendices CITI 2021 ESG REPORT 18
In This Section 20 Our $1 Trillion Commitment Sustainable Finance Contents ESGatCiti SustainableFinance SustainableProgress Equitable&ResilientCommunities Talent&DEI RiskManagement&ResponsibleBusiness Appendices CITI 2021 ESG REPORT 19
We have committed $1 trillion to sustainable finance by 2030, a commitment that spans our business offerings and exemplifies how environmental and social finance are integrated across our businesses. The ambitious $1 trillion commitment will support innovation and collective action toward addressing the most significant global challenges that are outlined in the Paris Agreement and the UN Sustainable Development Goals (SDGs). Announced in April 2021, the $1 trillion commitment extended our previous environmental finance goal from $250 billion by 2025 to $500 billion by 2030. Through this commitment, we will finance and facilitate a wide array of climate solutions, such as renewable energy, clean technology, water conservation and sustainable transportation. We have also committed $500 billion toward activities in social finance, which includes important investments in education, affordable housing and basic infrastructure, health - care, economic inclusion and food security. Together, these $500 billion targets for environmental and social finance make up our $1 trillion commitment, which aims to further accelerate the transition to a sustainable, low-carbon economy that supports society’s environmental, social and ec onomic need s. Our $1 Trillion Commitment Contents ESGatCiti SustainableFinance SustainableProgress Equitable&ResilientCommunities Talent&DEI RiskManagement&ResponsibleBusiness Appendices CITI 2021 ESG REPORT 20
$1 Trillion in Sustainable Finance by 2030 $0 $250B $750B $1T by 2030 $500B $ 222 Billion Sustainable Finance Commitment Progress 2020-2021 Our $1 trillion sustainable finance commitment aims to further accelerate the transition to a sustainable, low- carbon economy that supports society’s environmental, social and economic needs. The commitment aligns with the ambitious agenda of the UN Sustainable Development Goals (SDGs). As the world’s most global bank, Citi has a role to play in mobilizing capital to advance progress toward the goals. We finance and facilitate sustainable activities to support the needs of people and communities around the world. Renewable Energy Sustainable Agriculture & Land Use Sustainable Transportation Water Conservation & Quality Economic Inclusion Education Food Security Healthcare Affordable Basic Infrastructure Affordable Housing Diversity & Equity Energy Efficiency G reen Buildings ENVIRONMENTAL FINANCE GOAL CRITERIA SOCIAL FINANCE GOAL CRITERIA Circular Economy Clean Technology Additional data related to our $1 trillion commitment can be found later in this chapter. $18.2B Asia Pacific $59.6B Europe, Middle East and Africa $9.5B Latin America $134.8B North America REGIONAL REPRESENTATION (2020-2021) World Bank Low-Income and Lower-Middle-Income Countries with Citi Presence Upper Middle-Income Countries with Citi Presence High-Income Countries with Citi Presence Contents ESGatCiti SustainableFinance SustainableProgress Equitable&ResilientCommunities Talent&DEI RiskManagement&ResponsibleBusiness Appendices CITI 2021 ESG REPORT 21
We believe that setting ambitious goals helps to drive innovation and accelerate progress. Reaching $1 trillion will require the development of innovative financing solutions. We will continue to focus on helping clients across all sectors, no matter where t hey a re i n t heir o wn s ustainability journeys, t o s upport t heir s trategic g oals and enable the development and integra - tion of sustainable business practices. Over recent years, we have seen the development of financial products that were relatively new, or even nonexistent, when we set our very first $50 billion climate finance goal in 2007. Thematic bonds, s ustainable s upply c hain fi nance a nd sustainability-linked b onds a nd l oans t hat are tied to ESG performance are contribut - ing to sustainable finance, and we expect to see further innovations in the coming years. Tracking Progress Each t ransaction w e fi nance or f acilitate must meet at least one of eight criteria for environmental finance or one of seven criteria for social finance to be counted toward t he o verall $ 1 t rillion c ommitment. These c riteria w ere i nformed b y e xternal standards a nd m ay t herefore b e su bject t o changes a s i ndustry g uidelines a re fu rther developed. Credit f or e ach e ligible t ransaction i s counted only once toward the $1 trillion commitment, e ven i f t he t ransaction m eets multiple criteria. Transactions that meet both en vironmental a nd s ocial c riteria are e venly s plit b etween t he $ 500 B illion Environmental Finance Goal and the $500 Billion Social Finance Goal — without double counting. B ecause o f t he i nterconnected nature o f su stainable fi nance, w e a re already se eing a n in creasing nu mber o f transactions with both environmental and social b enefits. We track our sustainable finance activities using third-party financial league table credit, where applicable. The industry league tables track public financial activ - ities and rank financial institutions based on their role (i.e. lead arranger, bookrun - ner, etc.) in each transaction. For financial products for which there are no league tables, we count the amount that reflects Citi’s financial involvement in the deal. Beyond c ounting t he fi nancial c redit, w e also c alculate t he e stimated e nvironmental and social impacts associated with a subset o f a ctivities w here f easible, su ch as a voided g reenhouse gas e missions, renewable e nergy c apacity a dded, j obs supported a nd p eople i mpacted. W e t ake a c onservative a pproach t o t he e stimation of impacts from the activities we finance and facilitate — including only deal activity for which reasonable methodologies and d ata s ources ar e a vailable, an d excluding d eals f or w hich w e h ave l imited transparency a nd d etails. W e e stimate that s ince 2 020, a pproximately 3 .9 m illion metric tons (mt) of greenhouse gas emissions h ave b een a voided a s a r esult o f our r enewable e nergy, g reen a ffordable housing an d e nergy e fficiency fin ancing activities. A dditionally, w e e stimate that o ur fi nancing a ctivities su pported approximately 1 .8 m illion j obs, a ffected 26 m illion p eople g lobally a nd c ontributed to a pproximately $ 9.5 b illion i n U .S. G DP. We c onsider i mpact m easurement a n a rea of o ngoing e ducation a nd i mprovement, and we will continue to challenge ourselves in t his a rea. Sustainable Finance in Action The global market for sustainable finance has been growing rapidly over the last few years in response to the climate emergency and COVID-19. Investors and companies alike recognize the pivotal role that the financial services sector will play in facilitating a socially responsible economic recovery that also accelerates the transition to a more sustainable, low-carbon economy. The volume of sustainable debt issuances, for example, broke records in 2021, surpassing $1.6 trillion — more than double the $762 billion of sustainable 1. Bloomberg NEF (BNEF), 1H 2022 Sustainable Finance Market Outlook . 2. https://www.refinitiv.com/perspectives/market-insights/sustainable-finance-continues-surge-in-2021/ . Contents ESGatCiti SustainableFinance SustainableProgress Equitable&ResilientCommunities Talent&DEI RiskManagement&ResponsibleBusiness Appendices CITI 2021 ESG REPORT 22
debt issuances in 2020, which itself had set records. 1 The sustainable mergers and acquisitions deal activity reached $197 billion in 2021, which was a 60% increase from 2020 activity. 2 Growth also continues to be seen in the markets for sustainability-linked financing, one of the fastest-growing innovations in sustainable finance. Sustainability-linked instruments a re g eneral c orporate p urpose transactions that use key performance indicators (KPIs) and sustainability targets to measure a company’s progress, which result in a reduced financing rate if the target is met or a penalty if the company fails to meet the target. With momentum gained in recent years, the growth of sustainability-linked financing extended to the global leveraged finance markets in 2021; 2 sustainability-linked transaction volumes increased significantly across leveraged loan and high-yield bond issuances, highlighting the popularity of tying sustainability performance to cost of financing. This innovation is also expected to grow in the derivative markets, with sustainability-linked derivatives. Acknowledging this momentum in the market, we count sustainability-linked instruments toward Citi’s sustainable finance goal when they incorporate sustainability key performance indicators and targets that are aligned with at least one of the goal criteria. The growth of sustainable capital markets has also been driven by corporations, sovereigns and supranational institutions focused on achieving their sustainability commitments, contributing to the SDGs and aligning with the goals of the Paris Agreement. Many of our business units across the bank contribute to our $1 trillion commit - ment. There are global industry specialist teams that focus on different sectors and industries, such as the recently formed Natural Resources & Clean Energy Transition team, which engages with our clients to support their low-carbon transition efforts, as well as the Citi Social Finance team, which partners with busi - ness units across Citi to help drive inno - vative efforts on social finance activities in emerging markets. In many instances, the deals have integrated and interrelated environmental and social elements and impacts. For additional information on new teams we created or restructured over the last few years to engage with clients on their sustainability and transition journeys, see the Sustainable Pr ogress s ection. The following are just some examples of innovative environmental and social finance transactions from 2021 that will be counted toward the overall $1 trillion commitment. INCENTIVIZING SUPPLY CHAINS: M c CORMICK & COMPANY Sustainable Agriculture In 2021, Citi par tnered with McCormick & Company, a global leader in flavor, and the International Finance Corporation (IFC) to provide McCormick’s suppliers with financial incentives linked to improvements in measures of social and environmental sustainability. McCormick’s supply chain spans over 3,000 agricultural products sourced from more than 85 countries. Under the initiative, suppliers can qualify for discounted rates on short-term working capital financing when they achieve sustainability standards accepted by McCormick. These standards include performance on labor conditions, health and safety practices, crop management, environmental impact, farmer resilience and women’s empowerment. The partnership included an advisory component in Vietnam, where IFC is helping McCormick build a more sustainable, traceable, certified and quality-compliant pepper supply chain through capacity development and the empowerment of women farmers. 2. https://www.refinitiv.com/perspectives/market-insights/sustainable-finance-continues-surge-in-2021/ . Contents ESGatCiti SustainableFinance SustainableProgress Equitable&ResilientCommunities Talent&DEI RiskManagement&ResponsibleBusiness Appendices CITI 2021 ESG REPORT 23
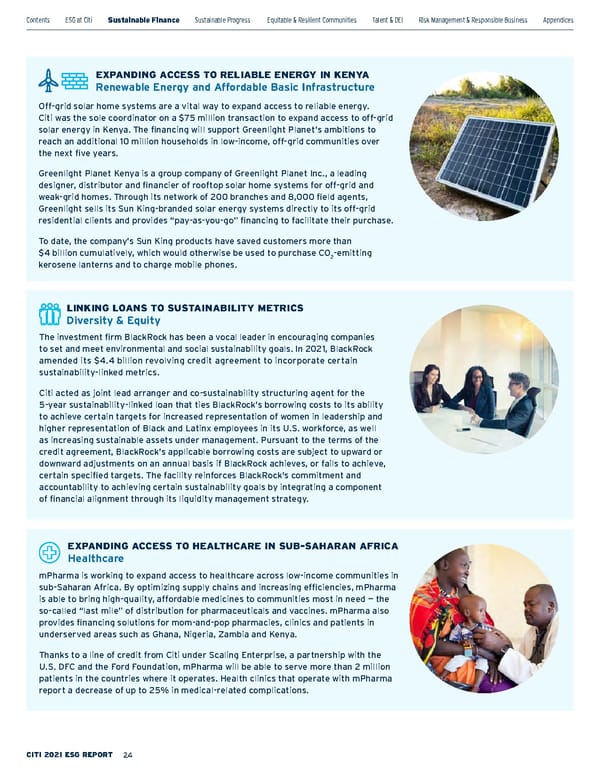
LINKING LOANS TO SUSTAINABILITY METRICS Diversity & Equity The investment firm BlackRock has been a vocal leader in encouraging companies to set and meet environmental and social sustainability goals. In 2021, BlackRock amended its $4.4 billion revolving credit agreement to incorporate certain sustainability-linked metrics. Citi acted as joint lead arranger and co-sustainability structuring agent for the 5-year sustainability-linked loan that ties BlackRock’s borrowing costs to its ability to achieve certain targets for increased representation of women in leadership and higher representation of Black and Latinx employees in its U.S. workforce, as well as increasing sustainable assets under management. Pursuant to the terms of the credit agreement, BlackRock’s applicable borrowing costs are subject to upward or downward adjustments on an annual basis if BlackRock achieves, or fails to achieve, certain specified targets. The facility reinforces BlackRock’s commitment and accountability to achieving certain sustainability goals by integrating a component of financial alignment through its liquidity management strategy. EXPANDING ACCESS TO RELIABLE ENERGY IN KENYA Renewable Energy and Affordable Basic Infrastructure Off-grid solar home systems are a v ital way to expand access to reliable energy. Citi was the sole coordinator on a $75 million transaction to expand access to off-grid solar energy in Kenya. The financing will support Greenlight Planet’s ambitions to reach an additional 10 million households in low-income, off-grid communities over the next five years. Greenlight Planet Kenya is a group company of Greenlight Planet Inc., a leading designer, distributor and financier of rooftop solar home systems for off-grid and weak-grid homes. Through its network of 200 branches and 8,000 field agents, Greenlight sells its Sun King-branded solar energy systems directly to its off-grid residential clients and provides “pay-as-you-go” financing to facilitate their purchase. To date, the company’s Sun King products have saved customers more than $4 billion cumulatively, which would otherwise be used to purchase CO 2 -emitting kerosene lanterns and to charge mobile phones. EXPANDING ACCESS TO HEALTHCARE IN SUB-SAHARAN AFRICA Healthcare mPharma is working to expand access to healthcare across low-income communities in sub-Saharan Africa. By optimizing supply chains and increasing efficiencies, mPharma is able to bring high-quality, affordable medicines to communities most in need — the so-called “last mile” of distribution for pharmaceuticals and vaccines. mPharma also provides financing solutions for mom-and-pop pharmacies, clinics and patients in underserved areas such as Ghana, Nigeria, Zambia and Kenya. Thanks to a line of credit from Citi under Scaling Enterprise, a partnership with the U.S. DFC and the Ford Foundation, mPharma will be able to serve more than 2 million patients in the countries where it operates. Health clinics that operate with mPharma report a decrease of up to 25% in medical-related complications. Contents ESGatCiti SustainableFinance SustainableProgress Equitable&ResilientCommunities Talent&DEI RiskManagement&ResponsibleBusiness Appendices CITI 2021 ESG REPORT 24
SUPPORTING COVID-19 RESILIENCE THROUGH UNICEF Healthcare The global pandemic has exacerbated poverty rates and global inequality, affecting millions of children worldwide. The World Bank and the United Nations Children’s Fund (UNICEF) were looking for new ways to accelerate funding to meet the increasingly urgent needs for their joint pandemic relief programs. Citi acted as sole structure and arranger for a first-of-its kind $100 million bond transaction from the World Bank’s International Bank for Reconstruction and Development, which allowed UNICEF to access capital markets funding to support its private sector fundraising activities. The bond gave institutional and high net worth investors an opportunity to support UNICEF’s work with children, including COVID-19 resilience programs around the world. The cash flows on the bond are linked to future donations to UNICEF. The bond proceeds will support two programs: $50 million will be used by the World Bank to finance its sustainable development programs, including projects targeting the health and socioeconomic impacts of COVID-19; the other $50 million will be allocated to UNICEF to expand programs in 18 countries, targeting future funding of up to $450 million. EMPOWERING WOMEN ENTREPRENEURS IN MEXICO Economic Inclusion and Diversity & Equity Women represent one-third of entrepreneurs in Mexico, yet they typically have few opportunities to access financial investments for their businesses. In 2021, Citi partnered with the U.S. International Development Finance Corporation (DFC) and Japan International Cooperation Agency (JICA) to provide $70 million to Banco Compartamos, the largest microfinance institution in Mexico. Compartamos, which translates to “let’s share” in Spanish, is using the funding to support and empower more than 135,000 small businesses, approximately 90% of them women-owned. A portion of the loans is dedicated to the less developed regions of the country, including Chiapas, Oaxaca, Guerrero and Puebla. Learn more in this video . DEVELOPING MORE SUSTAINABLE RAIL LINES Sustainable Transportation The devel opment of a 25-kilometer monorail line is one of the largest construction projects in Panama since the expansion of the Panama Canal. Citi acted as sole global coordinator and mandated lead arranger for $2 billion in green loans for the Panama Metro project on behalf of a consortium of Korean companies led by Hyundai Engineering & Construction. The elevated train line will have initial capacity to transport 18,000 passengers per hour in each direction, with an ultimate goal of more than 30,000 passengers per hour in each direction. The monorail will incorporate Hitachi’s B-CHOP system, which harnesses the train’s regenerative energy to substantially reduce energy consumption while the train is in braking mode. The system is expected to cut back 20,000 tons of carbon dioxide emissions annually while providing energy for future use. Contents ESGatCiti SustainableFinance SustainableProgress Equitable&ResilientCommunities Talent&DEI RiskManagement&ResponsibleBusiness Appendices CITI 2021 ESG REPORT 25
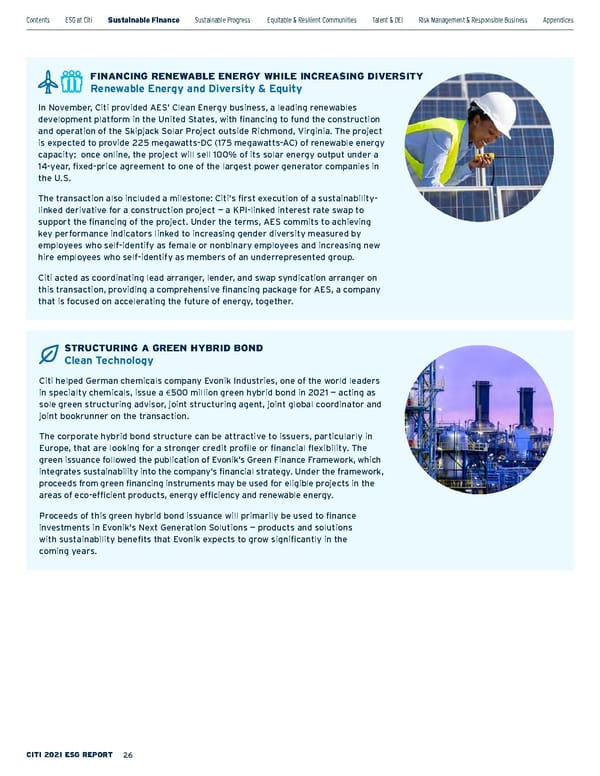
STRUCTURING A GREEN HYBRID BOND Clean Technology Citi helpe d German chemicals company Evonik Industries, one of the world leaders in specialty chemicals, issue a € 500 million green hybrid bond in 2021 — acting as sole green structuring advisor, joint structuring agent, joint global coordinator and joint bookrunner on the transaction. The corporate hybrid bond structure can be attractive to issuers, particularly in Europe, that are looking for a stronger credit profile or financial flexibility. The green issuance followed the publication of Evonik’s Green Finance Framework, which integrates sustainability into the company’s financial strategy. Under the framework, proceeds from green financing instruments may be used for eligible projects in the areas of eco-efficient products, energy efficiency and renewable energy. Proceeds of this green hybrid bond issuance will primarily be used to finance investments in Evonik’s Next Generation Solutions — products and solutions with sustainability benefits that Evonik expects to grow significantly in the coming years. FINANCING RENEWABLE ENERGY WHILE INCREASING DIVERSITY Renewable Energy and Diversity & Equity In November, C iti provided AES’ Clean Energy business, a leading renewables development platform in the United States, with financing to fund the construction and operation of the Skipjack Solar Project outside Richmond, Virginia. The project is expected to provide 225 megawatts-DC (175 megawatts-AC) of renewable energy capacity; once online, the project will sell 100% of its solar energy output under a 14-year, fixed-price agreement to one of the largest power generator companies in the U.S. The transaction also included a milestone: Citi’s first execution of a sustainability- linked derivative for a construction project — a KPI-linked interest rate swap to support the financing of the project. Under the terms, AES commits to achieving key performance indicators linked to increasing gender diversity measured by employees who self-identify as female or nonbinary employees and increasing new hire employees who self-identify as members of an underrepresented group. Citi acted as coordinating lead arranger, lender, and swap syndication arranger on this transaction, providing a comprehensive financing package for AES, a company that is focused on accelerating the future of energy, together. Contents ESGatCiti SustainableFinance SustainableProgress Equitable&ResilientCommunities Talent&DEI RiskManagement&ResponsibleBusiness Appendices CITI 2021 ESG REPORT 26
$1 Trillion Sustainable Finance Commitment Financial Data * In billions USD Sustainable Finance 2020** 2021 $ % Environmental Finance $ 33.0 $ 130.1 $ 163.1 73.4% Social Finance $ 29.4 $ 2 9.6 $ 59.0 26.6% Total $ 62.4 $ 159.7 $ 222 .1 100% Sustainable Finance Criteria 2020 2021 Total % Circular Economy 0.4 2.1 2.5 1.1% Clean Technology 0.6 0.0 0.6 0.3% Energy Efficiency 1.2 2.5 3.7 1.6% Green Buildings 1.6 1.4 2.9 1.3% Renewable Energy 7.0 19.5 26.5 11.9% Sustainable Agriculture & Land Use 0.2 0.0 0.2 0.1% Sustainable Transportation 3.7 46.7 50.4 22.7% Water Quality & Conservation 1.3 1.6 2.9 1.3% Environmental: Multiple †† 12.9 47.7 60.6 27.3% Affordable Basic Infrastructure 0.7 0.3 1.0 0.5% Affordable Housing 10.4 10.6 21.0 9.5% Diversity & Equity 0.3 0.3 0.6 0.3% Economic Inclusion 3.9 2.7 6.6 3.0% Education 4.3 0.9 5.3 2.4% Healthcare 4.1 1.9 6.0 2.7% Food Security 0.0 0.0 0.0 0.0% Social: Multiple †† 1.4 4.3 5.7 2.6% Environmental & Social ††† 8.5 17.1 25.6 11.5% Total 62.4 159.7 222.1 100% Region 2020 2021 Total % Asia Pacific $ 5.0 $ 13.2 $ 18.2 8.2% Europe, Middle East and Africa $ 1 5.6 $ 44.0 $ 59.6 26.8% Latin America $ 2.4 $ 7. 1 $ 9.5 4.3% North America $ 39.4 $ 95.4 $ 134.8 60.7% Total $ 62.4 $ 159.7 $ 222 .1 100% Business 2020 2021 Total % Investment Banking $ 50.1 $ 149.6 $ 199.6 89.9% Mergers & Acquisitions $ 5.3 $ 5 7.4 $ 62.7 Debt Capital Markets $ 30.4 $ 77 .6 $ 108.0 Thematic Bonds (Green, Social, Sustainable) $ 25.8 $ 44.5 $ 70.3 Sustainability-Linked Bonds $ 0.0 $ 4.2 $ 4.2 Sustainability-Linked Loans $ 4.6 $ 2 7.9 $ 32.5 Green and Other Loans $ 0.0 $ 1.0 $ 1.0 Equity Capital Markets $ 2.8 $ 3.4 $ 6.2 Municipal Underwriting $ 11.6 $ 11.3 $ 22.8 Corporate Lending *** $ 10.7 $ 9.3 $ 20.0 9.0% Treasury & Trade Solutions $ 1.4 $ 0.6 $ 2.0 0.9% Markets † $ 0.3 $ 0.1 $ 0.4 0.2% Corporate/Other (Citi Investments) $ 0.0 $ 0.1 $ 0.1 0.1% Total $ 62.4 $ 159.7 $ 222 .1 100% * Figures may not sum to totals due to rounding. ** Following the announcement of the $1 trillion sustainable finance commitment in 2021, we performed a retroactive review of 2020 sustainable finance activities using our updated goal criteria, which is reflected in the accounting of environmental and social finance activities on this page. *** “Corporate Lending” includes, but is not limited to, financing for community capital (affordable housing), commercial banking, clean energy finance, project finance, and other lending. † “Markets” currently includes, but is not limited to, commodities transactions that meet renewable energy criteria. † † Denotes activities falling under multiple environmental or social criteria, including green or social bond transactions where the issuer’s framework comprises multiple eligible categories. † † † Refers to transactions that met both environmental and social finance criteria. Credit for such transactions were split evenly between the environmental and social finance goals. Contents ESGatCiti SustainableFinance SustainableProgress Equitable&ResilientCommunities Talent&DEI RiskManagement&ResponsibleBusiness Appendices CITI 2021 ESG REPORT 27
$1 Trillion Sustainable Finance Commitment Impact Data Environmental Impacts 2020 2021 Total 1) Avoided greenhouse gas (GHG) emissions (mt CO 2 e) 2,665,387 1,221,796 3,887,184 From renewable energy projects 2,479,658 995,850 3,475,508 From green affordable housing finance 1,897 789 2,686 From energy efficiency finance 183,832 225,158 408,990 2) Renewable energy capacity added (MW) 1,650 718 2,368 Social Impacts 2020 2021 Total 1) Total people impacted 11,130,783 14,901,937 26,032,720 People impacted through microfinance and home solar systems 307,421 1,407,205 1,714,626 People impacted through renewable energy projects 1,822,972 1,035,387 2,858,359 People impacted from affordable housing projects 52,305 44,556 96,861 People impacted from education projects 247,220 46,651 293,872 People impacted from water improvement projects 2,013,124 12,282,759 14,295,882 People impacted from transit systems 6,687,741 85,379 6,773,120 2) Total jobs supported 360,608 1,397,725 1,758,333 Jobs supported through microfinance and home solar systems 307,421 1,351,650 1,659,071 Jobs supported through renewable energy projects 4,485 4,237 8,721 Jobs supported from affordable housing projects 38,904 30,519 69,423 Jobs supported from education projects 7,701 7,012 14,713 Jobs supported from water improvement projects 1,565 3,465 5,030 Jobs supported from transit systems 534 841 1,375 The reporting on our progress toward our $1 trillion commitment in sustainable finance by 2030 includes measuring the en - vironmental and social impacts associated with contributing sustainable finance projects. Where feasible, we have estimated the impacts representative of Citi’s financing and facilitation activities. Our impact measurement methodologies align with our accounting approach, reporting our share of the impacts proportional to our financial share of the transaction. Impact Calculation Methodology Summary Citi initiatives help to create measurable impacts for communities across the world. To estimate the environmental and social impacts of Citi-financed projects and activities we looked at the following metrics: • Avoided GHG emissions refers to the amount of GHG emissions avoided because of Citi’s share of financing for renewable energy, green affordable housing and energy efficiency projects. GHG emissions avoidance is calculated by applying regional electric grid factors to Citi’s share of financing across three types of activities, including a low-carbon source replacing energy use from the grid, energy efficiency upgrades and green housing units that are LEED-certified. Impacts reflect the per annum benefit as opposed to benefit over entire project life. • For renewable energy projects, total project capacity for energy is calculated as the annual capacity factor applied to the total project size per annum and multiplied by the CO 2 emissions factor. • For energy efficiency upgrades, the average household energy savings is calculated as the average household energy use multiplied by the percentage of energy savings per thousand U.S. dollars invested. The result is multiplied by the total warehouse value and the CO 2 emissions factor. Contents ESGatCiti SustainableFinance SustainableProgress Equitable&ResilientCommunities Talent&DEI RiskManagement&ResponsibleBusiness Appendices CITI 2021 ESG REPORT 28
• For green buildings, the average household energy savings is equal to the average energy use of a non-LEED-certified building multiplied by the percentage of energy savings by a LEED-certified building. The result is multiplied by the number of square feet and the per square feet CO 2 emission factor. • Renewable energy capacity added refers to the size of new renewable energy capacity installed as a result of Citi’s share of renewable energy project financings. • People impacted refers to the direct number of people benefiting from the use of Citi-financed lending activities for small businesses, renewable energy and energy efficiency projects, affordable housing, and underwritten municipal bond proceeds for transit, water and education projects. • For microfinance lending activities, people impacted is equivalent to the number of entrepreneurs and small farm holders receiving business loans as self-reported by Citi teams. • For renewable energy projects and energy efficiency finance, people impacted is equivalent to the number of people whose annual energy usage is supplied by the project. Estimated renewable energy generation annually due to Citi financing is divided by average energy consumption per capita in the country of the project to estimate number of people impacted. • For affordable housing, the number of people impacted is calculated using external reference data on average household size multiplied by the number of housing units constructed. • For municipal bond financing related to education projects, people impacted is estimated as the number of enrolled school children benefiting from new or repaired school buildings or purchases of equipment. External education data on average student enrollment by school, and the number of schools benefiting from funding as stated in issuance documents, was used for this calculation. • Direct jobs supported refers to the number of jobs supported by the uses of Citi-financed lending or underwritten municipal bond proceeds. Jobs supported are related to Citi’s share of new financing for the projects. For microfinance lending, jobs supported are equal to the number of entrepreneurs and smallholder farmers that received loans. For projects involving new construction or maintenance and repair of affordable housing units, renewable energy generation, schools, transit or water systems in the United States, jobs supported are calculated as Citi-financed expenditures divided by output per worker supplied by the IMPLAN economic modeling system. For projects involving renewable energy generation in locations outside the United States, external data is used to estimate the share of project cost involving installation (labor), and this is divided by average compensation of workers in the country to estimate jobs supported. Contents ESGatCiti SustainableFinance SustainableProgress Equitable&ResilientCommunities Talent&DEI RiskManagement&ResponsibleBusiness Appendices CITI 2021 ESG REPORT 29
In This Section 33 Financing the Low-Carbon Transition 37 Climate Risk and Net Zero 50 Sustainable Operations Sustainable Progress Contents ESGatCiti SustainableFinance SustainableProgress Equitable&ResilientCommunities Talent& DEI RiskManagement&ResponsibleBusiness Appendices CITI 2021 ESG REPORT 30
The climate crisis has created not just an opportunity to lead — but an opportunity to partner: working with our clients to decarbonize their businesses as part of our journey to net zero. The science is clear, as is the need to move urgently toward a low-carbon economy. The financial sector has a critical role to play in supporting other industries to reduce their environmental impacts and transition their business models in line with what is needed to keep global warming to 1.5°C. Our Sustainable Progress Strategy builds on our decades-long track record in sustainability and environmental finance. To drive the transition to a low-carbon economy, we are drawing on our expertise, expanding our business unit capabilities and deepening our engagement with the carbon-intensive sectors that are of highest priority for transformation. The s trategy, w hich i s i ntegrated i nto our Environmental a nd S ocial P olicy Framework , f ocuses o n t hree a reas: financing t he l ow-carbon t ransition , deepening c limate r isk a ssessment and d isclosure , a nd reducing t he environmental i mpacts o f o ur o wn operations . T he e nvironmental fi nance transactions t hat c ount t oward o ur $1 tr illion c ommitment t o su stainable finance, w hich a lso i ncludes a c ommitment to s ocial fi nance, i llustrate h ow C iti i s contributing t o t he l ow-carbon t ransition. One y ear a fter s etting o ur S ustainable Progress S trategy, w e t ook a n i mportant next s tep o n t he p ath t oward a l ow-carbon future, p ledging t o a chieve net z ero greenhouse gas (GHG) e missions f or o ur financing ( by 2 050) a nd f or o ur o perations (by 2030). Sustainable Progress Strategy Low-Carbon Transition Accelerate the transition to a low-carbon economy Finance and facilitate low-carbon solutions and support our clients in their decarbonization and transition strategies Climate Risk Measure, manage and reduce the climate risk and impact of our client portfolio Continue our work on policy development, portfolio analysis and stakeholder engagement, as well as enhancing our TCFD implementation and disclosure Sustainable Operations Reduce the environmental footprint of our facilities and strengthen our sustainability culture Minimize the impact of our global operations through operational footprint goals and further integrate sustainable practices across the company Contents ESGatCiti SustainableFinance SustainableProgress Equitable&ResilientCommunities Talent& DEI RiskManagement&ResponsibleBusiness Appendices CITI 2021 ESG REPORT 31
1997 2003 2006 2015 2010 2000 2014 2007 2008 Joined t he UN Environment Programme Finance Initiative (UNEP FI) Joined UN Global Compact 2017 2016 Published first Global Citizenship Report Issued world’s first local investment-grade microfinance bond Co-created Equator Principles and our broader ESRM Policy First U.S. bank to publish Statement on Human Rights First U.S. bank to set CO 2 reduction target Launched 1 0-year $50B Climate Initiative Participated in the first-ever global IPO in microfinance Co-created The Green Bond Principles Commenced 2020 (3 rd ge neration) environmental footprint goals Launched o riginal Sustainable Progress Strategy and $100B Environmental Finance Goal 2020 Issued inaugural € 1B green bond Signed onto the Principles for Responsible Banking Co-developed t he Poseidon Principles Joined the UN Global Investors for Sustainable Development (GISD) Alliance Joined the Sustainable Markets Initiative Financial Services Task Force Announced Net Zero Emissions by 2050 commitment Announced $1T in sustainable finance by 2030 commitment Co-founded the Net Zero Banking Alliance (NZBA) Partnered with the UN Framework Convention on Climate Change (UNFCCC) Issued $1B social finance bond Joined the Rocky Mountain Institute Center for Climate-Aligned Finance Announced 100% renewable electricity by 2020 goal 2018 Published fi rst TCFD Report 2019 Joined Partnership for Carbon Accounting Financials Launched Sustainable Progress Strategy Published 2020 TCFD Report Achieved 100% renewable electricity for all facilities Joined the European Clean Hydrogen Alliance Issued $1.5B green bond Launched Action for Racial Equity $1B commitment Launched $200M Impact Fund Published 2021 TCFD Report, which includes our initial Net Zero by 2050 Plan , and 2030 interim targets for Energy and Power loan portfolios 2021 2022 Citi’s Sustainability Journey Citi has been engaging in sustainability and environmental initiatives for more than 20 years, and we continue to advance our leadership and partnerships across the industry. Structured first securitization of microfinance assets in the world Contents ESGatCiti SustainableFinance SustainableProgress Equitable&ResilientCommunities Talent& DEI RiskManagement&ResponsibleBusiness Appendices CITI 2021 ESG REPORT 32
Financing the Low-Carbon Transition One of the core elements of our Sustainable Progress Strategy is our commitment to finance and facilitate activities that accelerate the transition to a low-carbon economy. We doubled our previous commitment of $250 billion by 2025 and set an ambitious $1 trillion sustainable finance commitment by 2030 — half for environmental finance and half for social finance. But it’s not just about financing and facilitating transactions. Working collabo - ratively with our clients in decarbonizing and helping them in their transitions is a central focus of our net zero plan . We believe systemic collaboration is essential for the global economy to reach net zero emissions. We are already engaging with numerous clients with respect to their climate exposure profile. We intend to deepen our engagement with them to understand their transition plans in greater detail as those plans evolve and help them in their strategies to realize opportunities inherent in transitioning to a low-carbon world. Transforming Our Business to Support a Low-Carbon Economy Climate change has become a C-suite issue for clients in all sectors of the global economy, in terms of growth opportunities and risk management, and ESG consider - ations a re i ncreasingly p art o f o ur b usiness conversations. To support client needs, we have expanded our client engagement offerings across our business to offer strategic sustainability and ESG services and so lutions. Our business groups are focused on helping clients in all sectors, no matter where they are in their own sustainability journeys. We offer customized products and services to support clients in their transition to more sustainable business models and practices that will advance progress toward a low-carbon future. Within Banking, Capital Markets and Advisory (BCMA) , sustainability and ESG is being integrated into our businesses and client engagements. We engage with C-suite executives, boards of directors and treasury teams on strategic financing using a sustainability lens, providing insights about industry transformations, trends and sustainability risks and opportunities. In early 2021, we created the Natural Resources & Clean Energy Transition (NRCET) team to drive client engagement efforts in the Energy, Power and Chemicals sectors. This team unites seasoned corpo - rate and investment bankers with deep knowledge of these sectors under a single umbrella to assist our clients with the net Contents ESGatCiti SustainableFinance SustainableProgress Equitable&ResilientCommunities Talent& DEI RiskManagement&ResponsibleBusiness Appendices CITI 2021 ESG REPORT 33
zero transition. Our Sustainability and Corporate Transitions (SCT) team, founded in 2020, also engages with clients at the C-suite and senior levels across sectors to support the transition of their business models to a sustainable and low-carbon future, helping them identify their ESG challenges and opportunities to shape their strategy. In 2021, Citi served as the exclusive financial advisor to South Korean conglomerate SK Holdings in a transaction noted as the largest investment ever in the hydrogen fuel cell space. The $1.6 billion deal gave SK Group a 9.9% stake in Plug Power Inc., a leading provider of hydrogen fuel cell and green hydrogen generation systems in North America. The two companies entered into a strategic partnership to provide hydrogen fuel cell systems, hydrogen fueling stations and electrolyzers to the Korean and broader Asian markets in order to accelerate hydrogen as an alternative clean energy source throughout Asia. South Korea is one of the most important and developed markets for hydrogen. The government has set a roadmap with ambitious goals to build a hydrogen-based economy by 2040. Also in BCMA, our Sustainable Debt Capital Markets (Sustainable DCM) team has technical expertise on green, social and sustainability bonds as well as sustainability-linked bonds (SLB), and works within debt capital markets and with industry b ankers t o o riginate a nd s tructure issuances for these types of bonds on behalf of clients around the world. The Sustainable DCM team also advises Citi Treasury on Citi’s own sustainable debt issuance programs. The Sustainable DCM team has helped numerous clients globally structure innovative sustainability-linked bonds (SLB) tied to sustainability goals. Such bonds are an example of KPI-linked instruments that commit the issuer or borrower to specific sustainability objectives, such as greenhouse gas (GHG) emissions reduction or other key performance indicators (KPIs). Citi acted as SLB Structuring Advisor and Active Bookrunner on Johnson Controls International (JCI)’s inaugural $500 million SLB in September 2021. As part of this transaction, JCI committed to (i) reduce absolute Scope 1 and 2 GHG emissions by 35% and (ii) reduce absolute Scope 3 GHG emissions from the use of sold products by 5%, all by 2025 from a 2017 baseline, supporting JCI’s long-term net zero emissions by 2040 target. Failure to achieve these targets will result in a 25 basis point coupon step-up. JCI was also the first S&P 500 company to publish an integrated sustainable finance framework encompassing both use-of-proceeds bonds (green, social or sustainability) and sustainability-linked bonds, allowing JCI to issue any/all sustainable financing instruments. In another first, Citi client Tesco became the first UK corporate and the first retailer globally to launch a SLB tied to ambitious GHG emissions reduction targets in January 2021. As the largest retailer in the United Kingdom, Tesco PLC has the ability to make a significant impact on the path to a low-carbon future. Tesco is aiming to become carbon neutral across its own operations by 2035 and Contents ESGatCiti SustainableFinance SustainableProgress Equitable&ResilientCommunities Talent& DEI RiskManagement&ResponsibleBusiness Appendices CITI 2021 ESG REPORT 34
net zero across the value chain by 2050. Citi acted as structuring advisor and active bookrunner on the € 750 m illion SLB. As part of this bond issuance, Tesco agreed to cut its Scope 1 and 2 GHG emis - sions by 60% by 2025, relative to a 2015 baseline. Failure to achieve this target in Tesco’s 2 025 fi nancial y ear w ill r esult i n a 25 basis point step-up in the coupon in 2027, 2 028 a nd 2 029, r einforcing T esco’s climate commitments to both external and internal s takeholders. Also i n 2 021, C iti s erved a s s ole structuring a dvisor a nd l ead l eft bookrunner f or a $ 2.8 b illion g reen b ond offering f or A rdagh M etal P ackaging, a global l eader in s ustainable a luminum packaging so lutions. T he o ffering w as the l argest-ever h igh-yield g reen b ond completed t o d ate. A rdagh h as p ublished a Green F inancing F ramework t hat p rovides details o n t he e ligible u se o f p roceeds. In our Global Markets business, we recently established a dedicated ESG team to support our client engagement through the integration of strategic sustainability and ESG services and solutions. Global Markets provides clients with ESG thought leadership about trends, market evolution, themes, integration and data-driven anal - ysis. We aim to lead our clients through the rapidly evolving landscape of ESG by partnering with clients to develop new solutions across fixed-income, securitized products, multi-asset strategies and sustainable real assets, in addition to our full range of solutions in equities. Using our strengths in primary issuance and secondary trading, we support the development of deep, liquid and efficient sustainable markets. Citi is also able to address origination and financing gaps for clean energy and energy-efficiency project developers and investors by working across banking, advisory, origination and markets teams for optimal client solutions. Our Clean Energy Finance group, for example, has expertise in providing full-service financing solutions for a broad spectrum of renewable energy technolo - gies, serving as a one-stop shop for our clients, as well as financing to help clients implement energy efficiency projects. Citi Global Wealth , through its Investing with Purpose approach, offers managed opportunities, alternative investments and tailored exposure to capital markets to help clients pursue their sustainable investment objectives. As clients have been increasingly concerned with the impact their investments may have on society and the environment, the direction of sustainable investing is evolving past socially responsible investing, and Citi Global Wealth has updated its offerings to meet this growing area of client demand. The Investing with Purpose platform provides opportunities for private clients to invest alongside Citi’s institutional clients. Multiple Citi Global Wealth clients have participated in differentiated capital markets solutions supporting the global green energy transition, an investment thesis reaffirmed by our investment strategy team. As the world goes greener, the opportunities for Citi Global Wealth investors are likely to multiply over the coming years, enabling us to build entire core and opportunistic allocations that reflect sustainable principles — a process we might describe as “greening your portfolio.” Our Treasury and Trade Solutions (TTS) business provides financing and cash management solutions to clients across the globe. We have established a global, cross-func - tional ESG working group to develop holis - tic sustainable working capital, investment and cash management solutions. These include, but are not limited to, Sustainable Supply Chain Finance, Sustainable Trade and W orking C apital L oans a nd S ustainable Deposits, as well as Money Market Funds with ESG principles embedded. Through Contents ESGatCiti SustainableFinance SustainableProgress Equitable&ResilientCommunities Talent& DEI RiskManagement&ResponsibleBusiness Appendices CITI 2021 ESG REPORT 35
Climate and Biodiversity We are continuing to learn about the complex dynamics between climate and biodiversity. These two topics are deeply interconnected, and there is an increasing awareness that climate change, along with other human-caused stresses on natural systems, is contributing to biodiversity loss and ongoing extinction events. * “Natural capital” is a way to conceptualize the various resources and services that are provided by resilient ecosystems. This concept helps to inform the increasing focus on biodiversity, its impact on climate and the importance of disclosure. A recent Citi Global Perspectives & Solutions (GPS) report: Biodiversity: The Ecosystem at the Heart of Business explores why businesses and investors should care about biodiversity loss. The report explains that businesses rely on nature for their products and ecosystem services such as clean air, water, pollination and carbon sequestration. At the same time, their operations create direct and indirect impacts on nature that can, and often do, negatively affect their business. By failing to understand the dependencies and impacts on nature and biodiversity, companies open themselves up to biodiversity risk that could affect the profitability of their businesses. This in turn poses risks to their investors. There is a growing realization that we are losing biodiversity at an alarming rate. This requires urgent action that is complementary to climate action. Global wildlife populations have fallen an average of 68% in just 46 years, ** and human activities threaten 1 million animal and plant species with extinction. *** At the same time, there is a financing gap of $598 billion to $824 billion per year † for broad action on biodiversity, suggesting significant business opportunities. Additionally, nature- positive solutions can create $10 trillion in business opportunities and 395 million new jobs by 2030. †† These solutions could deliver up to 37% of CO 2 emission reductions by 2030. ††† To support our understanding and action on biodiversity, we are also a member of the Taskforce on Nature-related Financial Disclosures (TNFD) Forum, a global and multidisciplinary consultative network of institutional supporters who share the vision and mission of the TNFD. (To learn more, see the Risk Management section). * See Anthony D. Barnosky et al., Has the Earth’s Sixth Mass Extinction ... , 471 NATURE 51, 51 (2011); Gerardo Ceballos et al., Vertebrates on the Brink ... , 117 (24) PNAS 13596 (2020); Belinda Reyers & Elizabeth R. Selig, Global Targets that Reveal .. ., 4 NATURE ECOLOGY & EVOLUTION 1011 (2020). ** WWF, Living Planet Report 2020: Bending the Curve of Biodiversity Loss (2020) , R.E.A. Almond, M. Grooten and T. Petersen (eds.) WWF, Gland, Switzerland. *** IPBES, Global Assessment Report on Biodiversity and Ecosystem Services of the Intergovernmental Science Policy Platform on Biodiversity and Ecosystem Services (May 2019) , E.S. Brondizio et al. (eds.), IPBES, Bonn, Germany, ISBN: 978-3-947851- 20-1. † A. Deutz et al., Financing Nature: Closing the Global Biodiversity Financing Gap (September 2020), The Paulson Institute, The Nature Conservancy and the Cornell Atkinson Center for Sustainability. †† World Economic Forum, New Nature Economy Report II: The Future of Nature and Business (July 2020) . ††† B.W. Griscom et al., “Natural Climate Solutions” (October 2017), Proceedings of the National Academy of Sciences of the United States of America, 114 (44), pages 11645-11650. our Export Agency Finance business, we enhance our clients’ ability to access capital in higher risk markets by delivering financial solutions in partnership with Development Finance Intuitions, Export Credit Agencies and Multilateral Agencies designed to improve risk capacity. Read about the Panama Metro project and the Banco C ompartamos p roject . In November, we launched our first Sustainable Supply Chain Finance (SSCF) program in Asia Pacific with the aim of supporting clients as they advance their ESG priorities, improve the resilience of their supply chains and manage working capital needs. The program was imple - mented for Henkel, the German chemical and consumer goods company, and is targeted at existing or new suppliers that demonstrate strong or improving sustainability performance. Qualifying suppliers can access Citi’s supply chain financing at preferential rates on a tiered basis, with rates improving as a supplier’s sustainability score improves. Henkel, with the support of a global leading sustain - ability assessment agency, will assess the sustainability performance of suppliers. TTS’s Liquidity Management Services support treasuries’ goals with various cash investment products that have incor - porated sustainability principles. Clients can invest their excess cash with Money Market Funds that have incorporated ESG principles. In December, we expanded our innovative Green Minimum Maturity Time Deposit, a sustainable cash investment product that gives clients the ability to invest their short-term liquidity in environ - mentally friendly projects. Investments in Citi’s green deposits or new Green Minimum Time Deposits will be allocated to finance or refinance a portfolio of green projects that meet the rigorous environ - mental finance eligibility criteria defined in our Green Bond Framework. The new product also gives clients greater flexibility to extend the investment period. Contents ESGatCiti SustainableFinance SustainableProgress Equitable&ResilientCommunities Talent& DEI RiskManagement&ResponsibleBusiness Appendices CITI 2021 ESG REPORT 36
Climate Risk and Net Zero When we consider the risks related to climate change, we apply a double materiality perspective, looking at both the impact of climate change on our business and our business’s impact on the climate. Citi’s business is exposed to numerous climate risks given our role as one of the largest fi nanciers o f t he g lobal ec onomy, including c arbon-intensive in dustries. T his means that as we address and mitigate risks, we must take into account how we will protect and strengthen our business while ensuring t hat o ur c lients b ecome p art o f the s olutions t hat a re needed t o t ransition to a l ow-carbon ec onomy. We prioritize regular reporting about our progress and approach in relation to climate risk, as we believe transparently sharing our journey is an important contribution we can make both to the broader industry and to our clients. Citi has disclosed climate-related metrics and targets f or o ur environmental fi nance activities and our operations for well over a decade, and we released our first Climate Change Position Statement in 2007. Since then, o ur c ommitment t o t his i ssue h as only grown, as evidenced by our strategic approach, a lignment w ith g lobal st an - dards and the continued evolution of our Environmental a nd So cial R isk M anagement (ESRM) Policy in response to the changing risk l andscape. First established in 2003, our ESRM Policy applies t o a ll C iti e ntities g lobally a nd provides a framework for how we identify, mitigate and manage the potential risk to Citi associated with the environmental and social risks of our clients’ activities. It guides o ur fi nancing dec isions f or c ompa - nies a nd p rojects w ithin e nvironmentally sensitive a nd/or h igh-carbon se ctors. It a lso provides us with opportunities to advise our clients on climate-related risks. To learn more about our ESRM Policy and related due d iligence, s ee t he Environmental a nd Social R isk M anagement s ection . In addition to establishing internal poli - cies and practices, we also align with external s tandards t o s trengthen o ur processes, r eporting a nd e ngagement. We h ave s upported t he r ecommendations of t he Task Force on Climate-related Financial D isclosures (TCFD) since they were released in 2017. Our objective is to understand the potential financial risks from climate change to Citi, our clients and communities; how Citi and our clients may b e c ontributing t o c limate c hange; a nd how we can help our clients transition to a low-carbon ec onomy. Find out more about our implementation of t he T CFD r ecommendations i n o ur 2021 TCFD R eport . In addition, this ESG Report includes a TCFD in dex indicating where climate-related content in response to TCFD recommendations can b e f ound t hroughout this report and other public documentation. Our TCFD Report: Citi’s Approach to Climate Change and Net Zero To find more detailed climate-related disclosures, see our 2021 Task Force on Climate-related Financial Disclosures Report: Citi’s Approach to Climate Change and Net Zero . The report discloses our work to implement the TCFD recommendations across the four pillars of Governance, Strategy, Risk Management, and Metrics and Targets and includes our initial net zero plan for our Energy and Power loan portfolios. PARTICIPATION IN NET ZERO FRAMEWORKS Citi is a member of multiple industry groups that enhance our understand ing of — and ability to act on — climate-related issues. These groups include the Partnership for Carbon Accounting Financials (PCAF), the Net-Zero Banking Alliance (NZBA) and the Glasgow Financial Alliance for Net Zero (GFANZ). Learn more about these in our 2021 TCFD Report . Contents ESGatCiti SustainableFinance SustainableProgress Equitable&ResilientCommunities Talent& DEI RiskManagement&ResponsibleBusiness Appendices CITI 2021 ESG REPORT 37
Our Net Zero Commitment In 2 021, w e an nounced ou r c ommitment to n et z ero g reenhouse g as ( GHG) emissions b y 2 050, i n a lignment w ith the o bjectives o f t he P aris A greement and p revailing c limate sc ience. R educing Scope 3 fi nanced e missions 1 is widely recognized a s t he m ost s ignificant contribution t he fi nancial i ndustry c an have t o a chieving a l ow-carbon e conomy. Our c ommitment w ill in clude in terim financed e missions r eduction t argets f or carbon-intensive se ctors, as d escribed b y the U N E nvironment P rogramme F inance Initiative ( UNEP F I) G uidelines f or C limate Target S etting f or B anks. T o d ate, w e h ave set 2030 e missions t argets for our Energy and P ower l oan p ortfolios. For our own operations, we are targeting net zero GHG emissions by 2030, which builds on our environmental footprint goals and the 100% renewable electricity goal that we achieved in 2020. (Learn more in the Sustainable Operations section .) The approach and activities related to our net zero commitment are distinct from our management of climate risk for our firm. While our net zero commitment is keenly focused on Citi’s impacts on the climate and reducing GHG emissions to net zero across our value chain, our climate risk management efforts are focused on Citi’s safety and soundness, and thus on the integration of climate risk into our risk management governance, processes and strategies. Although these two priorities differ in their primary focus, they are related to and reinforce each other, leading to mutual benefits. As we execute on our net zero commitment, the resulting reduction in financed emissions will help to reduce our climate transition risk. Citi’s net zero ambition builds on our commitment to the UNEP FI Principles for Responsible B anking , our leadership in climate disclosure in alignment with the TCFD and our ESRM Policy — specifically our Sector Approaches related to fossil fuels. Transparency and accountability are keys to success, and we will report annu - ally on our net zero progress. Our commitment to net zero is significant, given the size and breadth of our portfolios and businesses. To achieve it, we must meet our clients where they are in their sustainability journeys and help accelerate their progress in this area. We will work with all our clients, including our fossil fuel clients, to develop credible plans that include the responsible retirement of carbon-intensive assets as we transition to net zero together. We will prioritize partnering with clients on transition strategies, and exiting client relationships is a last resort. Banks a re f acing g rowing p ressure t o divest f rom f ossil fu els. I n s ome i nstances, such a s thermal c oal m ining , w here t here is c redit r isk f rom s tranded a ssets i n addition t o c limate r isk, w e h ave a lready established a t ransparent t ime f rame f or our t ransition e xpectations. H owever, we a re c ognizant t hat l arge-scale, r apid divestment c ould r esult i n a n a brupt a nd disorderly t ransition t o a l ow-carbon economy, c reating b oth ec onomic a nd social u pheaval o n a g lobal s cale. F or example, c ertain c arbon-intensive c ompa - nies m ay p lay c ritical r oles i n c hanneling the n ecessary cap ital e xpenditures an d providing t he r aw m aterials t o su pport new c limate t echnologies o r m ay p rovide necessary ba seload p ower f or de veloping countries. An orderly, responsible and equitable transition, which accounts for the imme - diate economic needs of communities and workers as well as environmental justice and broader economic development concerns, is essential to retaining polit - ical and social support for the shift to a low-carbon economy. Under the goals of our net zero plan, we seek to balance these needs to facilitate this complex transition. Initial Net Zero Plan We released our initial net zero plans for our Energy and Power loan portfolios in our 2021 TCFD Report . The plans for these portfolios build upon the calculation of our financed emissions and the setting of interim 2030 emissions reduction targets for these sectors. Our net zero plan incorporates a twofold approach: assess - ment of our clients’ climate profiles and engagement to understand their transition opportunities. Additionally, we will employ a number of tools, phased in over time, to help move these portfolios toward our 2030 targets. Underlying the implementa - tion of this plan is Citi’s continued effort to expand our climate-related resources and engage directly with our clients. 1. Financed emissions are the GHG emissions generated by the operations and entities that financial institutions lend money to or invest in. Contents ESGatCiti SustainableFinance SustainableProgress Equitable&ResilientCommunities Talent& DEI RiskManagement&ResponsibleBusiness Appendices CITI 2021 ESG REPORT 38
Considerations for Loan Portfolio Assessments Energy and Power Sectors GHG Emissions Public Disclosure Review public disclosures such as sustainability reports or submissions to the CDP Climate Change Questionnaire and supplement with direct engagement with clients GHG Emissions Reduction Targets Review public statements on net zero/decarbonization commitments or alignment with external initiatives such as the Science Based Targets initiative. For the Energy sector, assess targets for GHGs such as methane Decarbonization/Transition Plan Understand clients’ climate transition plans. Determine the tools that clients will employ, including capital allocation, product diversification and linkages to executive compensation Climate Risk Scoring Harness public discourse and statements and third-party data as well as our ongoing client engagement, to develop an internal assessment for both transition and physical risk Client Asset Evaluation Where available, review asset-level data for further assessments of climate risk and emissions intensity; this is particularly applicable to project finance External Climate Scores Reference third-party ratings systems for additional data on climate-related performance Other Data Consider the social elements of transition, including human rights risks, access to energy for developing countries, livelihoods of communities and workers in these sectors and the relevant regulatory environment Scopes 1 & 2 (absolute emissions & physical intensity) Scope 3 Baseline year Status of data verification Net zero commitment or science-based targets GHG emissions reduction targets Methane reduction targets Flaring reduction/phase-out targets Scope 1 decarbonization plan Scope 2 decarbonization plan Evolution of energy sources Product diversification and Scope 3 reduction Capital allocation Governance — accountability, compensation links Transition risk assessment Physical risk assessment Existing generation assets (carbon intensity analysis) Existing reserves and assets Comparative economics of production Carbon-intensive asset retirement schedule Resilience risks PACTA Score CA 100+ Score World Benchmarking Alliance Carbon Tracker Initiative Transition Pathways Initiative Sustainable development factors Country/regional regulatory environment The first step of our net zero plan involves engagement, client by client, to understand each client’s GHG emissions disclosure and their perspective and plans for transition. Additionally, we will review public disclosures, climate governance and the commit - ments and actions they have taken to date. We anticipate that this initial review phase will continue through the end of 2023. In the following table, we highlight some of the key considerations that will frame client engagement. APPLICABLE TO BOTH SECTORS POWER SECTOR ONLY ENERGY SECTOR ONLY Contents ESGatCiti SustainableFinance SustainableProgress Equitable&ResilientCommunities Talent& DEI RiskManagement&ResponsibleBusiness Appendices CITI 2021 ESG REPORT 39
While our transition plans for each loan portfolio will be based on a rigorous net zero methodology, we are still in the early stages of plotting our net zero journey. We expect to modify our transition plans and targets as both the availability and quality of data improve and as climate scenarios are updated. We also recognize that there will be uneven year-on-year progress toward our 2030 targets, because clients and sectors differ in their capacity to transition and in the time frames in which their carbon reduction investments will be realized. Achieving Our Targets We will use a variety of approaches, many of which will run concurrently, to reach our financed emissions reduction targets for our Energy and Power loan portfolios. For further detail on these five areas of activity, refer to our 2021 TCFD Report . Client Transition Assessment, Advisory and Finance • Client engagement and assessment • Transition advisory and finance, including debt and equity underwriting and lending • Support existing and new clean technologies to accelerate commercialization • Support enabling public policy and regulation in the United States and other countries, including through trade associations and other industry groups • Dimension climate risk exposure across our lending portfolios and review client carbon reduction progress • Ongoing review and refinement of ESRM Policy • Active portfolio management to align with net zero targets, including considerations of transition measures taken by clients Clean Tech Finance Public Policy Engagement Risk Management Portfolio Management Contents ESGatCiti SustainableFinance SustainableProgress Equitable&ResilientCommunities Talent& DEI RiskManagement&ResponsibleBusiness Appendices CITI 2021 ESG REPORT 40
The PCAF methodology is primarily focused on reporting financed emissions on an annual basis and relies on data of funds outstand - ing, not the total funds that a financial institution may have committed to the client in the reporting year. While we intend to continue disclosing per the PCAF requirements to provide this annual view of financed emissions associated with our activities, we are using “committed funds” data to more holistically attribute our clients’ emissions for the baseline financed emissions figures in our net zero plan. Consequently, we undertook an additional analysis of our Energy and Power loan portfolios using total committed funds to calcu - late baseline emissions from 2020 and establish 2030 emission targets. The use of committed funds in this context provides a more accurate reflection of the maximum emissions-generating activity that Citi has agreed to finance and is therefore better suited for the purposes of forward-looking emissions management and target setting. This approach results in discrepancies between the metrics we report for PCAF and for our net zero targets, but we believe the committed funds approach is better aligned with the way we expect to manage our net zero targets. * mt CO 2 e = metric tons of carbon dioxide equivalent. ** Omission of Scope 3 emissions for Power is explained in the “Scope 3 Calculation Methodology” in Appendix A (page 71) of our 2021 TCFD Report . *** Scope 3, Category 11: Use of Sold Product, for extractive and refining sectors. * Omission of Scope 3 emissions for Power is explained in the “Scope 3 Calculation Methodology” in Appendix A (page 71) of our 2021 TCFD Report . FPO TABLE Scope Power Energy Scope 1 4,261,747 17,308,063 Scope 2 164,059 518,594 Scope 3 N/A ** 40,113,950 *** Total 4,425,806 57,940,607 Scope Power Energy Scope 1 11,464,654 33,847,434 Scope 2 485,784 1,434,241 Scope 3 N/A * 108,478,743 Total 11,950,438 143,760,418 2020 ABSOLUTE FINANCED EMISSIONS: OUTSTANDING EXPOSURE (MT CO 2 E * ) 2020 ABSOLUTE FINANCED EMISSIONS: COMMITTED EXPOSURE (MT CO 2 E) To reach net zero, we must move from our baseline across a decarbonization pathway to our ultimate net zero target. Establishing 2030 targets are the first step in that journey. The next step is to develop an implementation plan to achieve targeted reductions in each relevant sector. We are evaluating a number of strategies and tools to drive towards the established goals, though they may not all be applicable for every sector or client. Some of the emissions reduction approaches and potential future tools include client engagement, capital allocation strategy and portfolio management tools. The table on the following page summarizes our current 2030 emission targets for Citi’s Energy and Power portfolios. These interim 2030 targets are a key component of our net zero plan for emissions in our client portfolio. Energy and Power Baseline Emissions and Interim Targets During 2021, we used the PCAF methodology to conduct an analysis of our Energy and Power portfolios using 2020 data. In alignment with PCAF requirements, this analysis is based on funds outstanding (drawn and not yet repaid) by clients during the year to provide a view of financed emissions associated with our activities during that year. Contents ESGatCiti SustainableFinance SustainableProgress Equitable&ResilientCommunities Talent& DEI RiskManagement&ResponsibleBusiness Appendices CITI 2021 ESG REPORT 41
* International Energy Agency scenarios. ** Only includes power generation clients. Clients primarily in the transmission and distribution value chain were excluded. *** The emissions intensity from the IEA SDS OECD scenario is derived by dividing the CO 2 e emissions resulting from the Power sector with the electricity generation at 2030. Note: These targets are based on available data as of September 2021. Updates to improve data quality of the baseline numbers may result in changes to these targets. Sector Scenario 2020 Baseline 2030 Targets Energy (Scope 1, 2, 3) Net Zero Emissions by 2050 (NZE 2050) * 143.8 million mt CO 2 e 29% reduction from 2020 baseline 102.1 million mt CO 2 e Power ** (Scope 1) Sustainable Development Scenario (SDS 2020) * 313.5 kg CO 2 e/MWh 63% reduction in Scope 1 intensity per MWh 115 kg CO 2 e/MWh *** More i nformation a bout t he a nalysis w e conducted t o e stablish t hese t argets, i nclud - ing scenario selection and the scope and boundaries of the targets, is available in our 2021 TCFD Report . I n fu ture y ears, w e w ill conduct fu rther a nalysis t o f acilitate t arget setting for additional sectors. In 2022, we plan to focus on the Auto Manufacturing, Steel, T hermal C oal M ining a nd C ommercial Real E state s ectors f or c ore a nalysis a nd target setting, in alignment with the NZBA guidelines. W e w ill c onsider t he r emaining sectors, in cluding A luminum, A viation, Cement a nd A gricultural su bsectors i n 2 023 and 2024. Citi’s Approach to Managing Climate Risk Citi’s R isk M anagement fu nction i s respon sible f or i dentifying, m easuring, managing, c ontrolling a nd r eporting r isks to t he c ompany. W e i dentify c limate r isk as a n “ emerging r isk” i n C iti’s E nterprise Risk M anagement F ramework. W ithin t he framework, e merging r isks a re t hose t hat are n ew o r r apidly c hanging, w ith h igh growth p otential, a nd a re c haracterized b y data u navailability o r o ther u ncertainties. We d o n ot v iew c limate r isk a s a s tand-alone risk c ategory b ut a s a t ransversal r isk, capable o f m anifesting a cross e ach o f C iti’s seven r isk c ategories i n o ur r isk t axonomy: Credit, M arket, L iquidity, S trategic, Operational, C ompliance a nd R eputation. Climate i mpacts m ay b e e ither p hysical- o r transition-related a nd m ay v ary d epending on t he t ime h orizon. During 2021, we strengthened our gover - nance and deepened our expertise to advance effective management of climate risks and opportunities. Highlights include the f ollowing: • Formation of a new Global ESG Council, consisting o f s enior m embers o f m anage - ment, with the aim of providing enhanced oversight o f o ur E SG a ctivities a nd g oals • Creation o f t he N atural R esources & Clean E nergy T ransition t eam t o i nte - grate o ur E nergy, P ower a nd C hemicals businesses, i n o rder t o a ssist o ur c lients across t hese s ectors a s t hey t ransition • Growth of our dedicated Climate Risk team, w ith a n e mphasis o n e xpertise in c redit r isk, s cenario a nalysis, s tress testing a nd r egulatory e ngagement • Establishment of a Net Zero Task Force to support t he d evelopment a nd l aunch o f our net zero plan Regulatory Compliance Interest in climate risk management from regulators continues to grow globally. We are monitoring and responding to emerging regulatory obligations and engaging with regulators around the world about climate risk issues, especially related to risk management, strategy and scenario analysis r equirements. As w e a nticipate a n in crease in r egulatory requirements, v oluntary f rameworks a nd mandated p roduct c lassifications, w e a re strengthening o ur i nternal r egulatory t eams with su bject m atter e xperts. W e a re a lso improving o ur a ccess t o r elevant, a ccurate data to sharpen our scenario analyses and building a s tandardized, gl obal c limate disclosure s trategy t hat c an m onitor a nd manage r equirements a nd p rovide c onsis - tent r eporting a cross o ur o perations. Contents ESGatCiti SustainableFinance SustainableProgress Equitable&ResilientCommunities Talent& DEI RiskManagement&ResponsibleBusiness Appendices CITI 2021 ESG REPORT 42
Global ESG Council Climate Risk Steering Group Climate Risk Working Group Net Zero Task Force Global Sustainability Steering Committee Climate Change Governance Board of Directors Steering Groups EXECUTIVE MANAGEMENT TEAM Management and Specialized Functions Nomination, Governance and Public Affairs Committee Risk Management Committee CEO Sustainability & ESG Team Chief Sustainability Officer Head of Climate Risk Head of Environmental & Social Risk Management (ESRM) Banking, Capital Markets and Advisory (BCMA) Global Markets Climate Risk Team ESRM Team Sustainability & Corporate Transitions Team Natural Resources & Clean Energy Transition Team Sustainable Debt Capital Markets Team Markets ESG Team GLOBAL PUBLIC AFFAIRS INSTITUTIONAL CLIENTS GROUP INDEPENDENT RISK MANAGEMENT Global Head of Public Affairs Chief Risk Officer CEO of Institutional Clients Group The following climate change governance diagram illustrates our governance structure as of April 2022. For more about Citi’s governance related to climate risk, see our 2021 TCFD Report . Contents ESGatCiti SustainableFinance SustainableProgress Equitable&ResilientCommunities Talent& DEI RiskManagement&ResponsibleBusiness Appendices CITI 2021 ESG REPORT 43
EMPLOYEE TRAINING IN CLIMATE RISK We are working to create a culture of sustainability across our company and raise our colleagues’ literacy related to climate risk. In 2021, we created a new training module that covers key climate risk concepts, including the definition of climate risk, emerging climate risk standards, supervisory expectations, an overview of Citi’s efforts in this area and our initiatives to enhance climate risk management. Our previous climate risk trainings were customized for specific groups of employees to raise awareness about particular climate-related topics. This new module is our first training for climate that allows us to provide consistent instruction for a broader audience and further support the integration of climate risk considerations into our risk management processes. Climate Risk in Our Maritime Shipping Portfolio The Poseidon Principles , released in 2019, provide a framework for lenders, lessors and financial guarantors to integrate climate considerations into lending decisions with international shipping clients, to help the sector decarbonize in line with the goals of the International Maritime Organization (IMO). Citi was a founding signatory and also chairs the Steering Committee of the Poseidon Principles Association, the governing body of the Poseidon Principles. As a part of our commitment, we provide yearly disclosures, which are published alongside those of other signatories in an annual report published on the Poseidon Principles website. Our most recent disclosure reflects updated data from the IMO’s Fourth GHG Study, published in 2020, as well as an improved methodology for estimating carbon emissions and carbon intensity for a variety of vessel types and sizes, resulting in a more accurate representation of vessel emissions and the emissions reduction targets needed for the world’s shipping fleet. Our reported alignment score this year (+11.7%) is notably further out of alignment compared with our reported score of last year (+6%). This change in alignment is due to a combination of factors, including the improved accuracy of the new methodology, as well as significant disruptions in shipping related to the COVID-19 pandemic. The disruptions were most notable in the Cruise segment, which saw dramatic decreases in efficiency (and therefore our alignment scores) driven by reduced cruising activity globally. This was however offset by the improvements in the accuracy of the methodology, resulting in an alignment score of +1.1% for the Cargo segment of Citi’s Shipping portfolio only (excluding the Cruise segment). Further changes to the methodology may occur as data and industry practices evolve, and new IMO regulations come into effect. To further advance progress in the maritime shipping industry, we are a member of the Getting to Zero Coalition, which is focused on the development of commercially viable, zero-emission vessels and other needed maritime infrastructure for scalable net zero-carbon energy sources, including production, distribution, storage and bunkering. The coalition was founded by the Global Maritime Forum, Friends of Ocean Action and the World Economic Forum. It has more than 190 member companies and nine knowledge partners and is supported by key intergovernmental organizations and governments. Contents ESGatCiti SustainableFinance SustainableProgress Equitable&ResilientCommunities Talent& DEI RiskManagement&ResponsibleBusiness Appendices CITI 2021 ESG REPORT 44
Reducing Climate Risk in Our Financing Climate risk is one of the three pillars of our Sustainable Progress Strategy . When it comes to analyzing and reducing climate risk associated with our clients, we have identified the following three primary focus areas: • Policy development • Portfolio analysis and measurement • Engagement Policy Development As part of our work to integrate climate risk into Citi’s risk policies and governance frameworks, we have updated our ESRM Policy Sector Approaches for carbon- intensive sectors to incorporate emerging best practices. One area where we have made significant progress is in our fossil fuel Sector Approaches for thermal coal mining and the generation of coal-fired power, which predated our net zero commitment. See the box on the right for more details on our targets and policy. Portfolio Analysis and Measurement Citi aims to understand the transition and physical risks that Citi and our clients are exposed to by conducting climate scenario analysis, measuring the GHG emissions associated with our financing portfolio and evaluating portfolio decarbonization pathways. During 2021, we conducted an analysis of our Energy and Power loan portfolios to establish baseline emissions and establish interim 2030 emissions targets as we work toward our net zero commitment. Learn more about this analysis and our targets in the Energy and Power Baseline Emissions and Interim Targets s ection . Our Commitment to Reduce Financing for Coal Thermal Coal Mining Our ESRM Policy commitments related to coal mining began in 2009, with our first coal mining Sector Approach. Since that time, we have updated our policy, including updates focused on enhanced due diligence and continued reductions in our credit exposure to the coal mining industry. As of 2020, Citi has established a policy prohibition on project- related financing of new thermal coal mines and significant expansions. We have also committed to the following targets to reduce our exposure to companies that derive 25% or more of their revenue from thermal coal mining: • By the end of 2025: Reduce our credit exposure to these companies by 50% from a 2020 baseline • After 2025: No longer facilitate capital markets transactions or mergers and acquisition advisory and financing for these companies • By the end of 2030: Reduce all remaining exposure to these companies to zero Coal-Fired Power Generation Our ESRM Policy commitments related to coal-fired power generation have also been updated over time as the credit and reputation risk related to coal has increased. We have committed to not finance any new coal-fired power plants or expansions of existing plants. Our expectations have increased as we aim to help our clients transition to a future aligned with the Paris Agreement. A comprehensive summary of time-bound milestones for coal-fired power clients through 2040 is available in our Environmental and Social Policy Framework . In 2021, we reviewed our coal-fired power clients’ GHG reporting and low-carbon transition plans, including commitments to retire existing coal plants. Our analysis considered a combination of client disclosures, third-party ESG analysis, CDP disclosures and direct client engagement. Moving forward, this evaluation will be wrapped into our net zero engagement and progress towards our 2030 targets. * This figure has been updated as one metallurgical coal company was erroneously included in the baseline reported in our 2020 ESG report. 2020 baseline * $1.091B Credit exposure as of Dec. 31, 2021 $759M (30% reduction from baseline) Risk Exposure During 2021, we updated our climate risk heat-mapping framework to refine our understanding of the sectors we finance that are most sensitive to climate risk. The heat map on the following pages is based on a qualitative assessment of how transition and physical climate risk drivers are expected to impact different sectors. The results of this assessment will help us to prioritize portfolios when further evaluating risks. Contents ESGatCiti SustainableFinance SustainableProgress Equitable&ResilientCommunities Talent& DEI RiskManagement&ResponsibleBusiness Appendices CITI 2021 ESG REPORT 45
Climate Risk Heat-Mapping Framework: Vulnerability Rubric 1 2 3 4 Transition Risks Regulatory No regulatory/policy changes are expected to meaningfully impact the sector financially such as through asset devaluation, increased expenditure (e.g., compliance costs) and/or loss of revenue Minor impact to the sector expected from potential regulatory/policy changes (e.g., building efficiency) resulting in financial impact asset devaluation, increased expenditure (e.g., compliance costs) or loss of revenue; impact only on a subset of the sector, subset of geographies and/or only indirect impact Moderate impact to the sector expected from regulatory/policy changes (e.g., carbon taxes) relating to the sector’s carbon intensity; direct impact with noticeable economic implications on the sector through impacted asset valuation, increased expenditure (e.g., compliance costs) and/or revenue loss Major impact to the sector expected due to expected regulatory/ policy changes relating to the sector’s carbon intensity; significant shift expected in the business model or economics of the sector impacting asset valuation, expenditures (e.g., increased compliance costs) and/or revenue Technology Outside of general modernization of tech - nology, no technology shifts are expected for the sector Minor impact to the sector expected from technology changes (i.e., impact only on a small subset of the sector, or only indirect impact through supply chain) that result in market share loss Moderate impact to the sector expected from technology changes, resulting in some shift in the economics of some companies in the sector leading to market share loss Major impact to the sector expected from technology changes, resulting in substitution of a significant portion of existing companies (i.e., market share loss) Stakeholder There is no expectation of stakeholder composition or preferences changing for the industry Minor stakeholder impact due to expected shift in preferences, with minor financial impact on companies (e.g., revenue, vendor pricing) Moderate stakeholder impact is expected for the sector in terms of stakeholder preferences and composition, with modest financial impact (e.g., revenue, vendor pricing) Major stakeholder impact is expected in terms of both client preferenc - es and composition of stakeholders, resulting in significant financial impact (e.g., revenue loss, vendor pricing) Legal No increased litigation concerns are expected to impact the industry that would lead to increased financial burden (e.g., legal fees, settlements) Minor litigation concerns are expected to impact the sector, with minor financial consequences (e.g., legal fees, settlements) Moderate litigation concerns are expected to impact the sector, with modest financial impact (e.g., legal fees, settlements) Major litigation is expected to impact the sector, with significant financial impact (e.g., legal fees, settlements) Physical Risks Acute Hazard Acute physical hazards have no impact on the day- to-day operations of companies in the sector Sector would experience minor impact from acute physical hazards on operations (e.g., revenue loss due to business disruption), or minor damage to assets (e.g., asset devaluation) Sector would experience moderate and protracted impact from acute physical hazards on operations (e.g., revenue loss due to business disruption), or moderate damage to assets (e.g., asset devaluation) Sector would experience major and protracted im - pact from acute physical hazards on operations (e.g., revenue loss due to business disruption), or significant damage to assets (e.g., asset devaluation) Chronic Hazard Chronic physical hazards have no impact on the operations or valuation of assets/ companies in the sector Chronic physical hazards have minor potential impact on the operations (e.g., increased insurance cost) or valuation of assets/companies in the sector Sector would experience moderate and sustained impact on the operations (e.g., increased insur - ance cost) or valuation of assets/companies in the sector Sector would experience major and irreversible impact on the operations or valuation of assets/ companies in the sector LOW VULNERABILITY SCORE HIGH Our climate risk heat map (included on the following pages) categorizes sectors under one of four vulnerability scores, ranging from low to high. We have established subscores using the rubric in the following table for various aspects of transition and physical risks. Contents ESGatCiti SustainableFinance SustainableProgress Equitable&ResilientCommunities Talent& DEI RiskManagement&ResponsibleBusiness Appendices CITI 2021 ESG REPORT 46
A comprehensive table of our credit exposures is provided below, including a breakdown of identified sectors into subsectors and, for each, the level of risk relating to physical and transition climate risk. By looking at the subsector level, we can further distinguish between the levels of risk within an individual sector. It is important to note that these risks are not expected to manifest in every sector immediately. For this reason, the table on this page and the next should not be interpreted as imminent risks to existing exposures, but rather, exposures we are proactively identifying to focus on, where we will work methodically in the coming years to better understand, analyze and manage our climate risk exposures in these sectors. 2020 Climate Risk * $ in Millions Total $ Exposure % of Total Exposure Funded % of Funded Exposure Transition Risk Physical Risk Energy & Commodities ** 49,524 6.3% 15,086 4.4% Integrated Oil & Gas 13,332 1.7% 2,844 0.8% 4 2 Oil & Gas Exploration & Production 13,316 1.7% 4,380 1.3% 4 2 Oil & Gas Storage & Transportation 7,169 0.9% 1,808 0.5% 4 2 Oil & Gas Refining & Marketing 6,976 0.9% 2,632 0.8% 4 2 Oil & Gas Equipment, Services & Drilling 4,914 0.6% 1,082 0.3% 4 2 Other 3,816 0.5% 2,340 0.7% 4 2 Power 26,916 3.4% 6,379 1.9% Alternative Energy 2,011 0.3% 1,015 0.3% 1 2 Electric Utilities 6,430 0.8% 2,373 0.7% 3 3 Gas Utilities 1,497 0.2% 571 0.2% 3 2 Independent Power Producers & Service Operators 2,449 0.3% 591 0.2% 3 3 Multi-Utilities 12,117 1.5% 1,343 0.4% 3 3 Water Utilities 986 0.1% 134 0.0% 2 3 Other 1,426 0.2% 353 0.1% 3 3 Transportation 81,567 10.4% 39,417 11.4% Autos 53,874 6.9% 25,310 7.3% 4 1 Automobile Manufacturers 16,939 2.2% 6,690 1.9% 4 1 Auto Parts & Equipment 10,476 1.3% 4,298 1.2% 4 1 Auto-Related Financing, Leasing & Rentals 23,836 3.0% 12,811 3.7% 3 1 Other 2,623 0.3% 1,511 0.4% 4 1 Aviation 10,257 1.3% 5,033 1.5% 3 3 Shipping & Maritime Logistics 9,979 1.3% 6,785 2.0% 3 2 Logistics 7,457 1.0% 2,289 0.7% 3 3 Air Freight & Logistics 1,139 0.1% 329 0.1% 3 3 Rail 1,395 0.2% 273 0.1% 1 2 Trucking 716 0.1% 427 0.1% 3 1 Other *** 4,208 0.5% 1,260 0.4% 3 3 Industrials 65,651 8.4% 20,705 6.0% Building Products & Related 8,162 1.0% 2,453 0.7% 3 1 Capital Goods 42,564 5.4% 12,615 3.7% 3 3 Paper Forest Products & Packaging 7,113 0.9% 3,416 1.0% 3 1 Professional Services 7,812 1.0% 2,220 0.6% 2 1 Climate Risk Heat Map and Credit Exposure LOW HIGH 1 2 3 4 * Over medium to long term. ** In addition to this exposure, Citi has energy-related exposure within other sectors (for example, mainly energy-related state-owned entities within the public sector). Citi total exposure to these energy-related sectors is approximately $5.8 billion, of which approximately $3.3 billion consisted of direct outstanding funded loans, as of December 31, 2020. *** Includes Infrastructure, Logistics Not Assigned and Logistics Suppliers. Contents ESGatCiti SustainableFinance SustainableProgress Equitable&ResilientCommunities Talent& DEI RiskManagement&ResponsibleBusiness Appendices CITI 2021 ESG REPORT 47
2020 Climate Risk * $ in Millions Total $ Exposure % of Total Exposure Funded % of Funded Exposure Transition Risk Physical Risk Metals & Mining 14,654 1.9% 6,462 1.9% Coal † 592 0.1% 144 0.0% 4 4 Steel 3,526 0.4% 2,017 0.6% 3 2 Aluminum 961 0.1% 710 0.2% 3 2 Stainless Steel 153 0.0% 116 0.0% 3 2 Nonferrous & Ferrous Minerals 2,492 0.3% 1,049 0.3% 3 2 Other †† 6,931 0.8% 2,427 0.7% 3 2 Chemicals 22,356 2.8% 7,969 2.3% 3 2 Consumer Retail & Health 117,633 15.0% 43,467 12.6% Agricultural Products 6,723 0.9% 4,215 1.2% 3 3 Beverages 8,889 1.1% 3,566 1.0% 1 3 Food Products 14,373 1.8% 6,752 2.0% 3 2 Tobacco 3,176 0.4% 717 0.2% 1 3 Healthcare Equipment & Services 35,504 4.5% 8,658 2.5% 1 1 Household & Personal Products 9,167 1.2% 3,617 1.1% 2 2 Retail 20,577 2.6% 7,662 2.2% 2 1 Hotels, Restaurants & Leisure 4,951 0.6% 1,997 0.6% 1 2 Other 14,273 1.8% 6,283 1.8% 3 3 Real Estate 65,392 8.3% 43,285 12.6% Commercial Real Estate 46,232 5.9% 30,070 8.7% 2 3 Residential Real Estate 19,160 2.4% 13,216 3.8% 2 3 Financial Institutions ††† 86,257 11.0% 35,006 10.2% 3 2 Insurance 26,576 3.4% 1,925 0.6% Life Insurance 4,923 0.6% 659 0.2% 1 1 Property & Casualty Insurance 13,688 1.7% 1,110 0.3% 2 3 Reinsurance 6,324 0.8% 66 0.0% 2 3 Other 1,640 0.2% 91 0.0% 2 3 Private Bank 109,397 13.9% 75,693 22.0% 2 2 Public Sector ‡ 26,887 3.4% 13,599 3.9% 3 3 Tech, Media & Telecom 82,657 10.5% 30,880 9.0% Media & Entertainment 13,119 1.7% 4,279 1.2% 1 1 Hardware 23,547 3.0% 10,836 3.1% 2 2 Software & Services 22,264 2.8% 5,647 1.6% 1 1 Telecom 21,341 2.7% 8,616 2.5% 1 2 Other 2,386 0.3% 1,503 0.4% 2 2 Other Industries 9,307 1.2% 4,545 1.3% 1 1 Total ‡‡ 784,774 100.0% 344,417 100.0% * Over medium to long term. † Based on Citi’s Risk Industry Classification, which only captures companies that fully identify as coal companies and excludes diversified mining companies with coal mining. This differs from how Citi defines thermal coal mining companies under its ESRM Policy (those that derive >25% of revenue from thermal coal mining), which broadens the scope of companies covered under the ESRM Policy. †† Includes Coke, Diversified Metals & Mining, Industrial Minerals, Energy Minerals, Gold, Metals & Mining Not Assigned, Metals & Mining Related, and Uranium. ††† Includes Asset Managers and Funds, Banks, Finance Companies, Financial Markets Infrastructure and Securities Firms. ‡ Certain countries may see high transition and physical risks based on commodities exposure and geographic location. ‡‡ Sums may not match FY2020 10-K due to rounding from increased granularity in industry breakdowns. Contents ESGatCiti SustainableFinance SustainableProgress Equitable&ResilientCommunities Talent& DEI RiskManagement&ResponsibleBusiness Appendices CITI 2021 ESG REPORT 48
Engagement Engagement with our stakeholders, clients and industry experts helps us to stay current i n o ur u nderstanding o f t his c ritical and evolving area of impact, to strengthen our management and analysis of climate risk in our portfolio and to advance prog - ress in this area across industries. During 2021, we hosted a stakeholder engagement session, facilitated by Ceres, for clients, investors and nongovernmental organizations. Participants provided input on Citi’s TCFD disclosures and our approach to setting net zero targets and measuring our baseline emissions. Feedback from that session has been integrated into our 2021 TCFD report and will guide our progress as we continue to develop our net zero plan. See our 2021 TCFD Report for a summary of key take - aways from the session. To advance progress, we have worked with organizations such as Rocky Mountain Institute’s Center for Climate-Aligned Finance. The Center works with financial institutions on identifying 1.5°C-aligned emissions reduction pathways for sectoral portfolio measurement and target-setting and developing credible institutional tran - sition plans. In addition, Citi contributed to the World Economic Forum’s Financing the Transition to a Net-Zero Future report . The report reflects input from financial institutions and the public sector related to mobilizing investments in breakthrough technologies that will facilitate a more sustainable future. Our Sustainability & Corporate Transitions team and Natural Resources & Clean Energy Transition team engage with our clients to pursue opportunities and support their efforts to transition to net zero. Learn more in the Financing the Low-Carbon Transition section . See the Stakeholder Engagement at Citi section for additional examples of our engagement efforts in 2021. Contents ESGatCiti SustainableFinance SustainableProgress Equitable&ResilientCommunities Talent& DEI RiskManagement&ResponsibleBusiness Appendices CITI 2021 ESG REPORT 49
Sustainable Operations Citi has a history of prioritizing healthy buildings, along with two decades of measuring and reducing our environmental footprint. We are well-positioned to meet the dual challenges of climate change and COVID-19 head on, as we enable sustainable operations and healthy facilities for our customers and employees. Net Zero Commitment Citi’s commitment to achieve net zero GHG emissions by 2050 includes both our financing and our own operations. For our operations, we are targeting net zero emissions by 2030. This includes GHG emissions related to our owned and leased facilities, employee commuting and busi - ness travel, and emissions associated with our supply chain. During 2021, we undertook a discovery and planning process to develop a strategy for reaching this commitment. This included broad engagement with employees from our Enterprise Operations & Technology group, and analysis to help us define the boundaries of the commitment, under - stand the potential challenges, and identify short-, medium- and long-term priorities to help us reach our goal. With t he a nnouncement o f o ur commitment t o n et z ero G HG e missions, we b roadened o ur e ngagement w ith employees a cross C iti, i ncluding t hose working i n t he a reas o f r eal e state, technology, su pply c hain, s hared s ervices, travel a nd f acility o perations. O ur g oal w as to in crease u nderstanding a nd c apabilities across o ur o rganization, w hile a lso g aining greater i nsight i nto t he fu ll s cope o f o ur GHG e missions. E mployees i n t hese g roups helped e valuate t heir o wn p rocesses to i dentify a nd m ap G HG e missions throughout C iti. W e t hen e ngaged a t hird party t o h elp u s q uantify t hose e missions. This e ngagement h as s et t he s tage f or collaboration a s w e d rive t oward n et z ero in o ur o perations. As part of our discovery process, we also expanded our GHG inventory. We have been tracking Scope 1, Scope 2 and a portion of Scope 3 GHG emissions related to our own operations for many years. However, this was the first time we included broader Scope 3 emissions related to our supply chain, which is inte - gral to grasping the total impact of our operations. Due to limitations in data availability and quality, we used spend data and industry emissions factors from the US Environmentally-Extended I nput-Output Models as the basis for our GHG inventory. While this approach has its limitations, the insights we have gleaned from this analysis are nonetheless helping us identify priority areas that warrant additional investigation and suppliers we can meaningfully engage with to create the greatest impact. As supplier-specific data becomes available and methodologies improve, we will recalculate our supply chain emissions. The GHG inventory is available in our 2021 Task Force on Climate-related Financial Disclosures (TCFD) report . We are keenly aware that a balanced approach will be needed to drive emissions reductions for our operations. This might include a reduction in our consumption of supplier goods and services, while also engaging with suppliers to drive process improvements and innovations. We are also working toward our 2025 operational footprint goals (see following page), which aim to reduce GHG emissions and energy consumption for our operations. In addi - tion, we are piloting zero-carbon b uilding requirements for all new Citi buildings, targeting emissions from operations as well as embodied emissions in the materi - als used to construct the buildings. See the Climate Risk and Net Zero section for an overview of our commitment to net zero GHG emissions, including as it relates to our financing. Contents ESGatCiti SustainableFinance SustainableProgress Equitable&ResilientCommunities Talent& DEI RiskManagement&ResponsibleBusiness Appendices CITI 2021 ESG REPORT 50
Operational Footprint Goals We h ave b een m easuring o ur e nviron - mental f ootprint f or t wo d ecades a nd began r eporting o n o ur d irect o perational impacts i n 2 002. T his r eport m arks o ur first d isclosure o n p rogress a gainst o ur fourth g eneration o f o perational f ootprint goals, w hich w e a nnounced i n 2 020 a nd aim t o a chieve b y 2 025. T hese g oals a re aligned w ith a p athway t o l imit g lobal temperature r ise t o 1 .5°C a nd c over G HG emissions, e nergy u se, w ater c onsumption, waste r eduction a nd d iversion, a nd su stain - able b uilding d esign. Because o f t he o ngoing C OVID-19 pandemic, o ur f acilities w ere n ot u sed at fu ll c apacity i n 2 021, a nd o ur r elated resource c onsumption, w aste g eneration and G HG e missions w ere l ower t han t hey otherwise w ould h ave b een. W e r ecognize that i n s ome c ases t hese i mpacts w ere simply m oved t o e mployees’ h omes a nd other n on-Citi f acilities. A s a r esult o f having f ewer p eople u sing C iti b uildings, our p rogress f or 2 021 i ndicates t hat w e exceeded s ome o f o ur goa ls d uring t he year. T hat t rend c ould b riefly r everse i n t he coming y ears a s o ur e mployees c ontinue to r eturn t o t he o ffice, b efore p rogressing again t oward m eeting o ur g oals. 2025 Operational Footprint Goals This is the first year we are reporting progress against our 2025 goals. We expect our progress to fluctuate as the number of people occupying our facilities varies during the ongoing COVID-19 pandemic. In connection with our renewable electricity commitment, Citi is a member of RE100 — a global initiative led by the Climate Group and CDP (formerly the Carbon Disclosure Project), which are both part of the We Mean Business Coalition. In recognition of RE100’s requirements, we strive as much as possible to source 100% renewable electricity within the same market boundaries as our consumption. (MEASURED AGAINST A 2010 BASELINE) Goals Progress through 2021 GHG emissions 45% reduction in location-based GHG emissions 49.8% Energy 40% reduction in energy consumption 37.9% Maintain 100% renewable electricity sourcing 100.0% * Water 30% reduction in total water consumption 38.8% 25% of water consumed to come from reclaimed/reused sources 7.0% Sustainable buildings 40% of floor area to be LEED, WELL or equivalent certified 34.7% ** Waste 50% reduction in total waste 55.8% 50% of waste diverted from landfill 22.8% * 91% meeting RE100 market boundary criteria; 9% sourced from regionally aligned markets. ** 2021 total includes 14 EDGE projects in Latin America. Contents ESGatCiti SustainableFinance SustainableProgress Equitable&ResilientCommunities Talent& DEI RiskManagement&ResponsibleBusiness Appendices CITI 2021 ESG REPORT 51
In 2021, Citi Tower Hong Kong installed our largest on-site renewable energy system to date. This hybrid system generates energy for water heating and electricity. The system includes 360 solar panels, which we estimate will generate over 85,000 kilowatt-hours annually, avoiding 70 metric tons of CO 2 emissions each year. The site also has a small wind turbine. With the installation of solar panels for two more locations completed in 2021, we now have six bank branches in Mexico with on-site solar generation. These branches receive from 60% to 80% of their electricity needs from on-site solar power, including the branch pictured at right in Mexico City. The six branches have a total of 348 solar panels and a combined capacity of 115 kilowatts when operating at their peak output. In 2021, these sites produced 64,000 kilowatt-hours of electricity. Sustainable Building Principles in Action Whether undertaking new construction or renovating existing buildings, we prioritize efficiency and sustainability, to minimize the environmental impact of our facilities across the globe. Buildings are responsible for about 40% of global energy use and approximately one-third of GHG emissions. 2 Since our own operations consist largely of buildings, we have developed and are pilot - ing requirements for all new buildings to be zero carbon by 2030, in support of our net zero commitments. These requirements address both operational and embodied carbon emissions, inclusive of energy use, energy supply, integration with utilities and material use. Citi is currently renovating a facility in Gray, Tennessee, to align with our zero- carbon requirements. The plans for this facility include features to reduce energy use as much as possible and to meet any remaining energy needs with renewable sources. Aligning this building with our zero-carbon building requirements will also benefit the well-being of those using the building. For instance, a tight building seal will improve air quality and thermal comfort for those inside and will also improve energy efficiency. One of our 2025 goals is to have 40% of our facilities, by floor area, LEED, WELL or equivalent certified. In 2021, we earned certifications for several sustainable build - ing projects in pursuit of this goal: • Guatemala (LEED Gold): Reducing the environmental impact of the interior construction of our offices in Guatemala was instrumental in our ability to achieve LEED Gold for this site. Design features include high-efficiency fixtures and equipment to reduce water consumption by 41.5% and electrical 2. United Nations Environment Programme, “ Energy Efficiency for Buildings ,” page 1, accessed November 2021. Contents ESGatCiti SustainableFinance SustainableProgress Equitable&ResilientCommunities Talent& DEI RiskManagement&ResponsibleBusiness Appendices CITI 2021 ESG REPORT 52
WELL Building Health-Safety Rating In 2021, as a result of our health and safety practices, we received the International WELL Building Health-Safety Rating for all Citi facilities globally, including offices, operations centers, data centers and retail locations. This seal helps assure our employees and customers that our buildings are safe and healthy environments. The seal is awarded to businesses that meet rigorous scientific standards, maintenance protocols and emergency plans to address concerns related to COVID-19 and other infectious diseases now and into the future. WELL Portfolio Program Building on the success of the WELL Health-Safety Rating, Citi joined the WELL Portfolio Program — a benchmarking program for measuring and improving organizational health performance across facilities. The WELL Portfolio Program leverages the strategies of the WELL building standard, the leading health-focused building standard. As a participating organization, Citi will receive an annual portfolio score based on our work to support and enhance the health and well-being of employees and customers who work in and visit our buildings every day. consumption by 15.7%. We also reused 77% of the facility’s furniture to reduce waste, and we were able to effectively manage c onstruction-related w aste, capping the volume sent to landfill at 31.7 kg/m 2 , which is 15% below the industry standard. • Paraguay (EDGE Advanced): We earned our first EDGE Advanced Certification for our Agrovet Offices in Paraguay. The Excellence in Design for Greater Efficiencies (EDGE) certi - fication system evaluates buildings in three resource categories: energy, water and materials. We earned Advanced Certification through the use of features that increase energy efficiency by 63% (mainly related to the building’s heating and cooling systems), increase water efficiency by 20% through high-efficiency accesso - ries in restrooms and reduce embodied energy of materials used for interior spaces by 89%. • China, Taiwan, United States (LEED Volume Program): We accomplished LEED v2009 certification for 11 bank branches through the LEED Volume Program and achieved LEED v4 Gold for our fourth retail prototype. All new and renovated bank branches will be LEED Certified based on this model. We are also planning a significant renova - tion of Citi Tower in London, headquarters for our Europe, Middle East and Africa region. For this project, which we expect to complete in 2025, we are prioritizing sustainable building principles and employee well-being in alignment with LEED, BREEAM and WELL standards. By renovating the existing building, rather than demolishing it to build a new struc - ture, we will avoid releasing an estimated 100,000 metric tons of embodied carbon, equivalent to 21,748 passenger vehicles driven for one year. 3 We are designing Citi Tower London for energy efficiency from top to bottom, within the constraints of an existing building, and are factoring carbon emissions into our decision-making process. The building will feature rooftop solar panels generating more than 52,000 kilowatt-hours per year annually — enough to power 18 average UK homes 4 for one year. Efficient fixtures will reduce water consumption by 20% 5 and a grey water 2021 2021 3. EPA Greenhouse Gas Equivalencies Calculator . 4. Average electricity UK home 2021 resource, data from OFGEM . 5. A gainst L EED b aseline. Contents ESGatCiti SustainableFinance SustainableProgress Equitable&ResilientCommunities Talent& DEI RiskManagement&ResponsibleBusiness Appendices CITI 2021 ESG REPORT 53
reuse system will help us save an esti - mated 29.5 cubic meters of water each day, enough to fill 4.3 Olympic pools over the course of a year. 6 During construction, we plan to refurbish and reuse materials on-site to reduce waste and embodied carbon, and we will work to significantly minimize waste sent to landfill. Employee and Customer Well-Being For many years, Citi has prioritized the intersection of sustainability and employee well-being. When looking at how our buildings can affect the well-being of our employees, we manage air quality and acoustics, as well as providing ergonomic furniture, opportunities to stay active, healthy food options and a work environ - ment that is both flexible and effective. As a result of our efforts, we’ve received WELL Silver certification from the International WELL Building Institute™ for two facilities, one each in Hong Kong and India. Both facilities are going through the WELL recertification process, which is required every three years. We are also working toward WELL certification for our London headquarters renovation. The WELL Building Standard is a system for measuring, certifying and monitoring building features that impact the health and well-being of occupants. In recognition of how important it is to design buildings for employee well-being, we have included WELL certification as an aspect of our sustainable building goal for 2025. The COVID-19 pandemic further emphasized the importance of employee well-being at our office facilities, in addition to the well-being of our employees and customers within our branches. With this in mind, we have instituted initiatives and protocols aligned with the Centers for Disease Control and Prevention guidelines. These measures include improved ventilation and air treatment systems; signage about effective handwashing; sanitizer stations; enhanced cleaning measures to reduce exposure to pathogens, allergens and harmful chemicals; and rules related to social distancing and masks. In addition, we have installed plexiglass barriers in our branches to provide increased protection for our employees and customers. To further support our colleagues, we are also providing employees with additional physical and mental health resources. Employee Engagement Our colleagues contribute to our culture of sustainability through volunteer efforts and awareness campaigns. Despite the challenges a remote working environment posed during 2021, Citi piloted an Earth Day initiative within its global Green Team Network of 18 teams. This initiative encour - aged employees to live more sustainably and complete tasks to save water, reduce waste and energy consumption and learn more about climate change. 6. In one year, this equals 10,767.5 cubic meters. Olympic pool size: 2,500 cubic meters. 10,767.5/2,500 = approx. 4.3. Contents ESGatCiti SustainableFinance SustainableProgress Equitable&ResilientCommunities Talent& DEI RiskManagement&ResponsibleBusiness Appendices CITI 2021 ESG REPORT 54
Beyond E arth D ay, e mployees a cross t he company a lso c ontribute t o su stainability initiatives a s a p art o f t heir r egular work r esponsibilities. F or e xample, m any of o ur e mployees h ave su stainability- related r esponsibilities a s p art o f t heir day-to-day w ork, su ch a s t hose i nvolved in o ur climate r isk , environmental a nd social r isk m anagement a nd low-carbon transition e fforts. Efficient Travel Options Due to COVID-19, employee commuting and business travel has dropped signifi - cantly since 2019. For many years, we have encouraged employees to use video and web conferencing technologies rather than traveling, whenever possible. With the onset of the global pandemic, we quickly transitioned the entire company to adopt use of these platforms for their daily interactions. As our employees return to the office, we are relying on the efficiency efforts we had in place before the onset of COVID-19. For instance, many of our offices are centrally located near public transpor - tation, which reduces the need for employ - ees to drive to work, and we provide U.S.- based employees pretax dollars to cover the cost of commuting by subway, bus, train, ferry and vanpool. We also offer bike storage and bike racks at several facilities and sponsor bike share programs, known as the Citi Bike ® Program , in New York City, Jersey City and Miami. At our car park in the Citigroup Centre in London, we offer a dozen charging stations for those driving el ectric v ehicles. Due to our global scale, we often need to meet with clients, partners, teams and other stakeholders across the world. Now that many colleagues across the firm have started traveling again, we are working to build awareness for how business travel impacts our carbon footprint. For example, when employees book travel reservations, they are able to see the emissions data related to their air travel. We plan to include emissions data for rail travel, hotels and rental cars in the future. Managing Climate Risk in Our Operations The effects of climate change, particularly extreme weather events, pose a potential risk to our operations. Our Citi Realty Services (CRS) Group and our Crisis Management and Business Continuity teams help us to monitor, prepare for and respond to extreme weather events or other disruptions to our operations. In addition, CRS conducts due diligence for each proposed new location and reassesses the properties’ structural resilience periodically, based on risk, as well as following significant events. These assessments take internal Citi standards, as well as local and international codes, into account. Because Citi operates in nearly 100 countries, our facilities could potentially be exposed to a range of varied climate- related risks. To increase our resiliency, we have invested in climate adaptation solutions in a number of critical facilities. In addition, our crisis management team has developed action plans to address immediate risks and support our employees and customers before, during and after adverse events. Our business continuity team also has plans in place to help Citi resume business operations as quickly as possible in the aftermath of an extreme climate event. Transparent Reporting of Operational Climate Impacts Citi reports our Scope 1, Scope 2 and Scope 3 GHG emissions in both this ESG report and in our CDP response. We began reporting on the direct environmental impacts of our operations in 2002 and have submitted data to CDP every year since 2003. We follow the GHG Protocol Corporate Standard and Scope 2 Guidance for measuring and reporting both market- based and location-based Scope 1 and Scope 2 GHG emissions. We also report Scope 3 CO 2 emissions from air and train business travel in this ESG report , and we report Scope 3 electricity transmission loss and employee commut - ing d ata t o C DP. I n e arly 2 022, C iti r eceived the following scores from CDP related to 2020 data: • Climate change score: A- • Supplier engagement score: A Our GHG emissions and environmental data for our operations and business travel are verified and assured by SGS, a leading third-party inspection, verification, testing and certification company. For our SGS Assurance Statement, see the Assurance section . Contents ESGatCiti SustainableFinance SustainableProgress Equitable&ResilientCommunities Talent& DEI RiskManagement&ResponsibleBusiness Appendices CITI 2021 ESG REPORT 55
Environmental Performance for Operations Goals Progress through 2021 Maintain 100% renewable electricity sourcing 100.0% * 45% reduction in location-based GHG emissions 49.8% 40% reduction in energy consumption 37.9% 30% reduction in total water consumption 38.8% 25% of water consumed to come from reclaimed/reused sources 7.0% 40% of floor area to be LEED, WELL or equivalent certified 34.7% ** 50% reduction in total waste 55.8% 50% of waste diverted from landfill 22.8% Region Certified * Silver Gold Platinum Total Asia Pacific 10 29 51 12 102 Europe, Middle East and Africa 4 7 30 9 50 Latin America 23 7 6 1 23 North America 35 33 73 2 143 Total 72 76 160 24 332 Building Type 2017 2018 2019 2020 2021 ** Branches 4 1 14 14 7 Data Centers 1 0 0 0 0 DC File Storage 0 0 0 0 0 Office Buildings 12 12 18 15 19 Operational Centers 3 1 1 2 1 Total 20 14 33 31 27 Cumulative Total *** 227 241 274 305 332 OPERATIONAL FOOTPRINT GOALS (MEASURED AGAINST A 2010 BASELINE) LEED-CERTIFIED BUILDINGS BY REGION* LEED-CERTIFIED BUILDINGS BY BUILDING TYPE * * This is based on the active buildings in the portfolio as of year end 2021 and excludes projects for inactive and disposed buildings. ** 2021 total includes 14 EDGE projects in Latin America (13 office and 1 branch). *** Includes buildings certified prior to 2017. * 91% meeting RE100 market boundary criteria; 9% sourced from regionally aligned markets. ** 2021 total includes 14 EDGE projects in Latin America. * Certified total includes 14 EDGE projects in Latin America. Contents ESGatCiti SustainableFinance SustainableProgress Equitable&ResilientCommunities Talent& DEI RiskManagement&ResponsibleBusiness Appendices CITI 2021 ESG REPORT 56
Environmental Performance for Operations (continued) GHG EMISSIONS (SCOPE 1 & 2) BY REGION REGIONAL OPERATIONAL ENVIRONMENTAL PERFORMANCE Region Scope 1 C0 2 e (mt) Scope 2 CO 2 e Location-Based (mt) Scope 2 CO 2 e Market-Based (mt) Total CO 2 e Location-Based (mt) Total CO 2 e Market-Based (mt) Asia Pacific 755 133,947 50,807 134,702 51,562 Europe, Middle East and Africa 3,939 42,248 5,171 46,187 9,111 Latin America 2,046 83,969 4,022 86,015 6,068 North America 37,943 203,147 978 241,090 38,921 Region GHG Emissions Location-Based (mt) GHG Emissions Market-Based (mt) Total Energy Consumption (GWh) Total Water Consumption (m 3 ) Total Waste (mt) Asia Pacific 134,702 51,562 215 593,988 4,324 Europe, Middle East and Africa 46,187 9,111 171 315,964 1,911 Latin America 86,015 6,068 219 801,014 7,767 North America 241,090 38,921 743 1,908,663 11,593 Emission Factor Basis Electricity (kWh) Steam (kWh) Chilled Water (kWh) Total (kWh) % of Total Consumption RECs or Other Energy Attribute Certificates (EACs) 865,079,675 0 0 865,079,675 76% PPA or Source Contract 140,856,007 0 0 140,856,007 12% Self-Generated Renewables 117,604 0 0 117,604 0% Supplier-Specific 0 0 0 0 0% Residual Mix 0 0 652,402 652,402 0% Regionally Aligned EACs – Grid Average 104,781,026 0 17,274,301 122,055,327 11% Steam Default 0 8,427,189 0 8,427,189 1% Total 1,110,834,312 8,427,189 17,926,703 1,137,188,204 100% ENERGY CONSUMPTION BY MARKET-BASED EMISSION FACTOR TYPES Note: Figures may not sum to totals due to rounding. Contents ESGatCiti SustainableFinance SustainableProgress Equitable&ResilientCommunities Talent& DEI RiskManagement&ResponsibleBusiness Appendices CITI 2021 ESG REPORT 57
2010 2017 2018 2019 2020 2021 Operating Sq. Ft. 64,172,247 48,051,230 45,137,587 45,116,344 42,349,249 40,746,199 Headcount 336,622 208,043 199,458 188,779 193,989 200,347 Energy 2010 2017 2018 2019 2020 2021 Natural Gas (GWh) 123 63 80 70 65 178 LP Gas (GWh) -- -- -- 1 1 1 Fuel Oil (GWh) 50 29 28 0 0 0 Diesel (GWh) -- -- -- 32 30 32 Scope 1 Energy (GWh) 173 92 108 104 95 210 Electricity (GWh) 1,922 1,447 1,374 1,312 1,180 1,111 District Heating (Steam & Chilled Water) (GWh) 74 58 57 46 29 26 Scope 2 Energy (GWh) 1,996 1,505 1,431 1,358 1,209 1,137 Total Energy (GWh) 2,169 1,597 1,539 1,461 1,304 1,348 CO 2 e Emissions 2010 2017 2018 2019 2020 2021 Direct CO 2 e (GHG Scope 1) (Gas & Fuel Oil) 38,912 20,951 24,132 23,095 21,236 44,683 Indirect CO 2 e (GHG Scope 2) (Electricity, Steam & Chilled Water) 973,169 677,636 620,485 568,780 505,224 463,311 Total CO 2 e (mt) 1,012,081 698,587 644,618 591,875 526,459 507,994 Water Consumption 2010 2017 2018 2019 2020 2021 Potable Water (m 3 ) 5,899,458 4,595,506 4,269,280 4,205,434 3,444,961 3,366,620 Nonpotable Water (m 3 ) 15,299 284,292 247,846 277,642 337,431 253,010 Total Water Consumption (m 3 ) 5,914,757 4,879,798 4,517,127 4,483,076 3,782,392 3,619,630 ABSOLUTE INDICATORS Environmental Impact Report Note: Figures may not sum to totals due to rounding. Note: Historical data can vary from year to year due to changes in operational control as a result of acquisitions and dispositions of businesses. Historical adjustments are not made as a result of organic growth or decline for businesses remaining under operational control. Contents ESGatCiti SustainableFinance SustainableProgress Equitable&ResilientCommunities Talent& DEI RiskManagement&ResponsibleBusiness Appendices CITI 2021 ESG REPORT 58
Environmental Impact Report (continued) Total Energy Consumed 2010 2017 2018 2019 2020 2021 kWh/Rentable Sq. Ft. 34 33 34 32 31 33 kWh/Headcount 6,444 7,678 7,717 7,740 6,713 6,726 Net CO 2 e 2010 2017 2018 2019 2020 2021 Metric Tons/Rentable Sq. Ft. 0.02 0.01 0.01 0.01 0.01 0.01 Metric Tons/Headcount 3.01 3.36 3.23 3.14 2.71 2.54 Business Travel 2010 2017 2018 2019 2020 2021 Business Air Travel CO 2 e (mt) 100,243 151,112 149,588 126,055 21,785 10,554 Business Train Travel CO 2 e (mt) NA 209 227 174 44 32 Waste 2010 2017 2018 2019 2020 2021 Recycled Office Paper (mt) 17,414 11,709 10,953 10,760 6,251 5,824 Refuse and Other (mt) 40,471 26,846 26,677 25,633 21,153 19,771 Total Waste (mt) 57,885 38,555 37,630 36,393 27,404 25,595 RELATIVE INDICATORS SCOPE 3 EMISSIONS Note: Historical data can vary from year to year due to changes in operational control as a result of acquisitions and dispositions of businesses. Historical adjustments are not made as a result of organic growth or decline for businesses remaining under operational control. Contents ESGatCiti SustainableFinance SustainableProgress Equitable&ResilientCommunities Talent& DEI RiskManagement&ResponsibleBusiness Appendices CITI 2021 ESG REPORT 59
In This Section 62 Our Commitment to Social Finance 66 Action for Racial Equity 70 Citi Impact Fund 72 COVID-19 Relief and Recovery 75 Affordable Housing 78 Strategic Philanthropy Equitable and Resilient Communities Contents ESGatCiti SustainableFinance SustainableProgress Equitable&ResilientCommunities Talent&DEI RiskManagement&ResponsibleBusiness Appendices CITI 2021 ESG REPORT 60
Over the past two years, the COVID-19 pandemic reaffirmed the urgency to address the vast and growing inequities facing our global society, from financial security and access to basic human necessities to affordable housing and economic opportunity. Throughout 2021, Citi and the Citi Foundation accelerated and expanded investments in communities around the world, helping to support a more inclusive recovery and more equitable future. Building on our longstanding leadership in financial inclusion, we expanded the scope of our social finance efforts to maximize our impacts and to help achieve the $500 Billion Social Finance Goal we set as part of our overall $1 trillion commitment to sustainable finance by 2030. We invested $1 billion in a broad suite of initiatives designed to help close the racial wealth gap in the United States and to increase economic mobility through Citi and the Citi F oundation’s Action for Racial Equity commitment. And we increased our invest - ments in the Citi Impact Fund , more than half of which went to minority-owned and women-owned c ompanies. We also continued to support COVID-19 relief and recovery efforts globally while staying f ocused o n o ur l ong-term p riorities, including affordable hou sing and the Citi Foundation’s s trategic g rantmaking e fforts . Investing in Our Communities 2021 Highlights $500B Social Finance Goal Committed to reach 15M households, including 10 million women, by 2025 $59B in social finance activity globally in 2020 and 2021 Issued inaugural $1B Citi Social Finance Bond offering $1B invested in initiatives to help close the racial wealth gap 68% of asset allocation directed to women and/ or racially/ethnically diverse founders of companies through the Citi Impact Fund $5.64B financed for affordable housing projects in the United States $100+M in grants provided by the Citi Foundation Announced our Contents ESGatCiti SustainableFinance SustainableProgress Equitable&ResilientCommunities Talent&DEI RiskManagement&ResponsibleBusiness Appendices CITI 2021 ESG REPORT 61
Our Commitment to Social Finance Billions of people around the world lack access to basic necessities — clean water, education, electricity, financial products, housing, medicine — hampering their economic progress and social growth. As an institution with a longstanding history of driving positive social impact and financial innovations that benefit communities around the world, we took our commitment to a new level in 2021: announcing a $500 Billion Social Finance Goal as part of our $1 trillion commitment to sustainable finance by 2030 with corre - sponding criteria for activities related to affordable basic infrastructure, affordable housing, diversity and equity, economic inclusion, education, food security and healthcare. Many of our Citi business units — including Banking, Capital Markets and Advisory; Global Markets; Trade and Treasury Services; Citi Community Capital; and Citi Commercial Bank — are dedicated to delivering products and services that can contribute to the social finance goal. These include the issuance of social bonds and sustainability-linked bonds, financing and advisory services to companies with social missions, creation of municipal bonds with social use of proceeds (such as education or health), or loans and facilities with eligible social use of proceeds. We have broadened the focus of our global Citi Social Finance team, formerly our Inclusive Finance team, which works across Citi businesses globally to develop scalable business platforms and client solutions that enable the bank, our clients and partners to expand financial inclusion, accelerate access to basic services, boost job creation and scale social infrastructure development in emerging markets. As part of our social finance focus, we are aiming to invest in opportunities for 15 million low-income households, including 10 million women, globally by 2025. The recent expansion of this team builds on our 15-year track record of developing new business models and partnerships that leverage market-based approaches to improve the livelihoods of low-income communities around the world. Since 2007, these efforts have reached 4.1 million unbanked and underbanked individuals in emerging markets — including 3.7 million women. These efforts, which are focused on supporting emerging markets, are comple - mented by our social finance activities in higher-income countries, such as our work to finance affordable housing projects in the United States and to issue bonds that help advance a range of social solutions. Read some case studies of the deals that will contribute to our $1 trillion commitment later in this chapter and in the Sustainable Finance section . Our extensive work on social finance contributes to progress on SDG 8 , which aims, among other things, to provide full and productive employment and decent work for all . For example, Citi’s work on financial inclusion around the world contributes to target 8.3 , which encourages productive activities, decent job creation, entrepreneurship, creativity and innovation, and the formalization and growth of micro-, small- and medium-sized enterprises through access to financial services . Our approach also supports target 8.10 , which aims to strengthen the capacity of domestic financial institutions to encourage and expand access to banking, insurance and financial services for all . Social finance is also a key success factor for progress on SDG 9 , which aims to build resilient infrastructure, promote inclusive and sustainable industrializa - tion and foster innovation , specifically enabling progress on target 9.3 , which seeks to increase the access of small- scale enterprises, facilitating integration into value chains and markets . And our work on catalyzing the distribu - tion of small loans in emerging markets — which typically benefits women — directly contributes to SDG 5 , in support of gender equality and empowerment for all women and girls , and in particular target 5.a , which strives for a range of gender-related objectives, including giving women equal rights to economic resources . SDG Goal 8: Decent Work and Economic Growth SDG Goal 9: Industry, Innovation and Infrastructure SDG Goal 5: Gender Equality Contents ESGatCiti SustainableFinance SustainableProgress Equitable&ResilientCommunities Talent&DEI RiskManagement&ResponsibleBusiness Appendices CITI 2021 ESG REPORT 62
Latin America Mexico Europe, Middle East & Africa Asia Pacific Argentina Bahamas Brazil Chile Colombia Costa Rica D.R. Ecuador El Salvador Guatemala Haiti Honduras Jamaica Panama Paraguay Peru Puerto Rico Trinidad/ Tobago Uruguay Mexico Algeria Austria Bahrain Belgium Bulgaria Cameroon Congo, DR Côe d’Ivoire Czech Rep. Denmark Egypt Finland France Gabon Germany Ghana Greece Hungary Iraq Ireland Israel Italy Jersey Jordan Kazakhstan Kenya Kuwait Lebanon Luxembourg Mauritius Monaco Morocco Netherlands Nigeria Norway Pakistan Poland Portugal Qatar Romania Russia Saudi Arabia Senegal Slovakia South Africa Spain Sweden Switzerland Tanzania Tunisia Turkey UAE UK Uganda Ukraine Zambia Australia Bangladesh China Hong Kong India Indonesia Japan Macau Malaysia New Zealand Philippines Singapore South Korea Sri Lanka Taiwan Thailand Vietnam North America United States Canada Bond Offerings Advance Social Initiatives In October 2021, we issued o ur inaugural Citi Social Finance Bond, a $1 billion bond offering to support social and economic development efforts or activities that increase opportunity and access to essential basic services. Proceeds from the bond will finance a range of projects, including those that expand access to financial services, affordable housing, basic infrastructure, healthcare and education in underserved and unbanked communities in emerging markets. The bond offering followed the release of our Citi Social Finance Framework , one of the world’s first global social finance frameworks focused on enabling financial inclusion, affordable housing and access to essential services in emerging markets. The framework, which was developed in line with the International Capital Market Association (ICMA) Social Bond Principles 2021, * details how projects and assets will be selected. We will report annually on the use of funds and related impacts. The Citi Social Finance Bond follows the 2020 issuance of Citi’s inaugural $2.5 billion Affordable Housing Bond, which was then the largest-ever social bond from an issuer in the private sector. Learn more . * Sustainalytics, an independent provider of sustainability research, analysis and services to financial institutions globally, reviewed the Framework and confirmed in its assessment the alignment with the transparency and reporting requirements of the ICMA Social Bond Principles 2021. Worl d Bank Low-Income and Lower-Middle-Income Countries with Citi Presence Upper Middle-Income Countries with Citi Presence High-Income Countries with Citi Presence CITI’S SOCIAL FINANCE ACTIVITIES IN EMERGING MARKETS Citi's global footprint and capabilities make the bank uniquely able to provide a consistent and developed approach to local currency funding in support of the economies benefitting the world's most underserved communities. Contents ESGatCiti SustainableFinance SustainableProgress Equitable&ResilientCommunities Talent&DEI RiskManagement&ResponsibleBusiness Appendices CITI 2021 ESG REPORT 63
Social Finance Transactions The following are examples of social finance transactions from 2021 that demonstrate our efforts to drive positive social impact in underserved communities around the world. Other examples can be found in the Sustainable Finance section . In Sub-Saharan Africa, more than 50 million families earn a living from small farms, which produce 80% of the continent’s food. But harvests still lag far behind the rest of the world. The nonprofit One Acre Fund supplies smallholder farmers with everything they need to grow more food and earn more money, with the primary goal of enhancing food security. In partnership with the U.S. International Development Finance Corporation (DFC), Citi structured a $10 million flexible working capital solution for One Acre Fund in Kenya and an additional $5 million working capital facility for the other seven African countries where One Acre Fund operates. Since 2015, farmers who participate in One Acre Fund’s programs earn on average nearly 50% more than peer farmers who are not on One Acre Fund-supported activities. EXPANDING ACCESS TO LOANS IN B ANGLADESH Basic Unit for Resources and Opportunities of Bangladesh (BURO Bangladesh) is a leading microfinance institution that offers high-quality loans, savings and insurance to small businesses, smallholder farmers and women. BURO Bangladesh currently serves more than 2.2 million low-income women, with average loans of approximately $850. In 2021, Citi was the sole arranger of $68 million in in equivalent local currency, which is expected to give 85,000 people — 80% of them women — access to finance. ENHANCING FOOD SECURITY FOR SMALLHOLDER FARMERS Contents ESGatCiti SustainableFinance SustainableProgress Equitable&ResilientCommunities Talent&DEI RiskManagement&ResponsibleBusiness Appendices CITI 2021 ESG REPORT 64
SUPPORTING LOCAL INFRASTRUCTURE IN MEXICO Banco Nacional de Obras y Servicios Públicos, Sociedad Nacional de Crédito (Banobras) is a state-owned Mexican development bank that seeks to improve the quality of life of local populations while contributing to the country’s sustainable development. Banobras provides financing to public and private investment projects focused on the delivery of essential infrastructure and public service projects. In September, Citibanamex acted as a joint bookrunner for an approximately $500,000 local sustainability bond linked to basic infrastructure projects — infrastructure damaged by natural disasters; renewables: wind farms, photovoltaic plants and/or hydroelectric plants; sustainable transportation; wastewater treatment plants; and hospitals and energy efficiency projects. IMPROVING LIVELIHOO DS THROUGH CLEAN ENERGY SOLUTIONS d.light is a global leader and pioneer in delivering affordable solar-powered solutions designed for the 759 million people in the developing world without access to reliable energy. Through four hubs in Africa, China, South Asia and the United States, d.light has sold more than 20 million solar light and power products in 70 countries, improving the lives of over 100 million people. In 2019, Citi provided a $5 million working capital loan in local currency to enable d.light to provide clean energy solutions that improve livelihoods in Kenya. In 2021, Citi provided an incremental $3 million working capital facility. Contents ESGatCiti SustainableFinance SustainableProgress Equitable&ResilientCommunities Talent&DEI RiskManagement&ResponsibleBusiness Appendices CITI 2021 ESG REPORT 65
Action for Racial Equity In the midst of a global pandemic that disproportionately affected communities of color, we took a hard look at ourselves and our own contribution to the status quo. We saw how we could use our power — as individuals, as a company and as an industry — to drive a lasting transformative movement toward greater equity. The r esult w as Action for Racial Equity , a four-pronged c ommitment o f C iti a nd t he Citi Foundation to invest more than $1 billion by 2 023 i n s trategic i nitiatives t o p rovide greater access to banking and credit in communities o f c olor, in crease in vestment in B lack-owned bu sinesses, e xpand a fford - able hou sing an d ho meownership am ong Black A mericans, an d a dvance an ti-racist practices i n o ur o wn c ompany a nd i n t he financial s ervices i ndustry. By November 2021 — one year into our three-year pledge — we had already invested $1 billion into initiatives expanding economic opportunity f or c ommunities o f c olor, putting u s o n t rack t o e xceed o ur o riginal $1.1 billion commitment set in 2020. Since t he l aunch o f Action for Racial Equity , we h ave b een e ngaged a cross o ur b usiness to t hink a nd a ct i n su pport o f e quity a nd our g oal o f c losing t he ra cial w ealth g ap and i ncreasing e conomic m obility i n t he United States. Throughout 2021, we worked on o ne o f o ur k ey m easures o f su ccess — institutionalizing t he c ommitment t o ra cial equity a cross t he fi rm. F or e xample, w e created t he D iverse F inancial I nstitutions Group, a d edicated t eam w ithin C iti t hat i s serving a s a h ub t o l ead a nd e xpand fi rm - wide e ngagement w ith m inority d epository institutions ( MDIs), di verse b roker-dealers and d iverse as set m anagers. W e’re a lso diversifying o ur t eams t o b etter s erve our c ommunities. W e s tarted t o d evelop a centralized F inancial I nclusion a nd R acial Equity S egment T eam w ithin U .S. Per sonal Banking t o d evelop t argeted a nd i nte - grated s egment s trategies, d rive s eamless customer-centric e xecution, a nd c hampion greater fi nancial i nclusion, ra cial e quity and c ustomer p rotection. We’re h arnessing o ur i nfluence t o encourage o ur l aw fi rm a nd a gency partners t o j oin u s i n e fforts t o a dvance racial eq uity. W e ob tained de tailed diversity d ata f rom t he U .S. l aw p artners who m ake u p m ore t han t wo-thirds o f o ur U.S. l egal s pend, e nabling u s t o i dentify opportunities t o i ncrease re presentation of d iverse a ttorneys o n C iti’s l egal m atters. And w e’re w orking w ith a dvertising a gency partners t hat c omprise t he l argest p ortion of o ur m arketing s pend t o in crease d iverse representation o f a gency t eams, i ncluding senior l eadership, t o h elp e nsure d iversity in C iti m arketing m aterials. We r ecognize t hat t o c ontinue c losing t he racial w ealth g ap, w e n eed a n a pproach that s parks i mmediate c hange w hile a lso creating e conomic s olutions t hat su pport systemic c hange f or t he l ong t erm. W e also r ecognize t he n eed t o h old o urselves accountable, s tarting w ith b eing t rans - parent a bout w here w e a re a nd w here we n eed t o c ontinue p ushing t o i mprove. That’s w hy w e c ommitted t o a third-party racial e quity a udit o f o ur Action for Racial Equity c ommitments. A dditionally, we w ere t he fi rst m ajor W all S treet bank t o p articipate i n t he M anagement Leadership f or T omorrow B lack E quity at W ork C ertification, w hich w as c reated to h elp g uide c ompanies a nd k eep t hem accountable f or m aking p rogress ar ound Black e quity. ( Learn m ore a bout t he certification i n t he Talent a nd D iversity , Equity & Inclusion s ection.) Our Action for Racial Equity commitments contribute to SDG 8 , which aims, among other things, to provide full and produc - tive employment and decent work for all and specifically contributes to target 8.3 , which supports productive activities, decent job creation, entrepreneurship, creativity and innovation, and the formalization and growth of micro-, small- and medium-sized enterprises through access to financial services . Our approach also supports target 8.10 : to strengthen the capacity of domestic financial institutions to encourage and expand access to banking, insurance and financial services for all . The affordable housing components of Action for Racial Equity align with SDG target 11.1 , which includes providing access for all to adequate, safe and affordable housing and basic services . SDG Goal 8: Decent Work and Economic SDG Goal 11: Sustainable Cities and Communities Contents ESGatCiti SustainableFinance SustainableProgress Equitable&ResilientCommunities Talent&DEI RiskManagement&ResponsibleBusiness Appendices CITI 2021 ESG REPORT 66
Made a new equity investment in First Independence Bank, increasing the number of minority depository institutions (MDIs) Citi has invested in to 11 Total to date: $44 million Commit ted new Citi Impact Fund equity investments in Cityblock Health, Wonderschool, Cayaba Care and seed-stage venture capital firm Precursor Ventures Total to date: $25 million Opportunity LA (OLA) began providing savings accounts to 44,000+ first grade students in the Los Angeles Unified School District using the Citi Start Saving ® platform, becoming the largest universal children’s savings account program in the United States Worked exclusively with five Black-owned firms to syndicate a $2.5 billion bond issuance. Proceeds from the bond will finance quality affordable housing for low-and moderate-income populations in the United States To date, the Citi Foundation has granted $72 million of its three- year target to invest $100 million in community change agents advancing racial equity Expanded reach of the low-cost Citi ® Access Account Package with Local Initiatives Support Corporation (LISC) through their Financial Opportunity Centers in Chicago, Detroit, Houston, Rhode Island and Toledo, Ohio Spent over $1.2 billion with diverse suppliers in 2021, including $432 million with Black-owned businesses alone Closed $16.5 million in affordable housing loan participation opportunities with MDIs Total to date: $36 million Announced plans to eliminate overdraft fees, returned item fees and overdraft protection transfer fees for improved access to banking products and services to aid with addressing racial wealth gaps that have a disproportionately negative impact on Black and Latino customers Action for Racial Equity: An Update on Our Progress Action for Racial Equity Goals Expand banking and access to credit in communities of color Invest in Black entrepreneurship Strengthen Citi’s policies and practices in order to become an anti-racist institution Invest in affordable housing and promote the growth of Black homeownership Citi and Citi Foundation Highlights Since Our One-Year Update 1 2 3 4 Contents ESGatCiti SustainableFinance SustainableProgress Equitable&ResilientCommunities Talent&DEI RiskManagement&ResponsibleBusiness Appendices CITI 2021 ESG REPORT 67
RACIAL EQUITY AUDIT Measurement and transparency are essential components of our efforts to advance diversity, equity and inclusion both at our own bank and through our contributions to our communities and society more broadly. In that spirit, we committed to conduct a third-party racial equity audit to assess our efforts to help address the racial wealth gap in the United States through the design and implementation of Action for Racial Equity . Covington & Burling LLP, which has civil rights expertise and experience leading racial equity audits across various industries, is conducting the audit. The firm is gathering input from a range of stakeholders, including Citi employees involved in implementing Action for Racial Equity , financial institutions and other partners directly benefiting or involved in implementing the initiative, and civil rights organizations that can represent the views of the customers and communities the initiative is designed to support. Conducting an audit of Action for Racial Equity will help Citi assess our work and will show where we can adapt and grow to make an even more meaningful impact going forward. The audit represents another step in our efforts to strengthen Citi’s policies and practices in order to become an anti- racist institution. The audit began in January 2022, and we look forward to sharing the findings following its expected completion at the end of 2022. BRIDGE BUILT BY CITI SM Many small- and medium-sized businesses in the United States find that securing a loan can be a time-consuming, manual process. Business owners are often limited to banks near their own locations, while local and community banks can have a tough time broadening their reach to potential borrowers. Enter Bridge built by Citi SM , a new lending platform that democratizes the loan process by matching small- and medium- sized businesses online with regional, local and community banks for loans up to $10 million. Launched in August 2021, the platform aims to expand access to capital for smaller businesses while widening the customer base for lenders. Twenty-nine banks, including nine minority depository institutions (MDIs), are participating in a pilot program in seven states in the Southeast and Rockies regions. Learn more about our engagement with other MDIs . ROHIT MATHUR, DIRECTOR, CO-CREATOR, BRIDGE BUILT BY CITI Innovation in financial technology forces you to create a new path without being able to rely on how things have always been done. We have leveraged the expertise of professionals at our bank to create a fintech solution.” “ HARTE THOMPSON, SENIOR VICE PRESIDENT, CO-CREATOR, BRIDGE BUILT BY CITI What began as a sketch on a whiteboard has now given many business owners the access to banks that they deserve.” “ Contents ESGatCiti SustainableFinance SustainableProgress Equitable&ResilientCommunities Talent&DEI RiskManagement&ResponsibleBusiness Appendices CITI 2021 ESG REPORT 68
Collaborating with MDIs Minority depository institutions (MDIs) have long been the trusted source of banking and access to capital for communities of color. For generations, they have provided essential financial services, especially for Black Americans who have not had equitable access to the mainstream banking system and therefore had fewer opportunities to build generational wealth. Research shows that, compared with other financial institutions, MDIs originate a greater share of mortgages to borrowers of color. * They also originate a greater share of small business loans guaranteed by the Small Business Administration to entrepreneurs of color than other financial institutions. But since 2001, the number of Black-owned and operated banks has declined by more than half. ** As of September 2021, there were only 20 Black banking institutions, and only one of them held more than $1 billion of assets. *** One of the four goals of Action for Racial Equity is expanding banking and access to credit in communities of color, in part through collaboration with MDIs. During Citi focus groups with Black MDIs, leaders overwhelmingly prioritized access to capital and capacity- building investments to grow their revenue and operations, which would enable the MDIs to diversify products and expand services. Our collaboration with Unity National Bank is just one example of how we’re offering expertise and guidance to MDIs. We have supported growth capital opportunities for Unity by providing an equity investment and inviting Unity in on select project-based affordable housing lending opportunities, including a loan for 381 affordable housing units in Texas. We also onboarded Unity on the Bridge built by Cit i SM platform to help expand their customer base, and we have enabled Unity to gain contract-based revenue as a subcontractor on existing Citi federal business lines. In order to help Unity prepare for long-term growth, we’re collaborating on shared media and client conversations and supporting talent acquisition by exposing high-achieving students of color to banking as a career. Further, pro bono technical assistance delivered in collaboration with Deloitte and the National Bankers Association is helping Unity to strengthen access to talent pipeline development initiatives and corporate board seats. In 2021, we doubled down on our collaboration with Unity by piloting the Citi Rotational Program, which embedded a Citi executive at Unity with the mandate of supporting revenue generation through the New Markets Tax Credit Program and expanding their affordable housing work. Lack of wealth generation opportunities and access to affordable housing continue to plague Black and Brown communities, and our mission is to create equitable access to capital to help fill that void. We’re thrilled to have the continued support and partnership of Citi, including their equity investment and embedded senior counsel, to help grow our business. Together, we can find more opportunities to drive economic value and impact in the communities we serve.” DR. KASE LAWAL, CHAIRMAN, UNITY NATIONAL BANK “ * Federal Deposit Insurance Corporation, “2019 Minority Depository Institutions: Structure, Performance, and Social Impact.” ** Federal Deposit Insurance Corporation, “Minority Depository Institutions List, Historical Data Year-by-Year 2001-2020.” *** Federal Deposit Insurance Corporation, “Minority Depository Institutions List, Fourth Quarter 2020.” Contents ESGatCiti SustainableFinance SustainableProgress Equitable&ResilientCommunities Talent&DEI RiskManagement&ResponsibleBusiness Appendices CITI 2021 ESG REPORT 69
Citi Impact Fund The Citi Impact Fund is a $200 million venture capital fund with a mission of investing in “double bottom line” companies that are addressing societal challenges, such as reaching low- and moderate-income households with innovative financial and workforce services, delivering solutions for the climate transition economy, and addressing needs for inclusive healthcare and housing. Venture capital funding has historically been inaccessible to most start-up found - ers, but especially so for women and people of color. The fund, which at its founding in 2020 was the largest impact fund ever launched by a bank using its own capital, focuses on companies that are led or owned by women or racial/ethnic minorities. We started the fund with $150 million in January 2020, adding another $50 million specifically to support businesses owned by Black entrepreneurs as part of Action for Racial Equity . Committed to 20 new investees in 2021 and Q1 2022, bringing total portfolio to 31 IMPACT FUND FOCUS AREAS $88.6M Total committed through Q1 2022 22 companies founded by women and/or racial/ethnic minorities supported to date Workforce Development Sustainability Physical and Social Infrastructure Financial Inclusion Citi Impact Fund: Progress to Date Supported 13 Black founders — most of which are seed or early-stage investments, accounting for 41% of the Fund’s portfolio and 28% of the Fund’s total equity invested Contents ESGatCiti SustainableFinance SustainableProgress Equitable&ResilientCommunities Talent&DEI RiskManagement&ResponsibleBusiness Appendices CITI 2021 ESG REPORT 70
Making an Impact Since its launch in early 2020, the Citi Impact Fund made investments in 31 U.S.-based, double-bottom line companies with business models built around positive social and environmental impact and outcomes. Thirteen of those investments were in companies with Black founders who are working to help close the racial wealth, education, healthcare and connectivity gaps in the United States, directly impacting marginalized communities for the better. Below are just some of the companies we have invested in. For the full list, visit our website . For nearly five years, Cityblock Health has been radically transforming healthcare for underserved and marginalized communities across the country. The Citi Impact Fund’s investment has helped us continue to scale our services and align business and clinical models around equitable and improved outcomes. Citi’s partnership is strong validation of our mission and how critically important it is to democratize access to high-quality, comprehensive care in our communities.” Cityblock Health TOYIN AJAYI, CEO & AND CO-FOUNDER “ The events of the last two years have stressed the importance of high-speed, low-cost broadband availability for all Americans. The hardest hit communities have seen regression in education and remote job capabilities due to lack of broadband options. Through our valuable partnership with Citi, Flume has been able to build out its initial gigabit fiber network and connect thousands of underserved people, affordable housing units, new developments and suburbs. With the Citi platform allowing Flume to rapidly deploy its technology, we can make a substantial impact on closing the digital divide with our network deployment.” Flume BRANDON GIBSON, CO-FOUNDER “ Daylight ROB CURTIS, CEO AND CO-FOUNDER “ The Citi Impact Fund’s investment in Daylight was the springboard we needed to build legitimacy for our social impact work, improving the financial lives of the LGBTQ+ community, and helped us close our seed round almost immediately afterwards. Thanks, Citi, for supporting our work to close the LGBTQ+ wealth gap." Full Harvest CHRISTINE MOSELEY, FOUNDER & CEO Full Harvest is thrilled to have Citi Impact Fund as a new investment partner, given their aligned values with our mission to help solve the $2.6 trillion global food waste problem. Full Harvest tackles food waste at the farm level with the world’s first online business-to-business produce marketplace specializing in imperfect and surplus produce. Our technology improves efficiencies for produce buyers and farms and captures market insights not previously available, all while reducing one of the largest contributors to climate change: food waste. With Citi Impact Fund’s investment, Full Harvest is able to achieve even more impact and revenue by scaling our technology further, expanding into new geographies and commodities and growing our team. A win-win-win for farmers, food companies and the planet.” “ OhmConnect CISCO DEVRIES, CEO Citi is helping fund OhmConnect’s vision to make 100% clean energy accessible to everyone. With our nearly 200,000 California customers saving energy at critical times, we have helped prevent blackouts while paving the way for a more stable grid.” “ Contents ESGatCiti SustainableFinance SustainableProgress Equitable&ResilientCommunities Talent&DEI RiskManagement&ResponsibleBusiness Appendices CITI 2021 ESG REPORT 71
COVID-19 Relief and Recovery Throughout 2021, Citi and the Citi Foundation continued to address immediate needs for COVID-19 relief while staying focused on longer-term economic recovery. Many of our efforts were geared toward underserved communities around the world, which were facing disproportionate burdens from the global pandemic. By the end of 2021, Citi and the Citi Foundation had contributed more than $160 million in COVID-19 and recovery efforts since the beginning of the pandemic. Total contributions included $3 million from Citi employees to date. Citi and the Citi Foundation provided support to organizations — small and large — all around the world: food donations and meal kits to help people facing food insecurity; support for housing stability loans; emer - gency child care programs; medical and personal protective equipment; COVID-19 screening and testing funds, and more. In India, as cases surged in the spring of 2021, Citi pledged $27 million over three years toward recovery and relief efforts. Of the total pledged, $10 million was allocated immediately toward the procurement of oxygen supplies and other equipment for frontline healthcare workers. The funds also went toward food and hygiene supplies for approximately 200,000 l ow-income f amilies. In Asia, the Citi Foundation’s grant to the Resilient Cities Network supports small- and medium-sized businesses while advancing the recovery of selected cities in the region. The Catalyzing City Resilience Solutions (CCRS) program is working with municipal governments to help local economies recover from the pandemic by identifying critical small- and medium-sized enterprises (SME) and empowering them to create and scale urban solutions that will enable greater resilience. CCRS is structured to include an initial assessment phase where cities can assess the impact of the pandemic on a particular sector and local economy; an accelerator phase where cities and the selected SME sector co-create solutions that address critical resiliency challenges; and a pilot project phase to demonstrate the potential of the selected solution. The participating city of Melaka, Malaysia, for example, is exploring how to support the SME ecosystem along the Melaka riverfront, which was especially affected by a drop in tourism. The assessment phase revealed that SMEs in the area are facing gaps in knowledge and capacity to rebuild from the pandemic and that there is a lack of stakeholder communication to deliver on resilience initiatives. Based on these findings, Melaka will launch and test a p latform t o i ncrease c ollaboration a mong key stakeholders through joint trainings and problem-solving sessions for govern - ment officials and local entrepreneurs. In the United States, the Citi Foundation announced a $25 million investment to be distributed to nonprofit organizations that provide technical assistance to minority-owned b usinesses n avigating the continued economic impacts of the pandemic. The 50 grant recipients , which each received $500,000 in unrestricted support, are local, community-based change agents that have the expertise, experience and relationships to provide tailored, on-the-ground support for affected businesses and the communities they serve. In addition, Citi deepened our relationship with No Kid Hungry, an organization working to end childhood hunger in the United States, to help address the ongoing issue of food insecurity during COVID-19. In 2021, we provided $2.8 million in new funding to support various campaigns aimed at helping the rapid response to school and community needs in New York City. Learn more about our work with No Kid Hungry . Contents ESGatCiti SustainableFinance SustainableProgress Equitable&ResilientCommunities Talent&DEI RiskManagement&ResponsibleBusiness Appendices CITI 2021 ESG REPORT 72
Every year, Citi colleagues, alumni, partners, clients, family and friends come together to participate in Global Community Day, our annual flagship volunteer initiative to give back in the communities where we live and work. For the second year in a row, we adapted in 2021 to find new ways of volunteering in lieu of in-person events. CITI VOLUNTEERS ADDRESSING FOOD INSECURITY 61,000+ Volunteer Engagements 37K+ Volunteer Hours 95,000+ Meals, food boxes and canned goods packed and delivered by colleagues Donated 2,500 books to children and teens in foster care (United States) Fostered the leadership skills of 138 girls through a tailor-made Junior Achievement Citi Women Leadership Award Program (Spain) 20,873 colleagues, friends, and family donated funds that provided over 177,000 meals (Mexico) More than 900 donations raised $112,000+ to support financially and socially disadvantaged youth (Singapore) 700+ Activities 81 Countries and Territories 10,000 Pounds of food collected across the United States 8,000+ Meals donated through the WFP Freerice trivia game 1,800 Boxes of food given through U.S. Hunger Pack With a Purpose 5,000+ Colleagues donated to hunger relief organizations In 2021, we put a particular focus on food insecurity and supporting organizations dedicated to fighting the hunger crisis, including the United Nations World Food Programme (WFP) and U.S. Hunger. Global Community Day was a little different this year, but the impact we made was no less meaningful. From organizing food drives to mentoring young professionals, our colleagues donated their time and talent to our communities and demonstrated once again why Citi is a bank with brains and a bank with a soul.” JANE FRASER, CEO OF CITI “ Global Community Day Contents ESGatCiti SustainableFinance SustainableProgress Equitable&ResilientCommunities Talent&DEI RiskManagement&ResponsibleBusiness Appendices CITI 2021 ESG REPORT 73
Vaccine Alliance Advisor Back in October of 2020, Gavi, the Vaccine Alliance, appointed Citi as the sole financial advisor to the COVAX Facility, a global multilateral procurement mechanism created to provide fair and equitable access to COVID-19 vaccines for every country in the world. The COVAX Facility developed a diversified, active vaccine portfolio management strategy to secure vaccine supply for all participating countries. Pooled procurement gave COVAX leverage to negotiate highly competitive prices, speedy deployment and better terms, especially for low- and middle-income countries. Since that appointment, Citi has been advising on credit, liquidity and operational and contractual risks, including planning and execution of mitigation strategies. The Facility is co-led by Gavi, the Coalition for Epidemic Preparedness Innovations and the World Health Organization. In September 2021, Citi, in conjunction with the U.S. International Development Finance Corporation (DFC), began providing a risk management solution to Gavi to enable the funding for COVID-19 vaccine purchases through the COVAX Facility. In another effort to support equitable access to COVID-19 vaccines, Citi and other leaders in the financial services sector joined CODE (RED) to help get vaccines and other vital defenses to hundreds of millions of people in the world’s poorest countries. Citi provided eligible U.S. credit card members with the option to donate their points to the CODE (RED) campaign. Citi also donated $250,000 to (RED)’s efforts. Contents ESGatCiti SustainableFinance SustainableProgress Equitable&ResilientCommunities Talent&DEI RiskManagement&ResponsibleBusiness Appendices CITI 2021 ESG REPORT 74
Affordable Housing Citi finances affordable and workforce housing in low- and moderate-income urban and suburban areas in an effort to ease the affordable housing crisis in the United States. We offer a range of housing finance solutions, including construction lending, tax credit equity and permanent financing through our balance sheet. Citi Community Capital, the bank unit through which we finance all types of affordable housing and community devel - opment projects, reported approximately $5.64 billion of lending to finance afford - able rental housing projects in 2021. In fact, for 12 consecutive years, Citi has been the No. 1 affordable housing lender in the United States, as published by Affordable Housing F inance . At Citi, being a leader in the affordable housing industry does not just mean making debt and equity capital available to expand the U.S. affordable housing supply; it also means being an innovator and market leader. Over the past several years we have worked with our clients to find new ways to lower the cost of building housing a nd i ncrease t he su pply o f h ousing for our most vulnerable populations. For example, Citi was among the first banks to provide construction loans to projects using modular, or factory-built, housing. In 2021, we provided $19.6 million in total financing for Oatsie’s Place, a new modular housing project in Los Angeles, where 45 of 46 apartments are designated for homeless women. In an effort to promote long-term housing stability, eligible resi - dents are provided with additional services to support their transitions from homeless - ness to permanent housing. Citi also recently provided a $3.89 million forward commitment for the permanent financing of Hayu Tilixam, a 50-unit apartment complex set to be built in Portland, Oregon. Through a partnership with Community Development Partners and the Native American Youth and Family Center, Hayu Tilixam will provide a welcoming and culturally sensitive home for Indigenous families and youth. All units will be reserved for residents with incomes between 30% to 50% of the area median income, and eight units will be reserved for formerly homeless residents. Residents will have access to support services, including housing stability support, culturally-specific medical, dental and behavioral health services, homeownership coaching and more. Our efforts around affordable housing are consistent with our pledge to align commu - nity engagement with SDG target 11.1 , which includes providing access for all to adequate, safe and affordable housing and basic services . SDG Goal 11: Sustainable Cities and Communities Initial rendering of the Hayu Tilixam development in Portland, Oregon. Named #1 Affordable Housing Lender in the United States by Affordable Housing Finance for the 12th Consecutive Year Contents ESGatCiti SustainableFinance SustainableProgress Equitable&ResilientCommunities Talent&DEI RiskManagement&ResponsibleBusiness Appendices CITI 2021 ESG REPORT 75
Affordable Housing Impact $5.64B Volume Lent for Affordable Housing 32,762 Total Units Financed 1,546 Buildings Financed 204 Projects Closed 110 Clients Served 28.8M Square feet $200M Equity Invested in Affordable Housing 326 Green buildings 15,819 Affordable (No other restriction) 8,673 Seniors 3,180 Rental Assistance Demonstration (RAD) 1,574 Formerly homeless 488 Special needs 208 Veteran 4 8 Rehab construction 107 New construction 33 Permanent financing 16 Acquisition HOUSING TYPES 34 States 144 Cities * AMI = Area Median Income. 2,820 Moderate Income >80% AMI 29,942 Affordable <80% AMI * Contents ESGatCiti SustainableFinance SustainableProgress Equitable&ResilientCommunities Talent&DEI RiskManagement&ResponsibleBusiness Appendices CITI 2021 ESG REPORT 76
Citi Bike Program The Citi Bike ® program has been one of our longest-running and largest-scale efforts to enhance urban quality of life. In New York City, where transportation is the second-largest driver of greenhouse gas emissions, the program has reduced an estimated 130,000 tons of CO 2 e emissions * — or the equivalent of removing 30,000 vehicles from the road for one year. This program supports SDG 11 , which aims to make cities and human settlements inclusive, safe, resilient and sustainable . The bike share program contributes to target 11.2 , which has several aims, including providing access to safe, affordable, accessible and sustainable transport systems for all . * Based on methodology from a study published in The I nternational Journal of Urban Policy and Planning . SDG Goal 11: Sustainable Cities and Communities Jersey City LAUNCHED: September 2015 TRIPS SINCE LAUNCH: 2.2M MILES TRAVELED: 2.8M ANNUAL MEMBERS: 2K Miami LAUNCHED: December 2014 TRIPS SINCE LAUNCH: 11M MILES TRAVELED: 33M ANNUAL MEMBERS: 6K New York City LAUNCHED: May 2013 TRIPS SINCE LAUNCH: 138M MILES TRAVELED: 247M ANNUAL MEMBERS: 164K Contents ESGatCiti SustainableFinance SustainableProgress Equitable&ResilientCommunities Talent&DEI RiskManagement&ResponsibleBusiness Appendices CITI 2021 ESG REPORT 77
Strategic Philanthropy Through strategic grant-making efforts, the Citi Foundation promotes economic progress in low-income communities around the world, focusing in particular on programs that increase financial inclusion, catalyze job opportunities for youth, and reimagine approaches to building economically vibrant communities. The Citi Foundation’s “More than Philanthropy” approach leverages the expertise of Citi and its people to fulfill our mission and drive thought leadership and innovation. Pathways to Progress, one of Citi and the Citi Foundation’s flagship initiatives, aims to equip young people — particularly those from underserved communities — with the skills and networks they need to succeed in today’s rapidly changing economy. Between the program’s launch in 2014 and the end of 2021, the Citi Foundation invested more than $275 million in work - force preparation globally. Through the Pathways to Progress initia - tive, Citi and the Citi Foundation support SDG target 8.6 , which aims to substan - tially reduce the proportion of youth not in employment, education or training . SDG Goal 8: Decent Work and Economic Pathways to Progress Europe, Middle East and Africa PARTNER: PresenTense PROGRAM: Hamakpetza GEOGRAPHY: Israel Through the Ha makpetza program, Citi Foundation and PresenTense support young members of the LGBTQ+ community in partnership with the Jerusalem Open House for Pride and Tolerance. This first-of-its-kind entrepreneurship program provides participants with guidance and mentorship from leading business experts and exposure to successful global and local tech companies, connecting them with the resources they need to develop their entrepreneurial ventures. Asia Pacific PARTNER: Philippine Business for Education PROGRAM: First Future 2.0 Program GEOGRAPHY: Philippines The First Future 2.0 P rogram aims to train entry- level employees, particularly those with a K-12 diploma, to progress in the workplace and land meaningful jobs in the areas of information technology, business process outsourcing, finance and retail. Last year, in partnership with the Technical Education and Skills Development Authority and University of the Philippines – Open University, the program helped more than 1,000 youth develop their professional skill sets through leadership and management courses, as well as technical trainings to improve customer service skills. North America PARTNER: Rise Asset Development PROGRAM: EnterpRISEing Youth+ GEOGRAPHY: Canada In Canada, Citi Foun dation works with Rise Asset Development to support young people experiencing mental health and other challenges, offering them opportunities to explore jobs and careers outside of the traditional corporate sector. Through the EnterpRISEing Youth+ program, Canadian youth can access a flexible online learning platform with virtual business coaching and peer support, helping them to develop their entrepreneurial skills and improve their professional, personal and financial well-being. With over 60% of participants being young people of color, the program aims to help empower the next generation of diverse entrepreneurs in Canada. Latin America and the Caribbean PARTNER: Organization of American States PROGRAM: Creating a Career Path in Cyber Security GEOGRAPHY: Argentina, Colombia, Costa Rica, Dominican Republic, Peru Through the Creating a Career Path in Cy ber Security initiative, the Citi Foundation and the Organization of American States are preparing youth in Latin America for in-demand, high-paying jobs in the technology sector. In 2021, the partnership empowered more than 200 youth across the region, providing them with the training needed to be certified as cybersecurity experts and connecting them to job opportunities. In addition to training, select students are able to complete an apprenticeship program with the Computer Security Incident Response Team Americas. Program participants have gone on to create their own technology consulting businesses or find positions with government agencies. Contents ESGatCiti SustainableFinance SustainableProgress Equitable&ResilientCommunities Talent&DEI RiskManagement&ResponsibleBusiness Appendices CITI 2021 ESG REPORT 78
COMMUNITY PROGRESS MAKERS In 2015, the Citi Foundation launched its Community Progress Makers Initiative with a vision of empowering community leaders to grow their transformative impact through unrestricted, trust-based funding. That approach and support is more important than ever as the United States continues to address the root causes and impacts of income and wealth inequality. In December 2021, the Foundation announced 50 nonprofit organizations as the newest recipients of unrestricted grants to advance social and economic opportunity for underserved communities. The $25 million grant initiative supports visionary organizations that are working to connect low-income communities and communities of color to greater social and economic opportunity in six cities: Chicago, Los Angeles, Miami, New York, San Francisco and Washington, D.C. Each Community Progress Maker will receive an unrestricted grant of $500,000 and access to technical assistance and a facilitated supportive learning community. The recipients are working on a range of social issues, including the expansion of affordable housing and access, environmental sustainability, economic development, financial health and wellness, and workforce readiness/high-quality jobs. The Foundation will provide a supportive community network through which these organizations can connect to learn from each other, share best practices and strengthen their roles as social change agents. As part of the initiative, the Citi Foundation is engaging longtime grantee Urban Institute to provide technical assistance to the cohort, helping to measure their impact and track their progress. According to a recent report from Citi Global Perspectives & Solutions , there is a growing need for multiyear, unrestricted funding, which empowers nonprofits to invest in the financial sustainability of their organization and gives them the flexibility to adapt to evolving challenges. This kind of philanthropic support is even more urgent as local communities continue to face complex challenges posed by the COVID-19 pandemic. Harlem Stage is a performing arts center that is using support from the Citi Foundation to help bridge Harlem’s cultural legacy to contemporary artists of color. Contents ESGatCiti SustainableFinance SustainableProgress Equitable&ResilientCommunities Talent&DEI RiskManagement&ResponsibleBusiness Appendices CITI 2021 ESG REPORT 79
In This Section 81 Return to Office and the Future of Work 83 Diversity, Equity & Inclusion 97 Using Our Corporate Voice to Drive Change 99 Employment Data Talent and Diversity, Equity & Inclusion Contents ESGatCiti SustainableFinance SustainableProgress Equitable&ResilientCommunities Talent&DEI RiskManagement&ResponsibleBusiness Appendices CITI 2021 ESG REPORT 80
Return to Office and the Future of Work If the pandemic taught us anything from an employee wellness perspective, it was the value of flexibility. As the situation surrounding the virus continued to evolve, we focused on how we could bring our colleagues safely back to the office. At the same time, COVID-19 opened our minds to new ways of working. While we know there are enormous benefits to being together in person, we saw just how productive and effective remote work could be. We recognized that we couldn’t go back to the way things were and that we had to adapt to new realities. After coming to understand just how important flexibility is to our current and future success as a firm, we became the first major U.S. bank to publicly embrace a hybrid model of work for our colleagues moving forward. As vaccinations became widely available in the United States, United Kingdom and other parts of the world, and where the data told us it was safe to do so, we began to bring colleagues back to the office in a hybrid model — with a minimum of two days per week in person and a few days from home. Colleagues in more than 30 locations across the U.S. returned to the office in 2021. We required colleagues returning to those sites to be vaccinated against COVID-19, wear masks and social distance wherever possible. For colleagues working in our branches, we required rapid testing and masks in 2021, and vaccination as of early 2022. Understanding there is not a one-size-fits-all approach, we adjusted our global return-to-office efforts region by region, based on local data, vaccine availability and country mandates. Equally i mportant, w e c ommunicated regularly a nd c onsistently w ith o ur colleagues — s ending m essages f rom o ur CEO a nd s enior l eaders t o k eep p eople informed o f o ur p lans t o r eturn t o t he office a nd e quipping o ur m anagers w ith resources a nd i nformation s o t hat t hey, i n turn, c ould e ffectively su pport t heir t eams and a nswer q uestions. After working from home became the “new normal” in early 2020, we listened to feedback from our employees and enacted policies to help ease the blurring of lines between home and work. In response, in 2021 we launched “Zoom-Free Fridays” for internal meetings to combat the well- recognized fatigue from virtual meetings. We asked colleagues whenever they could to designate noon to 1 p.m in local times as an hour free of calls and meetings, as well as to reduce hour-long meetings to 45 minutes to give colleagues time in between sessions. We also offered a “Reset Day” in May for colleagues to take a day off to r echarge and added several new benefits to further support work-life balance. As the pandemic persisted through 2021, we continued to put the safety, health and well-being of our colleagues first. Early on in the health crisis, we developed principles that have consistently guided our decisions, including how we returned to the office. We focused on data, not dates, took a localized approach, and were transparent with colleagues that we would continue to learn and adapt as we go. Much of our atten - tion was on creating a safe and welcoming workplace for today, while also pushing ourselves to envision new ways of working for tomorrow — a model that is more flexible, agile and collaborative. Despite the ongoing challenges of the pandemic, we continued to make progress on our commit - ments to fostering a diverse and inclusive workplace and using our corporate voice to drive change . Contents ESGatCiti SustainableFinance SustainableProgress Equitable&ResilientCommunities Talent&DEI RiskManagement&ResponsibleBusiness Appendices CITI 2021 ESG REPORT 81
The Future of Work One of the silver linings of the pandemic was that our colleagues and teams learned new and different ways of working when the virus initially closed the doors of our offices. At Citi, we felt it would be a missed opportunity if we didn’t seize the moment to reimagine the workplace once the pandemic ease s. Our CEO, Jane Fraser, boldly embraced the desire to be a bank with brains and a soul, and to break out of the traditional mindset that required our colleagues to be in the office all day, every business day. We established principles to guide our flexible, future work model and related ways of working — all with the aim to drive collabora - tion and meaningful connections, maximize apprenticeship and learning opportunities, leverage technology to our advantage, support colleague well-being and belonging, and treat our colleagues equitably. We announced this future work model will take effect after colleagues return to the office, and the model will provide hybrid, remote and resident designations for colleagues. Hybrid roles offer colleagues the flexibility to work at least three days per week in the office and up to two days from home. The majority of Citi employ - ees have been designated as hybrid. Remote roles may be performed 100% from outside the office location. Resident roles are jobs that cannot be performed remotely, such as tellers in our branches and data center employees. In 2022, we will roll out the future work model and survey employees throughout the early phases, using data to understand what is working — and what isn’t — so we can adapt where we need to. To support hybrid and remote working, we have been introducing enhanced technology and tools that enable us to be more connected and collaborative, no matter where we work. The Benefit of Time Having an opportunity to recharge or step away from work can boost job productivity and morale. In 2021, we rolled out two new programs to do just that for those who have been employed by Citi for at least five years. Our “Refresh, Recharge, Reenergize” sabbatical program allows colleagues to take up to 12 weeks away from work to pursue personal interests or education, take extended travel or simply take time off. Employees will receive 25% of their base pay, do not have to provide an explanation or reason for taking a break, and are eligible for two sabbaticals during their full tenure at Citi. In the first year of the program, which was launched in 2021, more than 200 employees began to take sabbatical. Julie Berg, Head of Product and Segment Analytics, U.S. Consumer Analytics, took advantage of the new program by driving coast-to-coast (and back again), traveling more than 10,000 miles across 24 states with her dog, Hank, as her companion. “My sabbatical was like a reboot on the computer with the ability to purge ‘cached’ information,” Berg said. “I worked with my team to prepare for time off for about 6 months to ensure all of the work was covered. I am forever grateful to them and my manager for holding the fort while I was away.” Our new, pro bono “Giving Back” program, meanwhile, allows employees to lend their time and talents at a charitable organization for two to four weeks while still receiving 100% of their Citi base pay. Julie Berg’s trusty companion, Hank, enjoying his cross-country sabbatical trip. Contents ESGatCiti SustainableFinance SustainableProgress Equitable&ResilientCommunities Talent&DEI RiskManagement&ResponsibleBusiness Appendices CITI 2021 ESG REPORT 82
Diversity, Equity & Inclusion Our workforce of more than 220,000 colleagues around the globe reflects the diverse backgrounds and perspectives of our clients and customers. This is why we ensure equity and inclusion are embedded in everything that we do. Across the firm, there is tremendous momentum to build on our efforts to create a more diverse, equitable and inclu - sive culture — from our pay equity work to our representation goals to our diverse interview panels and candidate slates to our engagement with Historically Black Colleges and Universities (HBCUs). We believe in setting clear goals to measure our progress and holding ourselves accountable to building a company where the best talent wants to work and where people of all races, gender, sexual orientation, disability status veteran status or ethnicity can reach their full potential. Our approach to diversity, equity and inclusion ( DEI) i sn’t l imited t o b roadening the representation of those working within the top levels of our own firm and creating a more inclusive environment. We also look at diversity holistically, thinking of ways to widen o ur i mpact f or o ur su ppliers, c lients, customers and communities we serve. Learn about ou r Action for Racial Equity plan to help c lose t he r acial w ealth g ap a nd i ncrease economic m obility i n t he U nited S tates. Pay Equity We continue to disclose our adjusted and u nadjusted ( or “ra w”) p ay g aps f or both women and U.S. minorities to hold ourselves accountable for making progress. The a djusted p ay g ap i s a t rue m easure o f pay equity, or “like for like,” that compares the c ompensation o f w omen t o me n a nd U.S. min orities t o n on-minorities w hen adjusting f or f actors su ch a s j ob fu nc - tion, t itle/level a nd g eography. T he ra w gap m easures t he d ifference i n m edian compensation w hen w e don ’t a djust f or a ny of t he a forementioned f actors. The e xistence o f o ur ra w p ay g ap r eflects a need t o i ncrease r epresentation o f w omen and U.S. minorities in senior and higher- paying ro les. Our l atest r esults, r eleased i n e arly 2 022, found t hat, o n a n a djusted b asis, w omen globally a re p aid o n a verage m ore t han 99% of what men are paid at Citi, and that t here w as n o s tatistically si gnificant difference i n a djusted c ompensation for U .S. min orities a nd n on-minorities. Following the review, appropriate pay adjustments were made as part of Citi’s 2021 c ompensation c ycle. The Interconnected Nature of Pay Gaps and Representation Goals Citi was the first company to disclose adj usted pay results, and in 2019 we became one of the first companies to disclose our unadjusted or “raw” pay gaps for both women and U.S. minorities. Being transparent about our median pay helped us achieve our firm-wide, aspirational representation goals in 2021. By increasing representation of women and U.S. minorities in higher-compensated roles, we can continue to work toward closing the raw pay gaps. MEDIAN PAY Women vs. Men INCREASED REPRESENTATION of women and U.S. minorities in higher- compensated roles to help close the raw pay gaps 74 % 2021 74 % 2020 73 % 2019 2018 71 % U.S. Minorities vs. U.S. Non-Minorities 93 % 2018 94 % 2019 94 % 2020 96 % 2021 FIRM-WIDE ASPIRATIONAL REPRESENTATION GOALS 37 % 40.6 % 2018 2021 8.1 % 6 % 2018 2021 Mid- and senio r- level female talent globally Exceeding 40% goal Exceeding 8% goal Mid- and senior- level Black talent (U.S. only) Contents ESGatCiti SustainableFinance SustainableProgress Equitable&ResilientCommunities Talent&DEI RiskManagement&ResponsibleBusiness Appendices CITI 2021 ESG REPORT 83
Citi’s 2021 raw gap analysis showed that the median pay for women globally is 74% of the median for men, similar to 2020 and up from 73% in 2019 and 71% in 2018; the median pay for U.S. minorities was more than 96% of the median for non-minorities, which is up from just under 94% in 2020, 94% in 2019 and 93% in 2018. Continuing to reduce our raw pay gap requires that we increase representation of women and U.S. minorities in senior roles across the firm. These pay equity reviews represent a “moment in time” snapshot of our employee base, which is constantly chang - ing as people come in and out of the firm, as colleagues are promoted and as market dynamics change. We’re continuing to innovate how we recruit and develop talent and to use data more effectively to help us increase diversity at more senior levels at Citi. Our philosophy is that every member of Citi’s team is responsible for progress in making Citi an even more inclusive and equitable workplace. Citi collaborated with The Female Quotient, a women-owned business dedicated to advancing equality in the workplace, to develop a free digital tool that provides companies with a snapshot of their raw pay gap. We view it as a way to further equity across all types of companies and see it as a concrete measure to increase diversity more broadly. For more informa - tion, v isit The F emale Q uotient’s A dvancing Equality Calculator TM . Representation Goals In 2018, we set aspirational representa - tion goals to increase women leadership globally and Black leadership in the United States at the firm by the end of 2021. We are pleased to share that Citi exceeded these goals. Globally, we increased representation at the Assistant Vice President to Managing Director levels for women to 40.6% (up from 37% in 2018), and in the United States we increased Black representation for those same job levels to 8.1% (up from 6% in 2018). Additionally, when we include colleagues in the United States who self-identify as two or more races, Black representation at the same job levels increased to 9.1%. Our commitment doesn’t stop here, and we recognize there’s still work to do to build a more d iverse, e quitable a nd i nclusive fi rm. We will build and expand on our representa - tion g oals i n t he fu ture a nd w ill c ontinue t o be t ransparent w hile h olding o urselves accountable. D iversity, e quity a nd i nclusion factors, in cluding t he r epresentation o f women a nd r acial/ethnic m inorities, c ontinue to b e i ncluded i n s enior e xecutives’ s core - cards. L earn m ore i n t he ESG at Citi section. Pipeline analyses help us assess the avail - ability and flow of diverse talent at Citi and how we can achieve better representation among women and racial/ethnic minori - ties. Such analyses also play an important role in succession planning at Citi, ensuring that we have diversity of employees who are ready for promotion now, and that we have appropriate development plans for those who would be ready for promotion in several years. Intentionality in talent development is essential if we’re going to elevate more women and racial/ethnic minorities to high-level positions at Citi — and across our industry as a whole. According to McKinsey & Company, there’s a strong business case for gender and racial diversity in corporate leadership, with the most diverse companies outper - forming their peers on profitability. A report issued by McKinsey 1 in 2020 found that companies in the top quartile for gender diversity on executive teams were 25% more likely to have above-average profitability than companies in the fourth quartile. That’s up from 21% in 2017 and 15% in 2014. Our representation goals, as well as other work we are doing around gender equality in the workplace, directly contribute to SDG 5 in support of gender equality and empowering all women and girls . Specifically, we are enabling progress toward target 5.5 , which aims to ensure women’s full and effective participation and equal opportunities for leadership at all levels of decision-making in political, economic and public life . SDG Goal 5: Gender Equality Read how we’re supporting minority- and women-owned businesses in our supply chain . 1. McKinsey & Company, “ Diversity Wins: How Inclusion Matters ” May 2020. Contents ESGatCiti SustainableFinance SustainableProgress Equitable&ResilientCommunities Talent&DEI RiskManagement&ResponsibleBusiness Appendices CITI 2021 ESG REPORT 84
A Roadmap for Black Equity In November 2021, we announced our participation in the Management Leadership for Tomorrow (MLT) Black Equity at Work Certification — a first-of-its-kind standard and roadmap for employers that want to achieve Black equity internally while support - ing Black equity in society. Citi was the first major Wall Street bank to sign on. Our participation complements our Action for Racial Equity efforts, including our commitment to conduct a third-party racial equity audit. (Learn more in the Equitable and Resilient Communities section.) MLT’s unique accreditation program calls on corporations to take a stand for Black equity and provides a critical resource for employers to make progress toward their Black equity goals. Through our participation in this program, Citi will receive MLT’s expertise, counsel and feedback on our internal Black equity initiatives and practices, including how we can increase Black representation, drive equal pay and invest in Black equity causes. The validation process will help Citi develop a robust, comprehensive plan that will enable us to achieve a Black Equity at Work Certification in one to three years. DIVERSITY AT THE EXECUTIVE LEVEL Gender equity is something we demonstrate from the very top of our organization. Jane Fraser is our first woman CEO — and was the first woman to lead a major Wall Street bank. Based on existing self-identification data, five (29%) of our 17-person Executive Management Team are women and six (35%) are racially/ethnically diverse. As of April 25, 2022, eight (53%) of the 15 members of our Board of Directors are women and three (20%) are racial/ethnic minorities. Citi was among the first financial services firms to achieve gender parity on its Board. Contents ESGatCiti SustainableFinance SustainableProgress Equitable&ResilientCommunities Talent&DEI RiskManagement&ResponsibleBusiness Appendices CITI 2021 ESG REPORT 85
Recruit, Retain and Promote We are committed to continue building a team that is inclusive and representative of our customers and clients. To make progress, we have been evolving the way we bring new colleagues into Citi, including accelerating the use of diverse slates in our recruiting and deepening our capabilities to measure o ur su ccess. In 2021, we expanded the use of diverse slates in our recruiting to have at least two women and/or U.S. minorities in our inter - views for U.S. hires and at least two women in our interviews for global hires. These include candidates at various senior levels, from Assistant Vice President to Managing Director. As of December, nearly 75% of roles that were posted globally included a diverse slate of candidates with at least two women and/or two U.S. minorities. In 2021, we launched a Diversity Sourcing team in the United States to consistently identify diverse talent in the marketplace and accelerate our hiring of diverse talent. We have expanded engagement with exter - nal p artners, i ncluding di versity p rofessional organizations. T hese r elationships h ave enhanced our ability to attract and hire mid- to s enior-level t alent de monstrating C iti’s inclusive cu lture. Campus Recruiting Our campus recruiting program is another important way for us to diversify our employee base, and we have a robust pipeline of talent from HBCUs and other leading universities. • Our Citi ® University Partnerships in Innovation & Discovery (CUPID) Program enables us to accelerate inno - vation projects across Citi by engaging diverse students and developing a robust, diverse pipeline of talent from leading universities (see callout above). • In 2021, we held our third annual HBCU Innovation and Leadership Symposium , which brought together 42 first- and second-year students (58% first years and 32% sophomores) from 15 HBCUs for an introductory, virtual experience focused on helping them understand financial services, gain technical skills and kick off the career-planning process. While we would like the students to consider the possibility of a future with Citi, our primary goal is to provide them with helpful tools on their path to profes - sional success, without regard for industry or profession. • Our Early Insights Programs for college students in their first and second years of undergraduate studies are focused on identifying, mentoring and hiring top diverse talent for summer analyst programs across the firm. These programs provide early exposure to, and education around, Citi’s businesses, technical training, mentorship and culture. • Our Freshman Discovery Day is a two-day exploratory program that helps educate underrepresented minority college freshmen about the various roles in financial services. MILITARY OFFICER LEADERSHIP PROGRAM Our Military Officer Leadership Program (MOLP) focuses on recruiting, developing, training and preparing transitioning service members for mid- to senior-level leadership roles at Citi. Over a two-year time period, candidates rotate three times, giving them a peer network of mentorship and support and a path to a successful career at Citi. “As a former combat veteran, with no direct experience in the financial industry, the MOLP was a great opportu - nity,” said Rob Carter, a graduate of the program who has been with Citi for about five years. “The exposure to different businesses allowed me to find an area within the firm that leveraged the skills I developed during my time in the Army,” says Carter, Senior Vice President in Human Resources and one of the more than 2,400 U.S. employees who have disclosed their veteran status to us. CUPID BY THE NUMBERS The Citi ® University Partnerships in Innovation & Discovery (CUPID) Program embeds students from top universities in innovation activities across Citi. CUPID students — many of them underrepresented minorities — gain exposure to various aspects of our business and help us develop a robust, diverse pipeline of talent. Since we launched CUPID in 2017, we have: • Engaged 3,600+ students and early career professionals • Hired 202 CUPID participants • Hired 43 HBCU students • Worked with 90 colleges and universities, including 38 HBCUs • Hosted 40 events, such as hackathons, competitions and symposiums Contents ESGatCiti SustainableFinance SustainableProgress Equitable&ResilientCommunities Talent&DEI RiskManagement&ResponsibleBusiness Appendices CITI 2021 ESG REPORT 86
• Our Early Identification Program focuses o n m entorship, in terview preparation a nd b est-in-class t raining to id entify di verse t alent f or o ur summer a nalyst p rograms o ver a five-week p eriod. • Sophomore Leadership Program provides h ands-on w ork e xperience, mentorship, p eer n etworking a nd necessary s kills o ver a 1 0-week su mmer internship, t o p rovide a p ipeline in to o ur full-time a nalyst p rograms. We continue to partner with Jopwell, MLT, SEO and WayUp, U.S.-based recruiting platforms that attract diverse students, enabling our recruiters to communicate and engage with students to promote job opportunities. We were also honored to receive the Diversity, Equity and Inclusion Award and received an Honorable Mention for Recruiting Excellence from the National Association of Colleges and Employers. Developing Diverse Talent Hiring, promoting and retaining more women and racial/ethnic minorities in senior, high-paying roles is critical to our success — and key to helping solve the two-pronged issue of representation and pay equity. Career development is one of our top priorities, and we promote from within to continue developing our existing talent. In 2021, 41% of open positions at Citi were filled with internal candidates. “Owning My Success” (OMS), for example, is a group coaching program for Black colleagues that provides exposure to Citi’s senior leadership and supports professional and personal development. More than 700 Black colleagues have participated in OMS since the program began in 2018. Over the course of several months, participants join group coaching circles, led by an external executive coach and a senior leader at Citi. Managers of the participants also take part in group coach - ing to better understand the experience of Black colleagues in the workplace. Representation in Our Analyst and Associate Programs ASPIRATIONAL GOAL: 50% women globally for our analyst and associate programs ASPIRATIONAL GOAL: 30% Black and Hispanic/Latino in the United States for our analyst and associate programs Women representation in full-time analyst and associate roles Black and Hispanic/Latino representation in full-time analyst and associate roles Women representation in the summer analyst and associate programs Black and Hispanic/Latino representation in the summer analyst and associate programs 18 % 2019 45 % 2019 25 % 2019 47 % 2019 29 % 2021 52 % 2021 32 % 2021 52 % 2021 ACHIEVED ACHIEVED ACHIEVED CITI ON THE VINEYARD RECRUITMENT Following a successful recruitment event in 2019, Citi held a second recruitment event on Martha’s Vineyard in Massachusetts for Black students to network with industry professionals and learn about potential career paths in financial services. In total, 20+ college students and 12 high school students attended the August 2021 event. Two of the college students were selected for our Early ID Leadership Program, and we’re inviting the high school students to return to future programming. CITI INTRODUCTION TO FINANCE More than 1,000 people attended a virtual event in August geared toward mid- to senior-level Black talent. Our CFO Mark Mason and Chief Diversity, Equity and Inclusion Officer Erika Irish Brown discussed their respective careers in finance. Several participants in the event interviewed for positions across the team. Contents ESGatCiti SustainableFinance SustainableProgress Equitable&ResilientCommunities Talent&DEI RiskManagement&ResponsibleBusiness Appendices CITI 2021 ESG REPORT 87
Citi Personal Banking & Wealth Management and our Risk and Controls group each piloted advocacy programs for underrepresented talent in 2021, pairing participants with senior leaders to offer career advice and support. Black Leaders for Tomorrow, an initiative within the Institutional Clients Group, also offers an Advocacy program for Black directors. More than 600 Black employees each year participate in one of five programs offered through Black Leaders for Tomorrow. We also launched the Black Managing Director E ngagement i nitiative, a q uar - terly small group gathering of Executive Management Team members and Black Managing Directors who get to know each other, share ideas on ways to enhance Citi’s strategy a nd d iscuss o pportunities f or personal a nd p rofessional g rowth. Our R ole-Based A ssessment P rogram, meanwhile, f ocuses on b uilding a r obust succession p lan f or o ur B lack a nd w omen leaders. T he c areer de velopment p rogram includes executive assessment and coach - ing. In 2021, 31 high-performing Black and women M anaging Di rectors a nd Di rectors were s elected f or t he p rogram. We p rovide a ra nge o f i nternal d evelopment and r otational p rograms f or l eaders a t a ll levels, and we continued to evolve our learn - ing p rograms t o m eet n ew n eeds. O ur C iti Women’s L eadership D evelopment P rogram was held remotely in 2021, bringing together a g roup o f S enior V ice P residents a nd Directors f rom a round t he w orld t o n etwork and d evelop l eadership ski lls. In Latin America, our Women’s Virtual Development P rogram c ontinues t o b e o ne of our most valued in the region, with more than 1,600 participants in 2021. Across Asia P acific, 7 80 p articipants j oined o ne o f four p rograms su pporting w omen a s t hey transition t o m ore s enior r oles. A nd i n E urope, for o ur “r everse m entoring” p rogram, w e paired s enior l eaders f rom t he r egion w ith junior mentors from the LGBTQ+ community. The g oal o f t he p rogram, w hich w as su bse - quently r olled o ut i n L atin A merica, A sia Pacific and the United States, was to educate the mentees about the lived experience of their LGBTQ+ colleagues. To better support our colleagues with disabilities, we made enhancements to our tools and resources to build a more inclusive workplace, including a strong team of doctors, digital accessibility experts and accommodations specialists. The Global Consumer Technology team launched a partnership with Neurodiverse Solutions (formerly Autism2Work), and in May 2021, the team added five contractors who have autism spectrum disorder, or ASD, to the Global Consumer Bank ATM team based in our Florence, Kentucky, ATM Lab. After seeing such strong results in just six months, the Neurodiverse Solutions program has expanded across Citi with 12 contractors and plans to grow the team to 50 contractors by the end of 2022. Citi recently began a partnership with Disability:IN, a global nonprofit resource for disability inclusion. Disability:IN partners with over 400 companies worldwide with the vision to create an inclusive global economy where people with disabilities participate fully and meaningfully. PARTNERSHIP WITH THE EXECUTIVE LEADERSHIP COUNCIL We invest in career development and planning for diverse talent through mentorship, networking, rotational programs and partnerships, such as our longstanding relationship with The Executive Leadership Council (ELC). In 2021, we signed a million-dollar, multiyear agreement with ELC to enhance our investment in Black leadership and establish a cohesive development journey and continuum for Citi’s Black leaders. Through this partnership, Citi plans to help develop 850 mid- to senior-level employees over three years. The program is focused on Black colleagues at the Assistant Vice President through Managing Director levels who are tapped for further development at Citi. The intent is to invest in their continued professional growth and mobility by providing personalized coaching and greater exposure to senior-level leaders. The Black Women at Citi Power Panel, presented by Black Women at Citi and Citi Inspires, was a successful hybrid event in 2021, with 3,300 colleagues tuning in. A panel of senior Black women at the firm discussed mental health, work/life balance, self-advocacy, building community, sponsorship and career development. Following the panel, our Chief Diversity, Equity and Inclusion Officer and Global Head of Talent, Erika Irish Brown, hosted a fireside chat with Grammy-award winner Gladys Knight. Contents ESGatCiti SustainableFinance SustainableProgress Equitable&ResilientCommunities Talent&DEI RiskManagement&ResponsibleBusiness Appendices CITI 2021 ESG REPORT 88
2021 Managing Director Diversity Citi promotes a new class of Managing Directors (MD) each year. This is the highest officer level at Citi and is a testament to these individuals’ performance and commitment to living our Leadership Principles —Taking Ownership, Delivering With Pride and Succeeding Together — and instilling them throughout their teams and the entire firm. For our 2021 class, we promoted 306 MDs, who are based in 30 countries and represent one of the largest and most diverse classes in recent years. SUMMARY BY GEOGRAPHY SUMMARY BY YEAR The most women promoted in recent years Highest representation in recent years 106 in 2021 1 Veteran 36 % 70 in 2020 62 in 2019 49 in 2018 49 in 2017 241 in 2020 220 in 2019 198 in 2018 178 in 2017 30 countries in 2021 6 LGBTQ+ UNITED STATES 53 racial/ethnic minorities (out of the 150 promoted) 35.3 % of the new MD class was ra cially/ethnically diverse 19.3% 29 Colleagues ASIAN 2.7% 4 Colleagues BLACK 14.0% 21 Colleagues HISPANIC/LATINO Largest class in recent years Average Tenure 12.4 Years 306 Promotions in 2021 52 17 % ASIA PACIFIC 18 5.9 % LATIN AMERICA 86 28.1 % EUROPE, MIDDLE EAST AND AFRICA 150 49 % NORTH AMERICA 1 Person with a disability Contents ESGatCiti SustainableFinance SustainableProgress Equitable&ResilientCommunities Talent&DEI RiskManagement&ResponsibleBusiness Appendices CITI 2021 ESG REPORT 89
Most Powerful Women in Banking Awards Eight senior leaders at Citi were recognized among American Banker’s 2021 “Most Powerful Women” rankings. Citi was also recognized as one of the top teams overall. Most Powerful Women in Banking Most Powerful Women to Watch Most Powerful Women in Finance INDIVIDUAL AWARDS TEAM AWARD Jane Fraser Chief Executive Officer Mary McNiff Chief Compliance Officer Titi Cole CEO, Legacy Franchises Gonca Latif-Schmitt Managing Director and Head of Global Commercial Card Business Julie Monaco Global Head of Public Sector, Banking, Capital Markets and Advisory Ida Liu Global Head, Citi Private Bank Maria Hackley Global Co-Head Industrials, Banking, Capital Markets and Advisory Christina Mohr Managing Director and Vice Chair, Global M&A Standouts Vanessa Colella * Head of Citi Ventures and Citi Productivity, and Chief Innovation Officer for Citigroup Jane Fraser Chief Executive Officer Bola Oyesanya Managing Director, Private Banker Brandee McHale Head of Citi Community Investing and Development and President of Citi Foundation Bridget Fawcett Global Co-Head of the Sustainability & Corporate Transitions Investment Banking Chinwe Esimai Managing Director, Global Marketing Integration Donna McNamara Global Head of Trade Product Commercialization and ESG Strategy Elinor Hoover Chair of Global Consumer & Retail Investment Banking Elree Winnett Seelig Head of ESG, Markets Gina Nisbeth Director, Citi Community Capital Harlin Singh Head of Sustainable Investing for Private Bank Jessica Roos Global Head of Business Services Jo-Anne Kelly Managing Director and Global Head of Employment Law Karen Peetz Chief Administrative Officer Mary McNiff Chief Compliance Officer Nikki Darden Director, Global Consumer Marketing Pam Habner Head of U.S. Branded Cards and Unsecured Lending Sara Wechter Global Head of Human Resources Titi Cole CEO, Legacy Franchises Val Smith Chief Sustainability Officer * Collella has since left the firm. Contents ESGatCiti SustainableFinance SustainableProgress Equitable&ResilientCommunities Talent&DEI RiskManagement&ResponsibleBusiness Appendices CITI 2021 ESG REPORT 90
Inclusion Inclusive practices and policies lead to improved business performance and a company culture where employees feel welcome, safe and respected, and where they can focus on their work without fear of prejudice or discrimination. We work hard to establish a strong DEI foundation for the company at all levels, creating paths for the next generation of leaders across every dimension of diversity. We want all of our colleagues to feel empowered to share all aspects of their identity so that we may continue to honor what makes them diverse and unique while also strengthening a culture that values and promotes diverse perspectives. Core to our data-driven approach is gaining better understanding of how our employees self-identify so that we can better meet their needs. In 2021 we launched a global Self-ID campaign to nearly 190,000 employees (90% of our workforce), who were invited to self-identify their race and ethnicity, gender identities, sexual orientation, disability status and military status, as permissible by local laws and regulations in the 46 countries we survey. For 2021, we expanded the sexual orientation dimension from 15 to 34 countries and the race and ethnicity dimension from 18 to 31 countries. Additionally, we continued to encourage the reporting of multiple races/ ethnicities for those employees who self- identify as such by enabling the selection of specific races/ethnicities. We achieved a response rate of nearly 100% for global gender and U.S. race/ethnicity. See our employment data for more infor - mation about our workforce composition. Members of the Citi Women’s Network at the closing bell of the New York Stock Exchange marking the 2022 International Women’s Day. Contents ESGatCiti SustainableFinance SustainableProgress Equitable&ResilientCommunities Talent&DEI RiskManagement&ResponsibleBusiness Appendices CITI 2021 ESG REPORT 91
Our Employee Networks in Action: 2021 Our Employee Network chapters serve as local representatives of our Affinities. Initiated and led by colleagues at our work sites, the Networks offer professional development, mentoring, networking and community engagement opportunities to members and colleagues. Consistent with our inclusive culture, Employee Network chapters are open to all Citi employees, regardless of whether they identify with a particular Affinity. Each of our nine Affinities is co-led by a member of our CEO’s leadership team. The number of our global Employee Network chapters increased from 198 in 2020 to 226 in 2021, while the total number of unique members in the groups increased from 21,420 to 26,950 globally . The following are some examples of our colleagues’ experiences from participating in our Affinities. I always feel my intersectionality being a woman, an Asian and an immigrant is celebrated at Citi, and my perspectives are valued by my co-workers. I received overwhelming support from our senior leaders when I first approached them with the idea to initiate an Asian Heritage Network in Canada. Working remotely and separated from families during the pandemic have been very challenging for many in the Asian communities, who experienced or witnessed race-based abuse, hate and even violence. Citi’s Affinity networks have created a safe space for us to share emotions and offer support to each other. Being able to support my community at work adds a sense of purpose and belonging for me.” In addition to learning even more about my own culture as a part of the Black Heritage Network, I have also been able to expand my network, increase my exposure to Citi leaders and focus on career development through many of the lessons learned from the network’s events and sessions. This is also true regarding all of the employee networks sponsored by Citi. Citi truly exemplifies a diverse, equitable and inclusive culture through the Employee Network program and through the act of investing in cultures and communities within and beyond our Citi walls.” Asian Heritage Black Heritage STELLA YU, TORONTO SENIOR VICE PRESIDENT, HUMAN RESOURCES KATRINA GERALD, CHARLOTTE, N.C. SENIOR VICE PRESIDENT, PERSONAL BANKING & WEALTH MANAGEMENT “ “ A veteran Citi employee, who is now my mentor, reached out to me when I was in college and helped me get my foot in the door at Citi. That kindness toward veterans really resonated with me, and I immediately began getting involved with Citi Salutes and North America Service Initiative groups. I started off small by taking on volunteer responsibilities such as our USO Bike Build and Thank You Card events, and with each new opportunity I was able to meet so many unique people who also wanted to help veterans. I am proud to serve as the Citi Salutes New York Chapter co-chair and always look forward to working with our other New York-based networks.” Citi Salutes ® GRAHAM LEWIS, NEW YORK ASSISTANT VICE PRESIDENT, INSTITUTIONAL CLIENTS GROUP “ Contents ESGatCiti SustainableFinance SustainableProgress Equitable&ResilientCommunities Talent&DEI RiskManagement&ResponsibleBusiness Appendices CITI 2021 ESG REPORT 92
Our Employee Networks in Action: 2021 (continued) Citi Women Networks in Asia had a momentous year with many key initiatives and successful program launches. For example, here in China we launched a maternity buddy program that received overwhelmingly positive reviews from those who participated. We also partnered with other networks to lead November Gratitude Month, where we sent out 8,000 thank you cards to employees and staff, building on our already strong sense of community and showcasing our leadership principle of ‘We Succeed Together.’ Citi Women has brought tremendous value to my own experience and to Citi overall by creating an inclusive culture for women to thrive.” The Networks have the incredible mission to not only act upon the specific themes of each of the diversity groups, but also to expand the overall engagement and awareness among our population — creating an environment for empathy, connection and ‘call to action.’ In that sense, Families Matter provides us the amazing opportunity to work across Affinities: learning, supporting and acting together, especially in a moment when work, home and families are more intertwined than ever before. Understanding the realities and particularities of our diverse team and acting together with other Affinities allows us to support our Citi family.” I was originally approached to join London Disability Network in 2006 and found a fantastic group of folks looking to ensure that anyone with a disability, injury or illness felt that they had a voice. I went on to serve as co-chair for the London Disability Network on two occasions, where I believe we enhanced representation, engaged with senior management and weaved Inclusion into the business conversation. I am a firm believer that as an employee I need to set an example on how, with the right level of support from my amazing managers over the years, I was able to grow my career and begin to ask not what Citi can do for me, but what can I do for Citi and the disability community. I have been working with various groups and technology experts to raise the understanding on how assistive technology enables inclusion. By being myself, I have allowed my managers to be their very best for me, and together we can work on what we need to do to support our clients.” I have been with the firm for almost a decade, and I am really proud of how we have stepped up in recent years to strategize on diversity, equity and inclusion efforts to create an inclusive culture at Citi. Our colleagues who participated in Network initiatives continuously share feedback that they experience great value and learnings from our content. I am especially fond of sessions where safe spaces are created to speak up. Inviting people to talk about topics relating to diversity, equity and inclusion increases awareness so we can break down barriers and enable people to be comfortable with certain topics. This helps create an understanding of the role we can all play in supporting one another.” Citi Women Families Matter Disability Generations LU SHI, CHINA MANAGING DIRECTOR, RISK LUCIANA ZONZINI, BRAZIL MANAGING DIRECTOR, BANKING, CAPITAL, MARKETS AND ADVISORY PATRICK MORAN, UNITED KINGDOM DIRECTOR, OPERATIONS TECHNOLOGY NUR’I LIM, MALAYSIA VICE PRESIDENT, INDEPENDENT COMPLIANCE RISK MANAGEMENT “ “ “ “ Contents ESGatCiti SustainableFinance SustainableProgress Equitable&ResilientCommunities Talent&DEI RiskManagement&ResponsibleBusiness Appendices CITI 2021 ESG REPORT 93
Our Employee Networks in Action: 2021 (continued) I raised my hand to be part of the Hispanic/Latino Heritage network shortly after joining Citi in 2018 as a Senior Executive Assistant. I hadn’t met many colleagues who looked like me in my office, and the Network has provided me with a sense of community. Working closely with our Hispanic/ Latino Affinity leadership on a membership drive initiative, the group I began to work with brings co-chairs from all of our 11 chapters in the United States and United Kingdom together on a monthly cadence, where we exchange ideas collectively. This leadership role has allowed me to hone my public speaking and presentation skills, as well as pursue opportunities to develop a network of connections I wouldn’t have otherwise encountered. I’m certain it has prepared me for my role as a recently promoted Assistant Vice President.” The value I’ve gotten from the Pride Network is the ability to see not only tangible and measurable results from our network’s projects as we progressed, but also the positive and proactive feedback from folks who have benefited from our efforts. Hearing from both senior leaders and LGBTQ+ people on their beneficial experiences and how this has impacted their work lives has made all the difference. Being able to connect with colleagues from other regions, learn from each other and work together has been a great experience. Specifically, being able to lead the Citi SpeakOUT project with other colleagues from North America and Latin America has been one of the best experiences I’ve had at Citi. Providing access to opportunities for development, such as the Out & Equal Summit and the LGBTQ+ Development Program, are just some of the many ways we support one another. ” Hispanic/Latino Heritage Pride ARLET BALTAZAR, CHICAGO ASSISTANT VICE PRESIDENT, MARKETING OPERATIONS, PERSONAL BANKING & WEALTH MANAGEMENT JOSEPH HERNANDEZ, MEXICO VICE PRESIDENT, TRANSFORMATION OPERATIONS “ “ South Africa has a unique history rooted in racial inequities. The goal of the network is to create a safe space for employees to have open and transparent discussions on the topic of race without fear of retribution. The network is employee-led. Since launching in early 2021, it has already hosted several workshops and events with the goal of providing employees with the correct tools to assess and address situations involving racial matters.” Roots MEGS NAIDU, SOUTH AFRICA VICE PRESIDENT, COMPLIANCE GOVERNANCE “ Contents ESGatCiti SustainableFinance SustainableProgress Equitable&ResilientCommunities Talent&DEI RiskManagement&ResponsibleBusiness Appendices CITI 2021 ESG REPORT 94
Employee Network Listening Tour In 2021, we held our first ever “Voice of the People” listening tour to help us understand what our Affinities mean to our colleagues. More than 800 Citi employees attended in-person and virtual sessions to share their views on our Affinity Networks and to offer ideas about what we can do to make them more impactful. More than 80% of participants said they joined one of the Affinities for networking opportunities. OVERVIEW Goal Learn about the DEI issues that are most important to you KEY TAKEAWAYS ADDITIONAL FEEDBACK: WHAT OUR COLLEAGUES ARE ASKING FOR 4 Regions 82 % 78 % 68 % 10 Networks 11 Sessions 800 Colleagues 82% cited learning from and supporting colleagues as their top reasons for joining Network 78% believe senior leaders are committed to advancing DEI across the firm 68% cited educating managers on DEI goals and senior leader advocacy as the top two ways Citi can create a more inclusive culture SENIOR LEADERSHIP ROUNDTABLES AND QUARTERLY TOWNHALLS TO UNDERSTAND DEI STRATEGY MORE MENTORSHIP/ SPONSORSHIP OPPORTUNITIES More diverse interview panels Greater global connectivity REPRESENTATION GOALS FOR MORE GROUPS More visibility of self-identifying senior leaders BETTER COMMUNICATION ON AFFINITY STRATEGY Improved alignment between networks and Affinities INCREASED MIDDLE MANAGEMENT SUPPORT FOR DEI INITIATIVES Year-end performance analysis for diverse groups Contents ESGatCiti SustainableFinance SustainableProgress Equitable&ResilientCommunities Talent&DEI RiskManagement&ResponsibleBusiness Appendices CITI 2021 ESG REPORT 95
Voice of the Employee Our annual Voice of the Employee (VOE) survey provides valuable insights regarding employee engagement and perceptions about our firm — our successes as well as our pain points. In 2021, participation was high — 87% of colleagues globally responded. We heard employees are embracing the Leadership Principles we rolled out in March, with all three principles approaching 90% favorability. Overall, 91% of employees said they are proud to work for Citi and felt that our commitments to an ethical culture and diversity are strong. Nearly 90% of employees said their managers promote diversity, equity and inclusion on their teams. But many colleagues are looking for their managers to provide greater support in their career development — a perennial area for improvement across the firm. While colleagues gave us high marks for our response to COVID-19, employees shared they are feeling the strain of life during the pandemic and increased workloads. These feelings were especially acute among our women colleagues. Their responses have reaffirmed the importance of our efforts, and we will continue to address this feedback to help relieve stress, simplify our working processes, develop tools for collaboration and ensure that our managers continue to support their people. 2021 Survey Highlights LIVING OUR LEADERSHIP PRINCIPLES COVID-19 RESPONSE Citi is effectively communicating its plans and response to COVID-19 91 % 92 % My team prioritized the work that helps Citi succeed 89 % My manager promotes diversity, equity and inclusion in our team Diversity 2020 86% 2019 81% 85 % Engagement 2020 82% 2019 74% 79 % Ethical Culture 2020 91% 2019 89% 91 % Manager Effectiveness 2020 84% 2019 81% 84 % We Take Ownership 88 % We Deliver With Pride 89 % We Succeed Together 86 % CORE INDICES Contents ESGatCiti SustainableFinance SustainableProgress Equitable&ResilientCommunities Talent&DEI RiskManagement&ResponsibleBusiness Appendices CITI 2021 ESG REPORT 96
Using Our Corporate Voice to Drive Change At Citi, we believe we can use our power as a global bank to effect social change, and we continue to take a stand on a wide range of issues, such as racial and pay equity, immigration, gun violence and climate change. We also believe it’s important to speak up and speak out on issues that impact our colleagues. For e xample, i n t he U nited S tates i n 2 021, there w as a n a larming r ise i n b ills p roposed at t he s tate l evel t hat w ould s ingle o ut LGBTQ+ i ndividuals f or e xclusion o r di ffer - ential t reatment. L egislation p romoting discrimination c ould n egatively im pact o ur colleagues a nd t heir f amilies, a s w ell a s o ur clients, c ustomers a nd o ur b usiness. I n M ay, Citi s igned t he Human R ights C ampaign’s Business S tatement O pposing An ti-LGBTQ+ State L egislation , r eiterating o ur b elief that a ll p eople h ave a fu ndamental r ight to e quality a nd o ur o pposition t o h armful legislation a imed a t r estricting t he a ccess of LGBTQ+ people in society. Citi has a long history of outspoken advo - cacy for the LGBTQ+ community. In 2020, Citi became the first major bank to provide transgender and nonbinary customers with the ability to have account profiles and credit cards that match their chosen first name. Since the initial launch, more than 18,000 consumers have updated their Citi U.S. branded credit cards with their chosen name. Learn more in the Serving Our Customers and Clients Responsibly s ection. When members of the Asian American and Pacific Islander (AAPI) community endured rising instances of violence in response to the pandemic, our Executive Management Team condemned the xeno - phobia while voicing support for our AAPI colleagues and the broader community. We also held internal listening sessions and hosted community forums to show our support for our employees. Watch a public service message we produced. We hosted a “Hollaback Bystander Intervention” training, which is designed to provide colleagues with practical tactics on how to intervene in a safe way if they witness an incident in public. In 2021, we hosted three sessions, and more than 500 colleagues joined the training. We plan to host addi - tional sessions in 2022. We also expanded our partnership with Ascend, a non-profit organization focused on professional development of the AAPI community, and sponsored the Ascend National Convention week, which more than 200 colleagues attended. Furthermore, Citi was one of many U.S. businesses that condemned efforts in 2021 to restrict voting access in the state of Georgia. We opposed voting restriction laws because we believed it would “under - mine the ability of Americans to avail themselves of this fundamental right.” For 17 consecutive years, Citi has received a perfect score on the Human Rights Campaign Foundation’s Corporate Equality Index, a national survey that benchmarks corporate policies and practices for LGBTQ+ workplace quality. MARKING HOLIDAYS OF SIGNIFICANCE Starting in 2022, we have a new paid holiday for U.S. employees: Juneteenth Day, a federal holiday that marks the end of slavery. We also had the opportunity to be more inclusive and acknowledge Indigenous Peoples Day in addition to Columbus Day. In 2020, Citi implemented one additional floating holiday called Heritage Day, which employees can take at any time to honor a day of personal signficance. Contents ESGatCiti SustainableFinance SustainableProgress Equitable&ResilientCommunities Talent&DEI RiskManagement&ResponsibleBusiness Appendices CITI 2021 ESG REPORT 97
Fair Employment Practices We strive to maintain an environment in which development opportunities are widely available, where people are hired and advanced on their merits and where our employees treat each other with respect. We are fully committed to equal employment opportunities, fair employment practices and nondiscrimination. For more information, see the Human Rights section of this report, our Code of Conduct and our website for policies around fair employment and compensation . More information can also be found in the GRI Index of this report. Members of our Pride Affinity ringing the bell at the New York Stock Exchange during Pride Month in June 2021. Contents ESGatCiti SustainableFinance SustainableProgress Equitable&ResilientCommunities Talent&DEI RiskManagement&ResponsibleBusiness Appendices CITI 2021 ESG REPORT 98
Employment Data TOTAL EMPLOYEE HEADCOUNT NEW EMPLOYEE HIRES EMPLOYEE TURNOVER EMPLOYEES BY GENDER IN THE U.S. EMPLOYEES BY GENDER 223,449 Total Employees 46,907 Total 32,769 Total 66,586 ** Total 220,975 Full-Time 2,474 Part-Time 46,050 Full-Time 857 Part-Time 31,836 Full-Time 933 Part-Time 34,993 Women 31,574 Men 113,045 Women 110,275 Men 223,449 * Total Employees TOTAL EMPLOYEES BY REGION * 129 people did not disclose. ** 19 people did not disclose. North America 68,827 Total Employees 11,102 Employee Turnover 13,400 Employee Hires Europe, Middle East and Africa 32,703 Total Employees 3,974 Employee Turnover 6,536 Employee Hires Latin America 48,693 Total Employees 7,337 Employee Turnover 11,589 Employee Hires Asia Pacific 73,226 Total Employees 10,356 Employee Turnover 15,382 Employee Hires Contents ESGatCiti SustainableFinance SustainableProgress Equitable&ResilientCommunities Talent&DEI RiskManagement&ResponsibleBusiness Appendices CITI 2021 ESG REPORT 99
Women Men 66,586 * Total Employment Data (continued) Racial/Ethnic Composition of U.S. Employees * 1,316 people did not disclose race/ethnicity. ** 1 person identified as Hispanic or Latino but did not disclose gender, and 1 person identified as Two or More Races but did not disclose gender. American Indian or Alaskan Native 105 | 73 Asian 5,446 | 6,916 Black or African American 4,608 | 2,528 Hispanic or Latino ** 6,934 | 5,067 Two or More Races ** 492 | 404 White 16,778 | 15,791 Native Hawaiian or Pacific Islander 80 | 46 Contents ESGatCiti SustainableFinance SustainableProgress Equitable&ResilientCommunities Talent&DEI RiskManagement&ResponsibleBusiness Appendices CITI 2021 ESG REPORT 100
Citi 2021 Consolidated U.S. Employer Information Report (EEO-1) Table A Advocacy Statement and Multiple Identity Breakdowns While certain regulatory reports such as our EEO-1 filings will continue to require that each Citi colleague be designated as shown in Table A, our internal tracking has evolved to appropriately capture the reality of who our people are, as detailed on the following page in Table B. Job Categories Gender Hispanic or Latino White Black or African American Native Hawaiian or Pacific Islander Asian American Indian or Alaskan Native Multi- Racial Total Executive/Senior Officials and Managers Male Female Subtotal 6 6 12 49 30 79 4 5 9 0 0 0 13 3 16 0 0 0 1 0 1 117 First/Mid Officials and Managers Male Female Subtotal 886 817 1,703 4,191 2,904 7,095 346 431 777 8 7 15 1,905 872 2,777 14 10 24 51 57 108 12,499 Professionals Male Female Subtotal 1,892 1,882 3,774 6,908 5,870 12,778 1,230 1,465 2,695 19 19 38 3,998 2,952 6,950 33 20 53 141 180 321 26,609 Technicians Male Female Subtotal 47 27 74 53 66 119 25 10 35 0 0 0 13 14 27 0 0 0 2 1 3 258 Sales Workers Male Female Subtotal 1,118 1,208 2,326 2,556 1,257 3,813 271 324 595 10 14 24 820 1,019 1,839 8 11 19 58 44 102 8,718 Administrative Support Workers Male Female Subtotal 1,226 3,160 4,386 2,729 7,209 9,938 688 2,513 3,201 14 40 54 328 751 1,079 24 66 90 65 198 263 19,011 Craft Workers Male Female Subtotal 3 0 3 3 0 3 0 0 0 0 0 0 0 0 0 0 0 0 0 0 0 6 Operatives Male Female Subtotal 0 0 0 2 4 6 0 0 0 0 0 0 0 0 0 0 0 0 0 0 0 6 Laborers and Helpers Male Female Subtotal 0 0 0 0 0 0 0 0 0 0 0 0 0 0 0 0 0 0 0 0 0 0 Service Workers Male Female Subtotal 2 0 2 0 2 2 1 1 2 0 0 0 0 0 0 0 0 0 0 0 0 6 Total Male Female Subtotal 5,180 7,100 12,280 16,491 17,342 33,833 2,565 4,749 7,314 51 80 131 7,077 5,611 12,688 79 107 186 318 480 798 67,230 Note: For our EEO-1 U.S. headcount, regulatory logic is applied as specified and enforced by the U.S. Department of Labor’s Equal Employment Opportunity Commission (EEOC). Contents ESGatCiti SustainableFinance SustainableProgress Equitable&ResilientCommunities Talent&DEI RiskManagement&ResponsibleBusiness Appendices CITI 2021 ESG REPORT 101
Multiple Identity Breakdowns Table B Race/Ethnicity Total Hispanic or Latino Hispanic/ Latino White Black or African American Native Hawaiian or Pacific Islander Asian American Indian or Alaskan Native Hispanic or Latino 6,214 5,979 5,147 554 55 146 312 Race/Ethnicity Hispanic or Latino in Combination with Other Race(s) White and Other Race(s) Black or African American and Other Race(s) Native Hawaiian or Pacific Islander and Other Race(s) Asian and Other Race(s) American Indian or Alaskan Native and Other Race(s) Multi-Racial (or two or more races) 5,979 562 319 66 318 174 Note: For our EEO-1 U.S. headcount, regulatory logic is applied as specified and enforced by the U.S. Department of Labor’s Equal Employment Opportunity Commission (EEOC). Contents ESGatCiti SustainableFinance SustainableProgress Equitable&ResilientCommunities Talent&DEI RiskManagement&ResponsibleBusiness Appendices CITI 2021 ESG REPORT 102
In This Section 104 Our Transformation 110 Risk Management 121 Serving Our Customers and Clients Responsibly 125 Human Rights 134 Responsible Sourcing Risk Management and Responsible Business Contents ESGatCiti SustainableFinance SustainableProgress Equitable&ResilientCommunities Talent&DEI RiskManagement&ResponsibleBusiness Appendices CITI 2021 ESG REPORT 103
Our Transformation Through our transformation we are working to modernize and simplify the bank so that we can better manage risk, improve our service to customers and clients and make Citi an easier place to work. Through the modernization of our data infrastructure and operations, and by evolving our culture, we are strengthening our safety and soundness as a bank and improving our ability to compete in the digital age. Transforming Our Risk and Control Environment In October 2020, the Federal Reserve Board and the Office of the Comptroller of the Currency issued consent orders to Citi requiring improvements in the way we manage enterprise-wide risk, compliance, data and internal controls. This, combined with an increasingly competitive land - scape and our clients’ acceleration toward digital solutions through the pandemic, became the catalyst for Citi’s transforma - tion st rategy. Citi h as b een i n o peration f or m ore t han 200 y ears. B ut o ur t ransformation i sn’t about looking back; it’s about looking ahead, t o b ecome a n e ven st ronger ba nk f or all o ur s takeholders. T his t ransformation i s an i nterconnected, en terprise-wide e ffort. In a ddition t o r emediating i ssues, w e a re addressing r oot c auses, s implifying t he w ay we o perate a nd d oing s o m ore e ffectively. We a re r edesigning o ur k ey p rocesses f rom end t o e nd, a utomating t hem a nd e nsuring we have the proper controls in place while eliminating c omplexity. Governance and Leadership Putting the right teams and governance in place is critical to creating consistency in our approach across the firm and driving the u ltimate su ccess o f o ur t ransformation. Our Transformation Steering Committee, chaired by our CEO, sets the overall direction for our transformation efforts and communicates progress to our Board of Directors, as well as seeks input and feedback from the Board. In addition, one or more members of our Executive Management Team lead program groups that are central to our transformation. To encourage en terprise-wide en gagement, each of these groups includes representa - tion from across our businesses and func - tions. The executives in charge of these programs are held accountable for their group’s success, and their compensation is linked to achieving results. Senior leaders are setting the tone for their teams, showing a high level of engagement with, and commitment to, our transformation activities. OUR DATA GOVERNANCE PROGRAM Data quality is one of the areas of focus for our transformation. To lead this effort, we have established a Data Governance Program to elevate our data governance and to help drive necessary improvements to our technology and processes. Our goal is to make it easier to locate, collect and use the infor - mation our colleagues need to do their jobs and mitigate risk. In 2021, we rewrote our Citi Data Governance Policy (which governs how we manage and use our data) to be more concise, provide greater clarity and embed accountability across the firm. The policy clarifies and simplifies the way we govern data, with a focus on achieving access to trusted, high-quality data in a controlled way. Contents ESGatCiti SustainableFinance SustainableProgress Equitable&ResilientCommunities Talent&DEI RiskManagement&ResponsibleBusiness Appendices CITI 2021 ESG REPORT 104
Our Path to Transformation To e stablish a b aseline f or o ur t ransforma - tion s trategy, w e c onducted a g ap a nalysis exercise, s tarted i n 2 020 a nd c ompleted in 2 021, t o r eview t he i ssues r aised i n t he consent o rders a nd d efine t he g ap b etween where w e w ere a nd w here w e n eed t o b e. Following t he g ap a nalysis, w e d esigned a roadmap t o g et u s t o o ur t arget s tate. T he roadmap c omprises s everal d istinct a reas that f eed i nto C iti’s i ntegrated v ision o f transformation f or o ur c ompany. One o f t he fi rst a ctions w e u ndertook i n 2021 w as t o d evelop a nd r oll o ut a n ew Enterprise R isk M anagement F ramework t o assess risk across our enterprise. The inte - grated a pproach o f t he f ramework s eeks t o drive c onsistency a cross k ey a reas o f r isk, strengthening t he w ay t he fi rm i dentifies, measures a nd m onitors r isk s o t hat w e can i mplement a ppropriate c ontrols a nd reporting m echanisms. T he f ramework helps b ring c onsistency a nd s tructure t o the v aried t ypes o f r isks w e f ace a cross Citi — l eading t o b etter s cenario-planning, stress t esting a nd r oot-cause a nalyses across t he r isk l ifecycle. All c olleagues a re e mpowered t o a pply t he Enterprise R isk M anagement F ramework to t heir w ork a nd a re r esponsible f or promptly e scalating r isk-related c oncerns. We r olled o ut t raining o n t he n ew f rame - work t o a ll e mployees g lobally i n 2 021, a nd 98% c ompleted t he t raining b y t he e nd o f the y ear. We a re a lso d eveloping s tandards, p lans and t raining c urricula f or a m ore m odern, streamlined a pproach t o o ur c ontrol e nvi - ronment, w hich w e w ill b e i mplementing i n future y ears. F or e xample, w e a re e nsuring that w hen i ncidents a rise, o ur e mployees can c onduct r obust r oot-cause a nalyses and then apply the lessons learned hori - zontally a cross t he o rganization t o p revent similar i ssues f rom a rising e lsewhere. In a ddition, w e a re w orking t o s implify, streamline a nd a utomate o ur c ontrols — strengthening o ur a bility t o p revent i ssues, not j ust t o d etect t hem a fter t hey a rise. To e mpower o ur e mployees a nd i ncrease the e ffectiveness o f t heir d ay-to-day w ork, we a re u ndertaking a fu ll u pdate o f o ur policies to make them easier to under - stand a nd t ake a ction a gainst. W e’re a lso planning t o m igrate o ur p olicies t o a n ew platform i n 2 023, m aking t hem e asier t o access a nd n avigate. During 2021, we continued to build teams focused on transformation activities across the company. These teams are a hybrid of employees with a depth of institutional knowledge and newer employ - ees who bring diverse expertise and perspectives. Enterprise Risk Management Framework Risk Management Lifecycle Citi’s Approach to Managing Risk: • Culture • Enterprise Programs • Risk Management • Governance TALENT | TECHNOLOGY AND DATA | ANALYTICS MONITOR CONTROL REPORT IDENTIFY MEASURE Contents ESGatCiti SustainableFinance SustainableProgress Equitable&ResilientCommunities Talent&DEI RiskManagement&ResponsibleBusiness Appendices CITI 2021 ESG REPORT 105
Accountability, Culture and Talent Our t ransformation i s u nderpinned b y a fu ndamental r eset o f o ur a pproach t o culture a nd t alent, t o s trengthen r isk management a nd o ur c ontrol e nviron - ment. W e b elieve t his w ill a llow u s t o b uild a c ulture o f e xcellence i n w hich w e e ach take o wnership f or m anaging r isk a nd controls a nd w here w e c ontinue t o t ake pride i n w orking t ogether t o a lways d o the r ight t hing f or o ur c lients, c olleagues and c ommunities. To achieve this, we introduced a new set of Leadership P rinciples in 2021, to help us embed the behaviors and conditions we need in order to sustain the changes we are making as part of our transfor - mation. To further embed the Leadership Principles, Citi is deploying a three-year, firm-wide culture change program, designed to change the way we work by introducing small, everyday habits that we can all adopt to make Citi a stronger, simpler and more enjoyable place to work. We are working to ensure that we have the right number of employees with the right skills in place to achieve risk and control excellence, and that we use our employee development programs, promotion and performance management processes and compensation to reinforce and incentivize that excellence. Our compensation struc - ture captures individual impacts on risk and control, and each of our employees has a related performance goal they are working t oward. Ethics and Culture at Citi Each of our employees shares a common responsibility to earn and maintain our clients’ trust by applying our values and principles every day, to everything they do, wherever Citi operates. We expect our employees to prioritize excellence — for our clients, in our operations, and in our risk and controls environment — and to provide our products, services and expertise in a systemically responsible manner, while complying with all applicable laws, regu - lations and Citi policies. To reinforce this, we establish and communicate our core values and principles through our Mission and Value Proposition, our Leadership Principles, Citi’s Code of Conduct, various training and development opportunities, employee engagement initiatives and communications from our senior leaders. Tone from the Top We foster a culture of ethics through our governance framework, programs and efforts that embed our culture and expectations for behavior throughout the organization. Our approach begins with a strong “tone from the top,” start - ing with our Board of Directors. With oversight from the Ethics, Conduct and Culture Committee of the Board , our senior leaders consistently reinforce a culture of ethics, appropriate conduct and accountability within the organization, and empower our employees to make ethical decisions, escalate issues and adhere to Citi’s standards of conduct. WE ASK OUR COLLEAGUES GLOBALLY TO ENSURE THAT THEIR DECISIONS PASS THREE TESTS: • They are in our clients’ interests. • They create economic value. • They are always systemically responsible. These three tests help our colleagues to responsibly deliver on our core activities of safeguarding assets, lending money, making payments and accessing capital markets on behalf of our clients — each of which creates an obligation to act with integrity, to do everything possible to create the best outcomes for our clients, and to prudently manage risk. The tests demon - strate our commitment to using good judgment and taking pride in doing the right thing — even when it’s not the easiest thing. Contents ESGatCiti SustainableFinance SustainableProgress Equitable&ResilientCommunities Talent&DEI RiskManagement&ResponsibleBusiness Appendices CITI 2021 ESG REPORT 106
Acting with Integrity We empower our employees to do what’s right by setting clear expectations through our Mission and Value Proposition, Leadership Principles and Code of Conduct, as well as by providing the tools and resources our employees need to act ethically, along with clear information about the various resources available to escalate c oncerns. Code of Conduct Citi’s Code o f C onduct o utlines t he standards o f e thics a nd p rofessional behavior e xpected o f e mployees a nd representatives o f C iti wh en d ealing with c lients, b usiness c olleagues, shareholders, c ommunities an d e ach other. I t a lso p rovides a n o verview o f k ey legal a nd r egulatory r equirements a nd select g lobal p olicies. Our Code reinforces for employees that Citi’s culture is one in which we take pride in always doing the right thing, hold ourselves an d e ach o ther a ccountable, an d feel c omfortable a nd eq uipped t o p romptly escalate c oncerns a bout a ctual o r p otential misconduct. I t a lso r eflects C iti’s o ngoing commitment to fostering a culture of diver - sity a nd i nclusion — o ne i n w hich d oing t he right thing includes showing empathy for our c olleagues, c lients a nd c ommunities; treating each other with respect and civility; and continuing to invest in colleagues from all b ackgrounds. Citi’s Code of Conduct applies to all directors, officers and employees of Citi worldwide. Upon joining Citi, employees must acknowledge that they have read and will comply with our Code. To best serve our global workforce, we publish our Code of C onduct i n 21 l anguages and make it publicly available on our Investor Relations website. I ndividuals p erforming s ervices for C iti m ay a lso b e su bject t o o ur C ode by c ontract o r a greement. A s e xplicitly stated i n o ur C ode, v iolations c an r esult in d isciplinary a ction u p t o a nd in cluding termination of employment or other rela - tionship w ith C iti. We p rovide C ode o f C onduct t raining t o new hires globally when they join Citi, as well as to nonemployee contingent workers performing services for Citi at their time of onboarding. In addition, we ask employees and contingent workers to periodically r eaffirm t heir c ommitment t o our Code through required Code of Conduct training. T he t raining in cludes h ypothetical work-related ethical scenarios that focus on m aking g ood d ecisions a nd p erforming our w ork i n a w ay t hat i s c onsistent w ith Citi’s v alues, c ulture, ap plicable l aws, an d Citi policies, standards and procedures. The training in cludes h ypothetical w ork-related situations t hat a llow e mployees t o p ractice ethical d ecision-making a nd r einforce k ey concepts f rom o ur C ode o f C onduct, M ission and V alue P roposition a nd o ur L eadership Principles. Li ke o ur C ode o f C onduct, t he training e mphasizes e mployees’ o bligation to p romptly r eport a ctual o r su spected misconduct a nd p rovides i nformation on the various resources available to them to do so. Leadership Principles In early 2021, we launched a new set of Leadership P rinciples t hat r eflect t he behaviors and expectations we have for ourselves i n l ine w ith o ur transformation to become a better, stronger bank. We encourage a ll e mployees t o d emonstrate the Leadership Principles in all that they do. Holding ourselves and each other to these high standards is part of our culture and our c ommitment t o o perating i n o ur c lients’ best i nterests, d riving ec onomic v alue a nd managing ri sk. We expect managers to lead by example and inspire their employees to live Citi’s values. Every manager is responsible for creating a work environment that is free of Citi’s Leadership Principles These principles represent the qualities, behaviors and expectations we all must exhibit to deliver on our mission of enabling growth and economic progress. They will contribute to creating a culture that drives client excellence, controls excel - lence and operational excellence. We take ownership: Challenging each other to high standards and welcoming that challenge; greeting change with optimism, curiosity and resilience; speaking with candor; learning from experience; and contributing to and honoring group decisions We deliver with pride: Striving for excellence across our business; simplifying, standardizing and clarifying our work; holding ourselves and others accountable for managing risk; fixing root causes of problems; and taking pride in doing the right thing We succeed together: Valuing and learning from different perspectives; breaking down barriers; measuring performance through a stakeholder lens; investing in colleagues from all backgrounds; and showing empathy for our colleagues, clients and communities. Contents ESGatCiti SustainableFinance SustainableProgress Equitable&ResilientCommunities Talent&DEI RiskManagement&ResponsibleBusiness Appendices CITI 2021 ESG REPORT 107
discrimination, harassment and retaliation. Managers are expected to reinforce the importance of following our Leadership Principles, Code of Conduct and Mission and Value Proposition, as well as to encourage employees to speak up and raise any concerns about potential legal or ethical issues. Managers must properly resolve or promptly escalate concerns through appropriate channels, promote awareness of all resources available for reporting concerns and neither engage in, nor tolerate, retaliation of any kind. Escalating Business and Ethical Concerns Each member of our workforce plays a crit - ical role in escalating business and ethical concerns so that they can be addressed quickly a nd e ffectively. C iti’s Co de o f Conduct e mphasizes t he p rinciple t hat, when in doubt, employees should always err on the side of escalation. Our Code provides an overview of the types of misconduct and concerns that require escalation and the resources available to employees for prompt escalation of concerns, as well as a l ink t o t he fu ll C iti E scalation P olicy, which provides even more information for employees a bout e scalation r equirements and r esources. As part of Citi’s escalation resources, the Ethics Hotline p rovides m ultiple c hannels for employees and any third party, includ - ing members of the general public, to report c oncerns a bout u nethical b ehavior to Citi’s Ethics Office. In addition to internal and public-facing websites (enhanced in January 2022 with upgraded features) that f acilitate su bmission o f c oncerns, a telephone line is available 24 hours a day, seven days a week, with live operators who can connect to translators in multiple languages. We believe it is essential that individuals feel secure when raising a concern. All contacts to the Ethics Office and Ethics Office i nvestigations a re t reated a s confidentially a s p ossible, c onsistent w ith the need to investigate and address the matter, a nd su bject t o a pplicable l aws a nd regulations. Concerns may be raised either anonymously o r w ith a ttribution, su bject to applicable laws and regulations. Further, Citi prohibits any form of retaliation against anyone w ho r aises a c oncern or q uestion regarding e thics, d iscrimination o r h arass - ment m atters, as w ell as a gainst a nyone who p articipates i n a su bsequent i nvestiga - tion. Employees who engage in retaliation against a c olleague b ecause t hey r aised a concern or q uestion, a sked f or a r easonable accommodation, r eported a v iolation or was i nvolved i n a n i nvestigation a re su bject to disciplinary action, up to and including termination of employment or other rela - tionship with Citi. ASSESSING OUR CULTURE OF ETHICS Hearing from employees is one important way we assess the strength of ethics and accountability across our company. As part of Citi’s annual Voice of the Employee survey, we include an Ethical Culture Index to gather feedback from employees about the following items: • Comfort with reporting unethical practices without fear of reprisal • A feeling of accountability to identify and escalate issues • Confidence that Citi will act upon reported legal or ethical violations • A belief that colleagues act with integrity • Manager encouragement of ethical conduct even in the face of pressure In dex results stayed stable in 2021, with 91% of our employees responding positively to the index. We will continue to listen to our employees and raise the bar in this area. Staying on Top of Your Ethical Game Through our global Ethical Fitness Challenge, led by our Executive Management Team, we provided employees with the equipment they needed to get in their best ethical shape. Through this campaign, we released a series of eight modules over three years, incorporating senior leader videos, case studies and knowledge checks, as well as support to help managers guide conversations around each topic. Each part in the series highlighted a different element of ethical fitness, such as behavior rationalization, the importance of speaking up, misplaced loyalty and finding clarity in ethical situations. This campaign concluded in 2021, with a required training for all employees to consolidate and reinforce key themes presented over the course of the campaign. Contents ESGatCiti SustainableFinance SustainableProgress Equitable&ResilientCommunities Talent&DEI RiskManagement&ResponsibleBusiness Appendices CITI 2021 ESG REPORT 108
TRANSPARENCY FOR EMPLOYEES Annual Ethics Hotline Summary Each year, the Citi Ethics Office provides all employees with a summary of the types of concerns received through the Ethics Hotline and the types of corrective actions that may arise from substantiated concerns. This summary demonstrates that the Ethics Hotline process is used by our colleagues globally and that raising concerns to the Citi Ethics Office leads to meaningful action within our organization, such as disciplinary action, termination of vendor relationships, referrals to law enforcement or governmental authorities, employee communications, additional training, control enhancements, and changes to Citi policies, business processes and procedures. Spotlight on Ethics Citi shares with employees the results of ethics investigations, including a summary of corrective actions, through a quarterly communication called the Spotlight on Ethics. This communication reinforces for employees that their concerns are investigated and highlights commonplace areas in which ethical lapses can occur. In 2021, the Spotlight on Ethics focused on select risk areas such as protecting information from inappropriate uses, the prohibition on using unapproved communication methods to conduct Citi business, preventing retaliation or the suppression of concerns, and the requirement to cooperate with appropriately authorized internal or external investigations. Contents ESGatCiti SustainableFinance SustainableProgress Equitable&ResilientCommunities Talent&DEI RiskManagement&ResponsibleBusiness Appendices CITI 2021 ESG REPORT 109
Risk Management We employ robust policies and practices to thwart corruption, address potential environmental and social risks in our portfolio, and safeguard data and customer privacy. These rigorous practices enable us to grow a successful, respected business that delivers the best possible results for our clients, customers and communities. Managing Corruption and Tax-Related Risks Anti-Corruption Activities Citi’s F inancial C rimes U nit i ncludes t he Global F inancial C rimes I nvestigations and I ntelligence ( GFCII), A nti-Bribery and C orruption, A nti-Money L aundering (AML) a nd S anctions t eams. O ur C hief Compliance O fficer, w ho r eports d irectly t o our C EO, p rovides r egular r eports o n t he performance o f ou r c ompliance p rogram, with r egard t o t hese a reas, t o o ur B oard of D irectors o r a c ommittee o f t he B oard, as a ppropriate. T hrough o ur F inancial Crimes u nit, C iti w orks t o p revent, i dentify and c ounteract t he m any a nd v aried corruption-related r isks t hat c onfront t he financial s ector. For e xample, s ince i ts i nception i n 2 018, Citi h as b een a n a ctive m ember o f United for Wildlife’s Financial Taskforce , a collab - oration b etween fi nancial i nstitutions a nd nongovernmental o rganizations t o fi ght illegal w ildlife t rafficking. I n 2 021, C iti worked with United for Wildlife, TRAFFIC and t wo t elecommunications c ompanies to c reate a n i llegal w ildlife t rade c ountry threat p rofile o utlining c ritical ri sk s cenarios and i ndicators f or c ountries i n su b-Saharan Africa, beginning with Kenya as a pilot. In addition, during 2021, Citi’s GFCII and Anti-Bribery and Corruption teams participated in a working group led by the Organisation for Economic Cooperation and Development (OECD) to develop a credible certification framework for eval - uating infrastructure projects under the auspices of the OECD’s Blue Dot Network . Once implemented, this framework will set a standard to develop market-driven, transparent, financially sustainable development projects. The working group is made up of leaders and experts from the private sector, civil society and academia and is focused on the following core themes: investment efficiency and outcomes, environmental and social considerations, and transparency and integrity. Citi participants are shaping the framework by sharing their expertise in standards, guidelines and practices related to AML and anti-bribery and corruption, including t hird-party a nd a dvisor/inter - mediary risk management, procurement lobbying, controls, risk assessments, metrics, Financial Action Task Force guid - ance and customer due diligence. In 2021, Citi also contributed to a multi- session workshop sponsored by the Terrorism, Transnational Crime and Corruption Center, in conjunction with the Association of Certified Anti-Money Laundering Specialists. Participants included several financial institutions and leading nonprofit organizations with expertise in environmental crimes, such as TRAFFIC and key U.S. government development agencies (e.g., USAID). The workshops were designed to address key aspects of global environmental crime and corruption. GFCII provided several presentations and led discussions on the capability of financial institutions and the importance of information-sharing regarding typologies and red flags, to address crimes related to environmental, social and governance (ESG) issues. As an outcome of the roundtable discussions, TRAFFIC worked with GFCII to provide specialized training to Citi employees in our Europe, Middle East and Africa region. This included a series of webinars co-hosted by Citi, TRAFFIC and the Environmental Investigation Agency, a nongovernmental organization that investigates and campaigns against envi - ronmental crime and abuse. The training series focused on how to identify red flags in client onboarding and transactional activity to disrupt the flow of income generated by environmental crime. Contents ESGatCiti SustainableFinance SustainableProgress Equitable&ResilientCommunities Talent&DEI RiskManagement&ResponsibleBusiness Appendices CITI 2021 ESG REPORT 110
Programs and Training to Combat Financial Crimes Anti-Bribery Program Citi has policies, procedures and internal controls to comply with anti-bribery laws, and we conduct an annual bribery risk assessment of all global business lines. We provide our staff with anti-bribery training annually and supplement it with targeted training and communications as needed. For more information, see the Citi Anti-Bribery Program Statement , which is updated at least annually. Anti-Money Laundering Progra m Citi’s Anti-Money Laundering (AML) Program protects our clients, our franchise and the global financial system from the risks of money laundering and terrorist financing. The program includes more than 5,600 employees globally, including 225 designated AML Country Officers covering every Citi business, function and geographic area. These specialists partner with various functions, including Compliance, Audit, Technology and our insti - tutional and consumer businesses, to provide effective enterprise AML risk assessment and to meet our AML-related requirements at both the global and the local levels. For more information, visit our AML Program website . Global Financial Crimes Investigations and Intelligence Global Financial Crimes Investigations and Intelligence (GFCII) is uniquely positioned within our Compliance function to tackle financial crime and provide a globally consistent approach to the prevention and detection of risk. GFCII leverages its many trusted partnerships with law enforcement, nonprofits and internal stakeholders to obtain actionable intelligence, primarily through participation in public/private forums, allowing for proactive identification of illicit activity and effective mitigation of risk. This connectivity results in the execution of a data-driven global strategy addressing emerging risk trends and typologies across business lines and geographies. Sanctions Program Citi is obligated to comply with applicable sanctions, laws and regulations in the countries where we operate and maintains a robust, risk-based Independent Compliance Risk Management Sanctions Program that applies globally. As a financial institution organized in the United States, Citi and our subsidiaries globally comply with applicable U.S. sanctions requirements, among other requirements. Our Sanctions Program includes policies and procedures, risk category statement and tolerance thresholds, enterprise-wide screening, annual risk assessments and audits of sanctions control processes, employee training and a diverse team of Compliance professionals stationed around the world. For more information on our Financial Crimes programs, please see Citi’s Code of Conduct . Number of Employees and Contingent Workers Who Completed Citi’s 2021 Financial Crimes Compliance Training (by Region) * 62,759 North America 29,499 Latin America 28,671 Europe, Middle East and Africa 74,365 Asia Pacific * This combined online training incorporates multiple anti-corruption efforts, including AML, sanctions and anti-bribery training. Numbers include all Citi staff who had completed the 2021 training as of December 2021. (Employees and contingent workers generally have 30 days to complete it.) Contents ESGatCiti SustainableFinance SustainableProgress Equitable&ResilientCommunities Talent&DEI RiskManagement&ResponsibleBusiness Appendices CITI 2021 ESG REPORT 111
Taxation Policies and Standards Citi d oes b usiness i n m ore t han 1 60 countries a nd j urisdictions, a nd ma intains strong r eview a nd e scalation p rocesses that e nable u s t o a dhere t o h igh s tandards of c ompliance w ith ap plicable t ax l aws. W e are a c urrent i ncome t axpayer, b oth w ithin and o utside t he U nited S tates. O ur t ax profile i s c onsistent w ith t he l ocations o f our bu siness op erations. We e mphasize s trong i nternal c ontrols a nd transparency w ith g lobal t ax a uthorities and s hare i nformation r elevant t o o ur t ax profile. W e su pplement t his t ransparency with additional country-by-country report - ing, w hich i s r equired u nder t he O ECD’s action p lan t o a ddress b ase e rosion a nd profit s hifting. O ur t ax p olicy i s o verseen by o ur C hief T ax O fficer, w ho r eports t o the C hief F inancial O fficer. T ax p olicies a nd related m atters a re r eviewed b y t he A udit Committee o f t he B oard o f Di rectors. Citi m aintains a s trong s ystem o f c ontrols to f acilitate r eporting a nd w ithholding requirements. W e h ave s ystems a nd processes t o c omply w ith t he F oreign Account T ax C ompliance A ct, a nd w e a re in c ompliance w ith t he C ommon R eporting Standard i n a ll ap plicable c ountries w here local i mplementing g uidance h as b een issued. S imilarly, w e h ave a fi rm-wide p olicy applicable t o c ustomer t ransactions u nder which C iti w ill o nly e ngage i n t ransactions where t here i s a h igh d egree o f c ertainty that a ny t ax a spects w ill b e a ccepted b y t he respective t axing a uthorities. For m ore i nformation on h ow t axation impacts C iti, s ee p age 1 28 o f o ur 2021 Form 10-K . Public Policy Being a responsible corporate citizen includes engagement in the political process as a part of our strong ESG prac - tice. The potential impact of public policy on our business, employees, communities and customers is an important reason why Citi works to advance and protect the global business interests of our company directly and indirectly through engage - ment with trade associations, governments and elected officials around the world. Citi advocates for public policies that support the interests of our company, clients and employees, such as trade, cybersecurity, data localization, tax and financial reform. Guided by Citi’s Political E ngagement Statement , company political activities are performed in compliance with applicable laws and regulations. Under U.S. Federal Election Commission rules, Citi’s Political Action Committee (Citi PAC) pools the voluntary contributions of eligible employees to support U.S. political candidates and campaigns that support the financial industry and complementary pro-business policies. In 2021, we reviewed and strengthened our principles for deter - mining future support by Citi PAC. The updated criteria include: • Support of business issues important to Citi • Position on a committee with jurisdic - tion over policy issues important to Citi, or elected leadership position • Representation of a state or district where Citi has a significant employee presence • Character and integrity, and demon - strated commitment to bipartisanship, governing and protecting democratic institutions Contents ESGatCiti SustainableFinance SustainableProgress Equitable&ResilientCommunities Talent&DEI RiskManagement&ResponsibleBusiness Appendices CITI 2021 ESG REPORT 112
Our bipartisan Government Affairs team and the Citi PAC Board will consider whether contributions meet the strength - ened criteria going forward. Safeguarding Data and Protecting Customer Information As d igital s olutions e xpand a nd b ecome more i ntegrated i nto o ur d aily l ives, w e see i ncreasing c oncerns r elated t o p rivacy and s ecurity b reaches. D ata s ecurity a nd customer p rivacy a re t op p riorities f or C iti and f or o ur s takeholders. T he C OVID-19 pandemic has led to an even greater reliance o n d igital t echnologies, w hich makes s afeguarding d ata a nd c ustomer information even more vital. Cybersecurity Citi’s C hief I nformation S ecurity O ffice (CISO) o rganization e nsures t hat a n a ppro - priate level of cybersecurity governance, capabilities a nd c ontrols a re i n p lace t o protect C iti’s a nd o ur c lients’ i nformation assets, w ith e nd-to-end a ccountability across t he fi rm. O ur a pproach r ests o n ensuring w e h ave t he r ight a rchitecture, technology, p olicies, p rocesses a nd t alent in place to prevent, detect, respond to and recover from cyber threats quickly. Our Cybersecurity Program is overseen by Citi’s B oard o f D irectors a nd i s r egularly reviewed by regulators, as well as by inter - nal a nd e xternal a uditors. T he p rogram is m anaged b y t he C hief E nterprise Operations & T echnology O fficer a nd the C hief I nformation S ecurity O fficer on a g lobal e nterprise b asis; t he C hief Executives of each business sector and region a re r esponsible f or i mplementation and c ompliance w ith p rogram r equire - ments. A nnually, w e p rovide o ur e mployees with t raining o n h ow t o p roperly h andle and m aintain t he s ecurity a nd p rivacy o f Citi’s a nd o ur c lients’ i nformation. During 2 021, C iti’s c ybersecurity t eam organized a s eries o f p reparedness exercises for employees, including cybersecurity sc enarios f or gl obal functions a nd l ines o f b usiness a cross both o ur I nstitutional C lients G roup a nd Personal B anking & W ealth M anagement divisions. D ue t o t he c ontinued i mpact of COVID-19, these events were again conducted r emotely. D uring t he y ear, we s aw c ontinued g rowth i n d emand from senior executives for cybersecurity exercises. T he C iti c ybersecurity t eam conducted a s eries o f l inked e xercises f or our v arious r egions, c ulminating w ith a n exercise f or o ur C EO a nd G lobal O perating team. C iti’s C ybersecurity F usion C enter participated in t hese gl obal c ybersecurity exercises a nd c onducted a dditional d rills dedicated t o i ts op erations. To s afeguard i nformation, w e i nvest i n and develop advanced security solutions that a llow u s t o b etter su pport o ur digital s trategy. F or i nstance, w e a re implementing a m ultifaceted a pproach t o move toward password-less capabilities, including b iometric o ptions su ch a s v oice recognition or fi ngerprints. T hese s olutions create a f rictionless a nd m ore s ecure experience f or b oth i nternal a nd e xternal users. In addition, Citi has invested in next-generation s ecurity c omponents that su pport d igital a nd m obile g rowth, by e nabling e nhanced s ecurity f eatures for o ur m obile a pplications. F urther investments in advanced technology have provided Citi with improved cyber incident monitoring, de tection a nd r esponse capabilities, st rengthening t he ba nk’s cybersecurity p osture. Citi conducts regular cybersecurity risk assessments and has internal controls to defend a gainst c ybersecurity b reaches. We maintain technology and cybersecurity policies based on established industry standards and employ robust technol - ogies to protect our data and systems, supported by a strong team with deep expertise from industry and government. Our CISO team safeguards information from data breaches and misuse by maintaining secure networks to protect Contents ESGatCiti SustainableFinance SustainableProgress Equitable&ResilientCommunities Talent&DEI RiskManagement&ResponsibleBusiness Appendices CITI 2021 ESG REPORT 113
our systems and databases, and we continuously improve our capabilities to meet the challenge of an evolving threat environment. In the event of a potential breach, we have a robust process to ensure appropriate reporting and notification, which includes: • Reviewing the breach to determine whether it meets any regulatory or legal reporting requirements in the country(ies) where the breach occurred or in the country(ies) impacted by the breach. If deemed necessary, a legal assessment is conducted. • Notifying the impacted customers as required by the laws or regulations of the impacted country(ies) and as directed in the legal assessment, if it results in a requirement to perform customer n otifications. We understand that simply defending ourselves is not enough. We must also influence the broader cybersecurity landscape within which Citi operates. As such, we collaborate with our clients, peer financial institutions, governments, law enforcement and intelligence agencies on a global scale to share best practices, exchange tactical information about specific cybersecurity threats, conduct joint cyber resilience exercises and work to drive adoption of industry-wide standards and approaches that will best enable the collective defense of the financial services sector a gainst c ybersecurity c hallenges. Our security teams receive and share threat data with our partners in near real time, leveraging that information to strengthen our internal controls and prac - tices and to protect Citi from attacks being perpetrated against other firms. Citi takes a leadership role in fostering a culture of sharing amongst our competitors on secu - rity issues, putting competitive instincts aside for the sake of strong information security practices. Privacy The fair, ethical and lawful collection, use and processing of customers’ personal information is essential to build trust, provide best-in-class services and achieve our corporate objectives. To help meet this goal, Citi has established a dedicated Chief Privacy Office team, led by a global Chief Privacy Officer. The Chief Privacy Office, part of our Independent Compliance Risk Management team, manages the Citi Global Privacy Program, which is overseen by Citi’s Privacy Advisory Body. The program provides a framework for managing privacy and confidentiality risks for the company. Citi has also established the Global Chief Privacy Counsel under the General Counsel’s Office. The Global Chief Privacy C ounsel p rovides gu idance an d strategic direction regarding privacy and data protection laws to the Chief Privacy Office and to businesses and functions across the enterprise. Citi’s Privacy and Bank Customer Confidentiality Policy articulates principles relating to the collection and processing of personal information, requiring, in part, that personal information only be collected and used as necessary for the perfor - mance of the services offered and for the purposes disclosed in a privacy notice. Citi is transparent in our collection and use practices and offers customers choices about how their personal information may be collected or otherwise used (as required by law), including opting out of marketing or other communications or reviewing and correcting information. Citi employees are required to take privacy and information compliance training that covers these privacy concepts. Protecting Digital Identity For fi nancial i nstitutions su ch a s C iti, verifying o ur c ustomers’ i dentity i s fu nda - mental t o s afeguarding t heir fi nancial assets a nd p rotecting t heir p rivacy. O ur aim i s t o d eliver s olutions t hat p rovide seamless, i ntuitive i nteractions w ith d igital tools t hat w on’t c ompromise p ersonal data. T o p rovide o ngoing t raining f or our e mployees, w e h ave c reated d igital identity l earning p acks t hat h elp b uild awareness o f — a nd s kills r elated t o — n ew digital id entity t echnologies. I n a ddition, we e ngage w ith c lients, p artners a nd industry e xperts t o d iscuss t he t rends, challenges a nd o pportunities r elated t o digital id entity a nd t o e xplore c utting-edge technologies t hat h ave t he p otential t o meet o ur c ustomers’ need s. We also provide our customers with timely resources and information related to safety and security. Our U.S. online Security Center enables customers to learn about what Citi does to protect them and what they can do to protect them - selves against identify theft and other security risks. Contents ESGatCiti SustainableFinance SustainableProgress Equitable&ResilientCommunities Talent&DEI RiskManagement&ResponsibleBusiness Appendices CITI 2021 ESG REPORT 114
If a transaction impacts any of the following Areas of High Caution, ESRM will conduct enhanced due diligence The ESRM team reviews transactions subject to policy and benchmarks against relevant industry standards/ best practice, identifying opportunities for improvement and engagement. Environmental and Social Risk Management Our Environmental and Social Risk Management (ESRM) Policy helps us identify potential risks within the billions of dollars in global transactions we facilitate worldwide. This policy also sets a frame - work for us to evaluate how our clients are managing those risks. Our ESRM Policy Our E SRM P olicy, w hich i s su mmarized publicly i n o ur Environmental a nd So cial Policy F ramework , h elps u s fi nance projects a nd a ctivities r esponsibly b y engaging o ur c lients o n en vironmental and s ocial r isks a nd b est p ractices. W e established t he P olicy i n 2 003, a nd we c ontinue t o e volve o ur a pproach i n response t o e merging r isks a nd n ew product d evelopment. I n 2 021, w e updated o ur E SRM P olicy b y a dding a policy p rohibition a gainst fi nancing f or companies c onstructing or op erating private p risons a s a p rimary b usiness. Although t his h as n ot b een a n i ssue f or our c ompany i n t he pa st, w e dec ided t o formalize t his c ommitment t hrough a n official p olicy u pdate. Our comprehensive ESRM Policy covers a broad scope of financial products and client sectors and guides how we assess client impacts on air quality, water quality, c limate c hange, b iodiversity, l ocal communities, labor, human rights and other environmental and social issues. Our i nternal p olicies a nd p rocedures reference i nternational i ndustry s tan - dards, such as the International Finance Corporation’s Environmental and Social Performance Standards and the World Bank G roup’s E nvironmental, H ealth, a nd Safety Guidelines. Where relevant, we also require clients to adhere to sector and commodity-specific guidelines and certifications such as the Roundtable on Sustainable Palm Oil and the Forest Stewardship C ouncil. Citi’s ESRM Policy at a Glance ESRM Policy objective: Effectively assess and manage the environmental and social risks associated with financing client activities in sectors with sensitive environmental and social impacts. A transaction or client relationship may trigger the ESRM Policy for three reasons: Citi’s ESRM Sector Approaches apply sector-specific review requirements for certain clients in sensitive sectors Citi’s ESRM Policy also includes a number of prohibitions for highest concern environmental and social risks. Refer to the ESRM section of Citi’s Environmental and Social Policy Framework for more information. Transactions with use of proceeds directed to a specific physical asset or project Clients in sectors considered particularly high risk by Citi Clients/transactions with impacts to an Area of High Caution 1 2 3 Coal Mining Oil & Gas Military Equipment Mining Palm Oil Coal-Fired Power Forestry Firearms • Conflict risk • Indigenous rights • Critical habitat and cultural heritage • Human rights, including environmental justice • Involuntary resettlement Contents ESGatCiti SustainableFinance SustainableProgress Equitable&ResilientCommunities Talent&DEI RiskManagement&ResponsibleBusiness Appendices CITI 2021 ESG REPORT 115
Policy Implementation Our centralized team of ESRM specialists within Citi’s Risk Management function evaluates transactions that trigger a review under our ESRM Policy. We also provide ESRM training to key risk and banking personnel globally, enabling them to spot potential risks. In addition, our ESRM Champions, located around the world, use their regional expertise and additional ESRM training to serve as bridges between our local banking teams and our global ESRM team. This network approach enhances the global coverage capacity of our centralized specialist team. The ESRM team shares information and best practices with ESRM Champions to support and strengthen the entire network. When the viability of a deal is first explored, our ESRM team works with Citi bankers to evaluate the magnitude of the potential environmental and social impacts associated with the transaction and to determine what action, if any, is needed to comply with our ESRM Policy prior to final approval of the transaction. If Citi receives a mandate to move forward with a trans - action that involves such risks, the ESRM team continues to work with the banking team to conduct due diligence commensu - rate with the risks faced. Higher-risk, p roject-related t ransactions may receive in-depth reviews by indepen - dent environmental and social consultants to benchmark against international standards. If gaps are found between a client’s environmental and social plans, policies or practices and international standards, we require the development of an Environmental and Social Action Plan (ESAP) to fill the gaps. As a condition of financing, we require the client to imple - ment the ESAP by specifying covenants in the loan agreement, and we monitor its progress over time. In some cases, we decline to participate in a transaction because we do not believe we can adequately address the environmental and social risks through mitigation measures or because the risks are too high. Applying our ESRM Policy helps us to identify risks beyond traditional credit risks, guides how we evaluate transactions related to companies or projects in high- risk sectors and presents opportunities for us to advise clients on solutions to thematic risks. Over the last few years, we have seen a rapid increase in the volume and variety of transactions flagged for ESRM review. This is due to increased interest from regulators on ESRM-related issues and the growth in ESG-related financial products, as well as greater engagement across the firm as employees receive additional training and become more aware of the potential environmental and social risks in the transactions they are managing. For example, the responsibility and activities of our ESRM team have expanded in recent years to account for increasing attention and concern related to climate risk. For information about our approach and management activities in this area, see the Climate Risk and Net Zero section . The ESRM section of our Environmental and Social Policy Framework outlines the scope of our ESRM Policy, including the types of transactions that trigger a review, and provides additional detail about our risk-screening practices and categories, independent reviews and action plans. The Framework also includes an overview of our Areas of High Caution, sector-specific approaches and policy prohibitions. Ongoing engagement with our clients is an important part of our ESRM process. When we first established our ESRM policy, our engagements were tied to specific, project-related financial transactions and their associated environmental and social risks and mitigation efforts. However, as we have developed Sector Approaches and Areas of High Caution over the years, we have added corporate-level reviews and client engagements in a number of Contents ESGatCiti SustainableFinance SustainableProgress Equitable&ResilientCommunities Talent&DEI RiskManagement&ResponsibleBusiness Appendices CITI 2021 ESG REPORT 116
sectors. These sector-specific risk review processes encourage dialogue between Citi a nd o ur c lients a bout t he m aterial e nvi - ronmental and social risks associated with their operations, enabling us to develop a better understanding of prevailing indus - try practices and our clients’ performance and to guide our clients toward more sustainable practices. Monitoring the Changing Risk Landscape The ESRM team uses a number of methods to proactively scan the changing risk landscape for new, emerging risks, as well as risks with increased prominence and prevalence. Through internal research, engagement with our regional ESRM Champions, collaboration with others in our industry, and the use of third-party environmental and social data, we monitor relevant developments in high-risk industries and stakeholder concerns to flag emerging issues. Proactive monitoring enables us to identify issues and the interrelated impacts of various sectors, so we can be responsive to evolving risks, raise awareness within Citi about emerging issues and identify clients that may be impacted for further engagement. We are beginning to incorporate new tools to scan for emerging environmental and social risks. The team has reviewed a range of technologies for use in our due diligence approach, such as environmental DNA gathering to conduct biodiversity baseline studies and benchmark improvements in biodiversity values over time. This technique enables the analysis of DNA in water or soil samples to identify the fauna living in a given project area without the need to visually verify their presence. Another way we monitor risk is by conduct - ing sector-specific reviews to identify and mitigate emerging risks in our existing portfolio. These evaluations are based on information published or provided by the client as well as information from special - ized ESG rating agencies and topic-specific databases. This process enables us to better understand how our clients manage environmental and social issues and provides valuable insight into the level of related risk across our portfolio. In 2021, we conducted reviews of our mining, oil and gas, and power portfolios as well as a portfolio review of our clients in Malaysia related to human rights . PROTECTING BIODIVERSITY AND ADDRESSING RESETTLEMENT CONCERNS IN PANAMA CITY In 2021, Citi, in coordination with other financial institutions, closed a $2 billion transaction to finance Metro Line 3, an expansion of Panama City’s metro system. Citi worked with Consorcio HPH, a consortium of Korean companies responsible for the construction of Metro Line 3. Because this is a project-related corporate loan for more than $50 million, due diligence processes required an independent review before the close of the transaction. Consorcio HPH and the lenders engaged environmental and social consultant, ERM, to evaluate the project’s environmental and social impacts and benchmark management plans against international standards. This due diligence revealed two primary risks related to the project: potential biodiversity impacts and physical/economic displacement of individuals and businesses along the path of the new metro line. To address biodiversity concerns and align the project with IFC Performance Standard 6 for biodiversity , ERM performed a Critical Habitat Assessment to study potential impacts on migratory and/or congregatory species within the project’s area of influence. ERM identified an Important Bird Area, including habitat for species such as the broad-winged hawk, Swainson’s hawk and turkey vulture. The assessment revealed that a small area of Critical Habitat (0.54 hectare) would be directly impacted by the project. In order to ensure a net gain of critical habitat and no net-loss of natural habitat, Consorcio HPH will implement reforestation and biodiversity monitoring programs to measure results. After a review of impacts related to resettlement and livelihood displacement, it was determined that the project’s need for resettlement would be minimal. Nonetheless, Consorcio HPH is working with Metro de Panama S.A. (MPSA) to ensure that proper protocols are followed when engaging with residents about the need for resettlement, attaining willing seller consent, providing adequate compensation and developing livelihood restoration plans for those who may be impacted. MPSA is also working with a social consultant to enhance its local resettlement process to align with international best practice, including the IFC Performance Standard 5 for resettlement . As an additional precaution, the project’s construction schedule is tied to review by ERM and the lenders to ensure that resettlement risks are fully assessed and benchmarked before construction begins in areas where resettlement or displacement may occur. Contents ESGatCiti SustainableFinance SustainableProgress Equitable&ResilientCommunities Talent&DEI RiskManagement&ResponsibleBusiness Appendices CITI 2021 ESG REPORT 117
Client Engagement Our ESRM team is collaborating with our Sustainability a nd Co rporate T ransitions team to engage with clients working to transition t oward m ore su stainable s trat - egies and business models. This provides opportunities f or i n-depth d iscussions o f specific s ustainability t opics, i dentifies w ays of p roactively m itigating e nvironmental a nd social r isks, a nd su pports o ur c lients i n t heir efforts to align with international standards and b enchmarks. F or e xample, du ring an engagement with mining clients in 2021, our ESRM team provided insight and analysis related t o t he su stainable fi nance m arket and the challenges and opportunities for mining companies related to environmental and social risk. The breadth and depth of our ESRM team’s knowledge in these areas is a valuable tool to help us assess new trans - actions and to guide and advise our clients as w e w ork t oward a chieving o ur net zero commitment . For more information about the work Citi is doing to help clients transi - tion t o a l ow-carbon fu ture, s ee t he Financing the L ow-Carbon T ransition s ection . Industry Collaboration We participate in many environmentally and socially focused initiatives and orga - nizations, such as the Equator P rinciples Association and the Roundtable o n Sustainable Palm Oil . Citi is also a member of the Taskforce on Nature-related Financial Disclosure s (TNFD) Forum. We participated in an informal working group prior to the official launch of the Taskforce to develop the TNFD’s workplan for creating a comple - mentary framework to the Task Force on Climate-related Financial Disclosures, but with a focus on reporting nature-related risks rather than climate-related risks. Climate and biodiversity are intercon - nected, and there are increasing concerns that climate change, along with other human activity, has stressed natural systems and contributed to ongoing extinction ev ents. 1 Through our collabora - tion with TNFD, we are able to contribute to important nature-related reporting standards and continue to refine our understanding of the complex interaction of climate and biodiversity and our connection with those impacts through our financial relationships with our clients. ESRM Training Each y ear, w e t rain k ey r isk a nd b anking personnel on our ESRM Policy to help them identify t riggers f or en gagement w ith our ESRM specialist team. Topics include environmental and social risks relevant to c ertain r egions a nd se ctors, im plemen - tation of the Equator Principles and Citi’s Sector A pproaches, a s w ell a s s pecific topics su ch a s h uman r ights, b iodiversity and e merging c limate r isk a nalysis. D ue t o increased f ocus f rom k ey s takeholders in ESG i ssues, m ore b ankers a cross o ur fi rm are r eceiving E SRM t raining, w hich e nables them to spot potential risks and engage with our ESRM team more effectively. In total, 950 Citi employees underwent ESRM training d uring 2 021, s ignificantly m ore t han in 2 020. A ll t raining i n 2 021 w as c onducted on live webinars for employees globally. 1. See Anthony D. Barnosky et al., Has the Earth’s Sixth Mass Extinction ... , 471 NATURE 51, 51 (2011); Gerardo Ceballos et al., Vertebrates on the Brink ... , 117 (24) PNAS 13596 (2020); Belinda Reyers & Elizabeth R. Selig, Global Targets that Reveal ... , 4 NATURE ECOLOGY & EVOLUTION 1011 (2020). Contents ESGatCiti SustainableFinance SustainableProgress Equitable&ResilientCommunities Talent&DEI RiskManagement&ResponsibleBusiness Appendices CITI 2021 ESG REPORT 118
2021 Projects Covered by the Equator Principles As part of our commitment to the Equator Principles (EP), we report annually on our implementation. A B C Funded EP Project Finance Loans Total = 2 Total = 7 0 2 2 5 0 0 Funded EP Project-Related Corporate Loans Category A — Projects likely to have potential significant adverse social or environmental impacts that are diverse, irreversible or unprecedented Category B — Projects likely to have potential limited adverse social or environmental impacts that are few in number, generally site-specific, largely reversible and readily addressed through mitigation measures Category C — Projects likely to have minimal or no social or environmental impacts FUNDED PROJECT FINANCE LOANS BREAKDOWN FUNDED PROJECT-RELATED CORPORATE LOANS BREAKDOWN By Sector A B C Total Oil & Gas 0 1 0 1 Mining 0 1 0 1 Infrastructure 0 1 0 1 Other 2 2 0 4 By Region A B C Total United States and Canada 0 0 0 0 Latin America 0 3 0 3 Europe 1 0 0 1 Middle East and Africa 0 0 0 0 Asia Pacific 1 2 0 3 By Country Designation A B C Total Designated * 0 0 0 0 Non-designated ** 2 5 0 7 By Independent Review A B C Total Yes 2 4 0 6 No 0 1 0 1 * D esignated Countries as defined by EP are high-income OECD countries. See the Equator Principles website for more information. ** N on-designated Countries as defined by EP are all non-OECD countries and all OECD countries not designated as high income. Note: Citi had no EP Project Finance Advisories, Acquisitions or Refinancings in 2021. By Sector A B C Total Power 0 1 0 1 Oil & Gas 0 1 0 1 By Region A B C Total United States and Canada 0 1 0 1 Latin America 0 1 0 1 Europe 0 0 0 0 Middle East and Africa 0 0 0 0 Asia Pacific 0 0 0 0 By Country Designation A B C Total Designated * 0 1 0 1 Non-designated ** 0 1 0 1 By Independent Review A B C Total Yes 0 2 0 2 No 0 0 0 0 Contents ESGatCiti SustainableFinance SustainableProgress Equitable&ResilientCommunities Talent&DEI RiskManagement&ResponsibleBusiness Appendices CITI 2021 ESG REPORT 119
ESRM Consultation Data The ESRM team is consulted in the early stages of potential transactions, as well as during select annual credit reviews in higher risk sectors or clients. The data on this page show the total transactions and client relationships screened by the ESRM team, regardless of whether a transaction proceeded to financial close. For more information on our ESRM Policy, including how we categorize loans, visit our Environmental and Social Policy Framework Citi received external assurance of our Equator Principles data from SGS. For our SGS Assurance Statement, see the Assurance section . 243 United States and Canada 151 Europe 143 Global (multiple regions) 113 Middle East and Africa 257 Asia Pacific 228 Latin America 1,135 2021 Total ESRM CONSULTATIONS 636 BY REGION BY SECTOR 68 Forestry & Agribusiness 44 Infrastructure & Transportation 47 Manufacturing & Industrials 175 Metals & Mining 222 Oil, Gas & Petrochem 120 Power (Including Renewables) 66 Other 2021 601 141 266 127 1,135 ESRM policy due diligence Flagged for additional ESRM due diligence under ESRM Policy triggers New transactions Annual reviews Sustainable finance products Green bonds, sustainablity-linked bonds or loans etc., screened against relevant International Capital Market Association principles Low risk Low risk or not subject to ESRM Policy - no further due diligene required 2020 319 100 66 151 Contents ESGatCiti SustainableFinance SustainableProgress Equitable&ResilientCommunities Talent&DEI RiskManagement&ResponsibleBusiness Appendices CITI 2021 ESG REPORT 120
Serving Our Customers and Clients Responsibly We have policies and systems in place to help ensure that we always treat customers responsi - bly and fairly, such as our Code of Conduct and the internal checks and balances we employ when creating new products. Responsible Marketing We a re c ommitted t o o ffering c lients a n array o f p roducts a nd s ervices b ased o n their needs, wants and preferences, while adhering to our internal policies and proce - dures as well as applicable laws and regula - tions. W e w ork d iligently t o c learly d isclose all f eatures a nd t erms a nd c onditions, including ap plicable f ees an d c harges, f or the p roducts a nd s ervices o ffered, s o t hat clients c an s elect a nd u se t he p roducts o r services b est su ited t o t hem. Our c hosen n ame i nitiative f or U .S. Branded credit card members offers transgender and nonbinary customers the ability to use their chosen first name on their e ligible c ard a nd w ithin o ur s ervicing channels. As of early 2022, more than 22,000 customers had updated their first name on their physical credit cards, and citi.com/updatemyname had received more than 210,000 visits. Most impor - tantly, we’ve received notes like this from customers: “I wish that there was some - thing like this when I began my transition. This will remove one of the many worries that we have all had when we were intro - ducing our true selves to the world.” To c elebrate t he l aunch o f t he c hosen name i nitiative, w e c reated a n a dvertising campaign featuring people from across the gender diversity spectrum, both in front of and behind the camera. This initia - tive has been a significant step forward in helping this community feel recognized, accepted and empowered. In recognition of its impact, the initiative was honored as one of Fast Company’s 2021 World Changing I deas. Another example of how we continue to amplify our purpose-driven initiatives is through Citi’s global, mission-led part - nership with the International Paralympic Committee, which focuses on positively changing societal perceptions of people with disabilities. Over the past several years of our partnership, Citi sponsored 23 National Paralympic Committees and more than 50 Para athletes across the globe in their quest to compete at the highest level. In Summer 2021, we celebrated our Team Citi Para athletes and showed the world that “It’s Okay to Stare” at the talents and accomplishments of the disability commu - nity through the #StareAtGreatness campaign. Our advertising and social media campaign successfully raised awareness of the incredible achievements of these athletes and others within the disability community, earning recognition as a finalist in two categories at the 2022 Halo Awards. In early 2022, Citi extended the #StareAtGreatness campaign with 15 sponsored Team Citi Winter Para athletes to continue driving conversations around the world. As part of Citi’s Action for Racial Equity goals, we are collaborating with our agency partners to increase the percent - age of people of color working on Citi accounts and to increase representation of people of color in our marketing. By the end of 2023, we aspire to achieve the following: Aim to increase representation in the agencies we work with • People of color making up at least 25% of the agency teams working on Citi accounts • People of color comprising at least 8% of senior agency leadership, in line with Citi’s own commitment DESIGNING FOR ACCESSIBILITY As we strive to put all customers at the center of what we do, we recognize the importance of providing products and services that meet accessibility needs and preferences. The videos our U.S. Branded Cards business creates to heighten customer comprehension of key topics are designed to be fully accessible. This includes real-time descriptive transcripts, embedded closed captions and content readability. In addition, we offer Braille and talking ATMs, large print and Braille statements and raised-line checks for the visually impaired. We also offer TTY or Text Telephone for the hard of hearing. Many of our services are provided in multiple languages to support the diverse populations we serve, and our products are tailored to meet the needs of the individuals in the countries where we do business. Contents ESGatCiti SustainableFinance SustainableProgress Equitable&ResilientCommunities Talent&DEI RiskManagement&ResponsibleBusiness Appendices CITI 2021 ESG REPORT 121
Aim to increase representation in our marketing • People of color making up at least 25% of casting for Citi marketing • Aim for at least 25% of brand stories highlighting m inority-owned b usinesses and organizations annually To cultivate greater diversity and inclusiv - ity in our marketing and communications, we collaborated with Getty Images to develop Diversity, Equity & Inclusion (DE&I) Imagery Toolkits. Each toolkit harnesses Getty Images’ proprietary data (Visual GPS) and Kantar’s Global MONITOR research to provide marketers, communi - cators and creatives with useful insights to create authentic and multifaceted depic - tions of people in our global marketing and communications. We began rolling out these toolkits in 2021, including in the United States, and will launch in additional markets in 2022. The toolkits feature coun - try-specific data and consumer insights to capture cultural and regional nuances, and custom training is provided to Citi employ - ees for each market. The toolkits will be available to the public on the Getty Images DE&I Imagery Toolkit hub . These initiatives are just some examples of our firm-wide commitment to promote activities that are in the best interests of our clients. More broadly, new products are approved b y c ross-functional co mmittees that include senior executives from Risk, Legal, our Independent Compliance Risk Management team and other relevant units, supported b y s pecialists f rom C onsumer Fairness, a s needed . C iti a lso do es p eri - odic testing or monitoring of marketing materials a nd d isclosures. I n a ddition, Personal B anking & W ealth M anagement has a global approach for handling customer complaints and concerns in a timely and effective manner, in line with our commitment to provide financial services responsibly a nd t reat c ustomers f airly. Helping Customers Give Back We offer our U.S. cardholders an opportunity to make a difference by turning their ThankYou ® Points into charitable gifts to nonprofits. In 2021, we joined the (RED)EEM initiative which enables eligible cardmembers to make donations with PayPal’s Pay with Rewards feature and supports organizations working to ensure equitable access to COVID-19 testing, treatment and vaccines in the world’s poorest countries. We also expanded the list of eligible organizations to include Susan G. Komen. The list also includes American Red Cross, No Kid Hungry, UNICEF USA and others. Since 2014, Citi’s support has also helped No Kid Hungry provide up to 290 million meals for the millions of kids facing hunger across America. In 2021, Citi encouraged clients to enroll their Citi credit cards in the Dine and Do Good campaign. For every $5 or more spent dining out, Citi donated $1 to No Kid Hungry until the $1 million donation goal was met. Additionally, on Giving Tuesday, Citi engaged colleagues and general consumers to help raise enough to provide more than 10 million meals in a single day, with Citi’s support alone driving 40% of dollars raised. No Kid Hungry is the only national campaign solely dedicated to ending childhood hunger. Contents ESGatCiti SustainableFinance SustainableProgress Equitable&ResilientCommunities Talent&DEI RiskManagement&ResponsibleBusiness Appendices CITI 2021 ESG REPORT 122
Eliminating Overdraft Fees for Our Customers’ Financial Wellness Citi recently announced plans to eliminate overdraft fees, returned item fees and overdraft protection transfer fees for U.S. Retail Banking consumers by Summer 2022. This makes Citi the only top-five U.S. bank (based on assets * ) to completely eliminate these fees, and it demonstrates our commitment to expanding access to inclusive banking products and services that can help advance economic progress, especially for underbanked and unbanked populations. For 20 years, we have put measures in place to minimize overdraft fees for our consumers in order to put their financial wellness first. In addition to the upcoming changes, Citi will also continue to offer a robust suite of overdraft protection transfer services for our consumers including: • Overdraft Protection Transfer Services: Citi offers two services that help consumers avoid checking account overdrafts and retutrned items — Safety Check and Checking Plus ® (variable rate) line of credit . The fees associated with these services will also be eliminated. • Access Account Package: Citi’s industry-leading, checkless account package with low or avoidable monthly charges provides consumers with a simple, transparent way to manage their finances and systemically limits point-of-sale, ATM and ACH transactions that could cause negative balances. • Common Sense Protection Measures: Citi will not authorize ATM or point-of-sale debit transactions in cases when funds are not available. • Low Balance Alerts: Consumers can enroll in Low Balance Alerts via their account online or through the Citi Mobile ® App. The elimination of overdraft fees complements many of our firm-wide Action for Racial Equity efforts in the United States that aim to expand banking and credit for communities of color. * https://www.bankrate.com/banking/biggest-banks-in-america/ . CITI’S TREATING CUSTOMERS FAIRLY PRINCIPLES We aim to deliver products and services that provide value, clarity and dependability, guided by the Treating Customers Fairly principles that define the standards for our products and services. These principles include: Works as described: Consumers can predict how products and services will work. Appropriate: Consumers can rely on Citi to offer appropriate products and services that meet their needs. Value: Consumers receive value that is reasonably related to the cost of the products and services. Ease of understanding: Consumers understand the terms and conditions of the products and services (particularly limitations and exclusions). In November 2021, we opened a new branch and Client Center at our global headquarters in New York City. Contents ESGatCiti SustainableFinance SustainableProgress Equitable&ResilientCommunities Talent&DEI RiskManagement&ResponsibleBusiness Appendices CITI 2021 ESG REPORT 123
Treating Customers Fairly Through Citi’s commitment to our Treating Customers Fairly principles and our Global Consumer Fairness Policy, we strive to earn and maintain the public’s trust by adhering to high ethical standards in conducting our business. The Global Consumer Fairness Policy provides a framework for reviewing consumer fairness concerns and a sustainable model for managing emerging risks. The policy covers all aspects of the consumer product and services life cycle, including new product development, marketing, sales (including variable incentive compensation), underwriting and onboarding, as well as all other stages. There are established, formalized escalation processes to Citi’s governance committees and Board of Directors that facilitate consistent, timely and appropriate identification, analysis and escalation of potential consumer fairness and reputational and franchise risk issues. In relation to designing variable incentive plans, we consider a number of factors, including whether plans align with our Treating Customers Fairly principles. For example, we leverage client satisfaction metrics, where available, along with other product-based metrics, to incentivize achieving business results that adhere to internal policies and our Code of Conduct. We routinely evaluate incentive plans, training content, controls, monitoring results and oversight activities to maintain a sales force that delivers on Citi’s commitment to serving our customers with fairness, value, clarity and dependability. As part of the program, Personal Banking & Wealth Management and Institutional Clients Group employees complete annual Treating Customers Fairly training to ensure they understand how to identify issues of fairness and how fairness influ - ences real-world results. The 2021 course was launched to more than 95,000 Citi employees globally. We also have measures in place to monitor sales practices, including auditing and metrics that assess client risk profiles. When appropriate, we proactively contact delinquent clients, using their credit risk profile and previous payment perfor - mance to determine how quickly and how often to contact them. We ensure that contact strategies are vetted for privacy and fairness considerations before implementation. The Global Financial Access Policy is a key component of our commitment to fair and equitable access to products and services. This policy establishes the guiding principles and minimum standards for fair, equitable and nondiscriminatory access to credit. Further, it prohibits discrimination against actual or prospective clients on the basis of race, ethnicity, sex (which encompasses gender as well as sexual orientation, gender identity and gender expression), religion, national origin, disability or other prohibited factors. This commitment is backed by training, processes, controls and oversight to prevent discrimination. In addition, we continually work to understand evolving discrimination risks and update our approach to preventing such risks in our business s trategies, a s w ell a s i n t he d esign and delivery of our products and services. True to our commitment to responsible finance, we hold an annual Fair and Inclusive Banking offsite with senior management from across the company, to deepen their understanding of fair lending, consumer fairness and accessibility. Contents ESGatCiti SustainableFinance SustainableProgress Equitable&ResilientCommunities Talent&DEI RiskManagement&ResponsibleBusiness Appendices CITI 2021 ESG REPORT 124
Human Rights Citi’s rigorous human rights policies, standards and due diligence practices guide our business and lending decisions. We consistently engage with our employees, suppliers, peers and industry experts, as well as civil society organizations focused on our clients and the projects we finance, to advance the protection of human rights. Our Commitment to Respect Human Rights We are committed to respecting human rights wherever we do business. We engage human rights experts, clients and peers to support our efforts to respect human rights in line with the UN G uiding Principles on Business and Human Rights — a global framework for preventing and addressing the risk of adverse impacts on human rights linked to business activity. The UN Guiding Principles draw upon existing international human rights instru - ments whose principles Citi has endorsed, such as those in the UN Universal Declaration of Human Rights and the International Labour Organization’s (ILO) Core Conventions. To illustrate our imple - mentation of the UN Guiding Principles, we have mapped how this ESG Report aligns with the UN Guiding Principles Reporting Framework ( see index ). Citi r egularly u pdates o ur p olicies a nd practices t o s trengthen o ur h uman r ights due d iligence. D uring t he de velopment and su bsequent u pdates o f o ur Statement on H uman R ights , w hich w e fi rst a dopted in 2 007, w e en gaged i nternal a nd e xternal stakeholders t o h elp a ssess ou r a ctual and p otential h uman r ights i mpacts a nd to i dentify t he m ost s alient h uman r ights risks f aced b y o ur e mployees, w orkers connected t o o ur su pply c hain a nd individuals w ho m ight b e a ffected b y o ur clients’ o perations. Citi’s Environmental and Social Risk Management ( ESRM) P olicy, su mmarized in o ur Environmental and Social Policy Framework , guides our approach to assess - ing environmental and social risks related to financing o ur c lients’ b usiness a ctivities. F or more information about our ESRM Policy and our related due diligence processes, see t he Environmental and Social Risk Management s ection of this report. We regularly review and update our ESRM Policy to ensure that it reflects our most recent understanding of potential envi - ronmental and social risks. For example, during 2021, we updated the Policy to include a formal prohibition against financing for companies whose primary business is constructing or operating private prisons. Although we do not have such clients directly connected to private prisons, we decided to formalize this policy prohibition for the future in alignment with our Action for Racial Equity commitments. ELEVATING ENVIRONMENTAL JUSTICE CONCERNS FOR ENHANCED DUE DILIGENCE Over the last several years, there has been growing global acknowledgment that climate change is a human rights issue. In 2021, the UN Human Rights Council recognized the right to a healthy environment as a stand-alone human right. Citi has also recognized for many years the right to a healthy environment and the need to evaluate the potential environmental risks to communities surrounding the industrial developments we finance. For example, due diligence related to environmental justice concerns is critical for identifying projects with significant impacts to local communities from fossil-fuel-related activities, including extraction, refinement and transportation or air and water pollution due to heavy industry. Environmental justice is also important as we consider low-carbon projects with positive environmental benefits that might have negative impacts on local communities. For example, a dam construction project to create renewable hydro-electric power could threaten human rights if it is sited without consideration of the rights of Indigenous or other marginalized peoples. While we want to champion projects that help combat climate change, we need to keep our eyes open to other adverse impacts that may occur, particularly in relation to already marginalized communities. As of 2020, we formalized environmental justice as a specific risk within the Areas of High Caution section of our ESRM Policy that triggers enhanced due diligence. Contents ESGatCiti SustainableFinance SustainableProgress Equitable&ResilientCommunities Talent&DEI RiskManagement&ResponsibleBusiness Appendices CITI 2021 ESG REPORT 125
Our Salient Human Rights Risks Citi has spent more than a decade seeking to understand and mitigate the most salient human rights risks related to our business — those that pose the greatest risk to people — including the activities of our clients and other business partners. The most severe potential risks posed to people by our clients’ activities, partic - ularly in the context of project-related finance, are identified under our ESRM Policy. Our work to address these risks began in 2003 when we helped to found the Equator P rinciples (EP) framework to enhance and standardize risk management across the banking sector, established an internal ESRM team, and began developing our risk identification and mitigation policies and procedures. While our formal ESRM processes give us the most leverage when we are directly financing a project, we also screen for human rights risks and opportunities to engage clients in other types of corporate financing covered by our ESRM Policy and in targeted ESRM portfolio reviews of high risk sectors or geographies. In addition, we work to identify and address salient human rights risks that could arise in other areas of our value chain such as our supply chain, our workforce and our consumer banking activities. For a full list of our salient human rights risks and the stakeholders they may impact, see the table on the following page. Efforts to achieve racial equity and promote diversity and inclusion relate directly to the protection of human rights, as these efforts seek to remedy disparities and protect in dividuals f rom d iscrimination o n the basis of essential characteristics. We have identified salient human rights risks in t his a rea, in cluding d iscrimination in t he provision of financial services and threats to diversity and inclusion. You can learn about C iti’s Action for Racial Equity commit - ments, established in 2020, and additional inclusion i nitiatives r elated t o o ur supply chain , o ur workforce and the communities we serve t hroughout t his r eport. For human rights concerns related to a particular client, transaction or portfolio, we escalate those issues to the relevant internal Reputation Risk Committee. In addition, in 2021, we established an Asia Pacific Human Rights Task Force, comprised of senior bankers and risk managers. The aim of the task force is to enable a more standardized approach to addressing salient human rights risks that arise in that region. For more information about our governance of ESG issues, including human rights, see the ESG Governance at Citi section . Contents ESGatCiti SustainableFinance SustainableProgress Equitable&ResilientCommunities Talent&DEI RiskManagement&ResponsibleBusiness Appendices CITI 2021 ESG REPORT 126
Salient Human Rights Risks: Stakeholder Impacts This table illustrates which stakeholders could be impacted by the human rights risks we have identified as most salient to our company. Rows shaded in gray indicate risks related to the Areas of High Caution defined in our ESRM Policy and trigger additional due diligence for project transactions, general corporate purpose transactions and regular reviews of client relationships. Additional context about our approach to mitigate these risks and related due diligence processes can be found throughout this report, in our Statement on Human Rights and in our Environmental and Social Policy Framework . Human Rights Risks Citi’s Employees Suppliers’ Employees Customers and Clients Those Affected by Clients’ Operations Adequate standard of living; right to property Conflict risk Discrimination in the provision of financial services Diversity and inclusion; discrimination in the workplace Indigenous Peoples Information security; privacy Labor practices (including modern slavery) Resettlement Security practices Contents ESGatCiti SustainableFinance SustainableProgress Equitable&ResilientCommunities Talent&DEI RiskManagement&ResponsibleBusiness Appendices CITI 2021 ESG REPORT 127
Addressing Forced Labor in Malaysia Migrant laborers have the potential to become the victims of forced labor practices, due largely to the significant debt they incur through the process of recruitment, obtaining travel documentation and gaining entry into a foreign country. During 2021, this issue gained heightened attention due to the increased focus of the U.S. Customs and Border Patrol on migrant working conditions, with the agency issuing a number of Withhold Release Orders refusing entry of products into the U.S. market that were suspected of being made in whole or in part by forced labor. This included several Malaysian companies involved in the manufacture of personal protective equipment and palm oil products. When migrant workers arrive in Malaysia, they sometimes find that the salaries they earn are too low to cover the cost of repaying recruitment fees and expenses. Compounding the problem, their employers often withhold employee identity documents. This can put migrant workers in a precarious position as they are dependent on their job to repay their debts and, if they face challenging working conditions, they may be unable to look for other employment given the inaccessibility of their work permits and identity documents. Citi has a longstanding prohibition against providing financing to any company that uses forced labor practices as defined by the ILO’s 11 Forced Labour Indicators. The Citi Malaysia team partnered with our global ESRM team to conduct a portfolio review in Malaysia to determine which Citi clients may have higher risk for potential forced labor practices and whether those clients have policies and procedures in place to address that risk. Out of hundreds of corporate and subsidiary client relationships reviewed, we identified 29 in higher-risk sectors with high migrant labor employee populations that required enhanced ESRM due diligence to assess client practices against international labor practices. In situations where this review uncovered high risks that were not adequately addressed through company policies and practices, or when credible accusations of forced labor existed, we engaged those clients on improvements needed. When necessary, we required clients to bring in labor rights experts to audit and suggest improvements for their policies and procedures, and we set up regular meetings to assess progress to close these gaps. While this is an important step, we also acknowledge that due to the long history of precarious migrant labor working conditions in Malaysia, and in other countries that rely on similar systems, it will take time and continued work to raise awareness to change ingrained practices. With this in mind, Citi Malaysia and the ESRM team took an additional step to educate clients and raise awareness by working with a forced labor expert to develop a webinar for our Malaysian clients. This webinar focused on international standards based on the ILO’s Forced Labour Indicators, risk identification methodologies and best practices for preventing forced labor in corporate operations and supply chains, such as employer payment of recruitment fees, reimbursement of debt, ethical recruitment procedures, employee access to identity documents, and proper pay, overtime management and grievance mechanisms. More than 100 clients in Malaysia attended this webinar and it was very well received. Learn more about this issue on the U.S. Customs and Border Protection and ILO websites. Contents ESGatCiti SustainableFinance SustainableProgress Equitable&ResilientCommunities Talent&DEI RiskManagement&ResponsibleBusiness Appendices CITI 2021 ESG REPORT 128
Respecting the Human Rights of Our Employees We expect every Citi employee to adhere to our Code of Conduct , which includes a commitment to human rights, and to participate in relevant training. Our Code of Conduct prohibits unlawful discrimina - tion, harassment and other behavior that infringes on individual rights. As stated in our Code of Conduct, Citi expects all employees, as well as suppliers, clients and community partners globally to respect the principle of nondiscrimination. Citi has identified workplace discrimination and threats to diversity and inclusion as salient human rights risks for our company. As such, respect for diversity and inclusion is a high priority wherever we operate. It can become a particular concern in countries where there is no legal p rotection a gainst d iscrimination based on gender, gender identity, race, ethnicity, age, religion, physical or mental disability or medical condition, or sexual orientation, in addition to a range of other essential characteristics inherent to iden - tity and personhood. Citi prohibits discrim - ination and harassment of our employees in all forms, regardless of whether or not individual protections are legally mandated in the countries and communities where we operate. In fact, we know that even in locations with anti-discrimination laws, there is still a need for companies to ensure that they are doing their part to respect individual rights. In 2021, we established a team in the United S tates t o i dentify a nd a ccelerate hiring o f d iverse t alent. W e a lso s trive t o increase t he d iversity o f o ur w orkforce through t he u se o f d iverse s lates i n o ur hiring p rocess a nd b y s etting a spirational goals r elated t o di verse r epresentation for A ssistant V ice P resident t o M anaging Director l evels. C iti h as a lso s igned t he Human R ights C ampaign’s Business Statement O pposing A nti-LGBTQ+ S tate Legislation . L earn m ore a bout o ur diversity, e quity a nd i nclusion e fforts in t he Talent a nd D iversity , Equity & Inclusion s ection . Freedom of Association Citi has employees who are represented by unions and works councils in a number of countries where we operate. In addition, a portion of our employee population is covered by collective bargaining agreements. We engage directly with our employees and through these associations to discuss issues such as health and safety, remuneration, work hours, training, career development, work time flexibility and equal opportunity. Information related to freedom of association is communicated to employees through various mediums, including employee handbooks, our intranet and employee emails. Extending Respect for Human Rights Through Our Suppliers Our nondiscrimination policies extend to Citi’s suppliers, and we do not work with suppliers that are discovered to discriminate on the basis of personal characteristics, such as gender, race and sexual orientation. Since 1977, we have used our supplier diversity program to empower communities around the world. We communicate our approach to human rights to our suppliers in our Statement of Supplier Principles . Our approach is reinforced by our Corporate Responsibility Questionnaire (CRQ). This questionnaire helps our procurement team determine how potential and current suppliers manage environmental and social issues, including human rights issues. Building on our prior efforts, we have updated and expanded our CRQ to improve supplier engagement and evaluation of their operations. The latest assessment expands on our previous questions in the areas of modern slavery, supplier diversity, environmental sustainability, corporate responsibility, labor rights and workplace safety. In addition, we have introduced additional screening related to modern slavery for suppliers in high-risk sectors and countries. Citi is committed to SDG 8 , which aims to promote sustained, inclusive and sustainable economic growth, full and productive employment and decent work for all . This is exemplified by our work to fight modern slavery in our value chain, along with our related reporting, policies, due diligence and risk assessments. In particular, our initiatives in these areas address target 8.7 , which includes a mandate to eradicate forced labor, end modern slavery and human trafficking and end child labor in all its forms . SDG Goal 8: Decent Work and Economic Growth MODERN SLAVERY DISCLOSURES Each year, we disclose our approach to identifying and mitigating the risks of modern slavery in our operations (including client transactions) and in our supply chain. The disclosures cover information about our governance and policies related to modern slavery, risk assessment and due diligence processes, and training. In 2021, we released our first Modern Slavery Statement specific to Australia. Contents ESGatCiti SustainableFinance SustainableProgress Equitable&ResilientCommunities Talent&DEI RiskManagement&ResponsibleBusiness Appendices CITI 2021 ESG REPORT 129
Respecting Human Rights in Our Financing Decisions Effectively evaluating human rights risks related to our clients and the projects we finance is challenging. We work diligently to meet this challenge and respect the human rights of the individuals and communities impacted by the clients we finance and their projects. We have established policies and practices that help us influence the protection of human rights. For instance, our anti-money laundering efforts help us prevent crimi - nally sourced funds — including funds asso - ciated with human rights abuses, such as human trafficking — from passing through our bank. Disrupting the flow of money to those perpetrating human rights abuses and denying those abusers safe harbor for illicit proceeds tied to corruption or human rights violations are effective ways to undermine their efforts. Additionally, under our U.S. Commercial Firearms Policy, adopted in 2018, we require clients or partners that are U.S. firearms retailers or firearms manufacturers that sell through U.S. retail channels to adhere to a set of best practices regarding the sale of firearms. For retailers, these practices include selling firearms only to individuals who have completed a background check, not selling high-capacity magazines or bump stocks (which modify semiautomatic firearms to fire faster, at rates comparable to fully automatic firearms), and selling firearms to individuals under age 21 only if they have received firearms safety training (e.g., as part of active or former military or law en forcement em ployment o r v ia hu nter safety training). For manufacturers, best practice entails selling firearms only to retailers that follow these same practices. Such examples illustrate our ability to proactively avoid certain business trans - actions with adverse impacts on human rights, but other situations can occur in which the link between our financial services and human rights impacts is less direct. That complexity may mean we have less leverage, and it diminishes our ability to ensure that on-the-ground outcomes are consistent with Citi’s values. In these instances, we work to improve our clients’ awareness and business practices. In addition, where a transaction’s financial and legal structure allows it, we put loan covenants in place and monitor mitigation efforts through our ESRM systems and corrective action plans. Due Diligence in Client Transactions Citi has thousands of corporate and insti - tutional clients. The UN Guiding Principles acknowledge the challenges presented by extensive business relationships, and we have adopted the approach set out in the UN Guiding Principles of prioritizing our due diligence and risk mitigation first in areas where the risk of adverse human rights impact is most significant from the perspective of the people who may be affected. We use our ESRM Policy, where applicable, to assess and manage risks consis - tently and to evaluate client operations against a common set of standards grounded in international best practice, including the UN Guiding Principles on Business and Human Rights, ILO Forced Labour Indicators, Voluntary Principles on Security and Human Rights, and International Finance Corporation (IFC) Performance Standards, among other international human rights norms and emerging standards. Our ESRM team screens transactions covered by our ESRM Policy during the initial marketing Contents ESGatCiti SustainableFinance SustainableProgress Equitable&ResilientCommunities Talent&DEI RiskManagement&ResponsibleBusiness Appendices CITI 2021 ESG REPORT 130
phase to identify potential heightened environmental or social risks related to the client. Our policy prohibits financing any project for which our due diligence identifies the use of forced labor, harmful or exploitative child labor, or when the relevant labor forces have been subjected to human trafficking. Under the ESRM Policy, Citi screens for human rights risks in project-related transactions and clients subject to ESRM sector-specific requirements. In addition, the ESRM Policy includes Areas of High Caution, which identify flags for heightened human rights risk factors to escalate to the specialized ESRM team for review regardless of finan - cial product or sector. If, d uring o ur i nitial s creening f or a t rans - action, w e fi nd a r isk o f a dverse i mpacts, we c onduct m ore i n-depth d ue d iligence, and w e e valuate t he c lient’s c ommitment and c apacity t o a void, m itigate a nd/or manage t hose i mpacts i n a ccordance with i nternational i ndustry b est p ractices and h uman r ights n orms a nd t he c lient’s willingness t o c ontinuously i mprove. W e escalate t he m ost c hallenging c ases w ith the h ighest p otential f or a dverse i mpacts to s enior b usiness a nd r isk m anagers f or collective d iscussion o n t he r isks a nd t he client’s c ommitment a nd c apacity. I n s ome cases, s enior m anagement w ill c onclude that t he l ikelihood f or a dverse i mpacts is t oo g reat — p osing a n i mminent t hreat to p eople o r c ommunities — a nd w e w ill decline i nvolvement i n t he t ransaction. I n severe c ircumstances, w here w e c annot otherwise e ffectively i nfluence di fferent human r ights o utcomes d espite o ur b est efforts o f su stained e ngagement, w e w ill end t he c lient r elationship. T his i s a m ove we t ake v ery s eriously, s ince w e r ecognize that i t c an h ave a n umber o f r amifica - tions, i ncluding r emoving a ny l everage we m ight o therwise h ave h ad t o i mprove practices o ver t ime t hrough c onstructive engagement. After the financial close of a transaction or a client onboarding that was subject to a time-bound environmental and social action plan, we monitor the company’s implementation of those actions. For project-related transactions this often involves the retention of an independent environmental and social risk consultant who periodically reports to lenders after on-the-ground audits. In addition, for non-project related transactions where human rights risks have been flagged for ongoing monitoring, our ESRM team uses annual client credit reviews as touchpoints to assess progress on human-rights- related issues. Protection of Indigenous Rights in Latin America Citi understands that Indigenous Peoples’ distinct identities, languages, beliefs, cultural values, lands and use of natural resources may be under threat, representing a higher degree of vulnerability. Activities that may impact Indigenous People have long been acknowledged as an Area of High Caution under our ESRM Policy, and require enhanced due diligence. In 2021, we put additional emphasis on the evaluation of our Latin American oil and gas clients and mining clients during new trans - actions and annual credit reviews, to continue identifying clients with operations that may overlap Indigenous territories. All clients were assessed on their community engagement and biodiversity management practices. When overlap with Indigenous territories was identified, Citi engaged clients to assess how they incorporated free, prior and informed consent into their engagement practices with Indigenous Peoples. Contents ESGatCiti SustainableFinance SustainableProgress Equitable&ResilientCommunities Talent&DEI RiskManagement&ResponsibleBusiness Appendices CITI 2021 ESG REPORT 131
Identifying Human Rights Risks in Transactions Citi’s ESRM team screens transactions under the ESRM Policy for potential human rights risks. The specific types of human rights risks we screen for are outlined in the table below. Further data related to ESRM Policy screening can be found in the Environmental and Social Risk Management sectio n . When human rights risks are identified for a project-related transaction during screening, the ESRM team may either decline to approve the oppor - tunity outright, if the risks are deemed too high to address, or we may outline what further due diligence would be needed for the transaction to proceed. There are a number of reasons why initial opportunities may not move forward, including a client declining to move forward with our due diligence review requirements. If an opportunity progresses to the due diligence phase, our requirements include gaining access to project information that allows us to benchmark according to relevant standards, such as the IFC Performance Standards, UN Guiding Principles on Business and Human Rights, ILO Forced Labour Indicators and the Voluntary Principles on Security and Human Rights among other international human rights norms. In project-related lending this due diligence would be supported by a qualified independent consultant. In circumstances where a project is not aligned with applicable international standards, we will not approve financing until we are satisfied that the client has appropriate plans and capacity to mitigate project risks. For example, in 2021 we declined a project-related financing opportunity for an industrial agricultural project in Africa with concerns related to involun - tary resettlement, child labor and biodiversity impacts. For general corporate-level transactions (e.g., renewing revolving credit facilities, issuing corporate bonds) that have elevated human rights risks, we have less direct leverage than in project-related financing, but we review our clients’ policies and practices relevant to human rights issues to evaluate their ability to avoid, manage and minimize these risks. We also engage our clients to understand their implementation of those policies and whether they have appropriate staffing to manage these issues, and we review and encourage strong disclosures of human rights policies. Human Rights Risks Screened During Transaction Reviews Conflict Risk: Project-induced conflict risk, which may be tied to competition for resources or land Cultural Heritage: Properties and sites of archaeological, historical, cultural, artistic and religious significance; unique environmental features and cultural knowledge; intangible forms of culture embodying traditional lifestyles Environmental Justice: Potential environmental risks to historically marginalized communities, especially surrounding industrial developments Indigenous Peoples: Concerns regarding the extent to which Indigenous communities are consulted during project development and have consented to impacts to their land, livelihood and cultural heritage Labor Risks: Risks related to labor forces used in the construction of projects or other operations, including those associated with forced labor, child labor and human trafficking by project operators and their subcontractors Resettlement: Resettlement of local communities, including Indigenous groups, as necessary for project implementation; requires resettlement action plans and should include efforts to gain the free, prior and informed consent of Indigenous communities Security Practices: Concerns about how project sponsors engage with public or private security forces protecting project sites Water: Project-related impacts that hinder access to water or negatively affect water quality for local communities Contents ESGatCiti SustainableFinance SustainableProgress Equitable&ResilientCommunities Talent&DEI RiskManagement&ResponsibleBusiness Appendices CITI 2021 ESG REPORT 132
Providing Access to Remedy The UN Guiding Principles call on governments and companies to play their respective roles in ensuring that victims of human rights abuse have access to effec - tive remedy. Remedy can take many differ - ent forms, including apologies, financial or nonfinancial compensation, or efforts to prevent future harm through policy commitments and changes in operational practice. The purpose of remedy is to help make victims whole again or to restore them, as much as possible, to their lives and enjoyment of their rights before those rights were violated. Remedy can also help ensure that they and others will not suffer similar harm in the future. When we are made aware of a potentially severe a dverse hu man r ights im pact, our a pproach t o r emedy u sually i nvolves working w ith c lients t o e nsure t hey h ave t he right policies in place and that channels are available to enable victims to lodge griev - ances. In addition, in line with our ability to p rioritize a dverse im pacts b ased o n severity, we will encourage clients to follow up on allegations and to have established processes to offer remedy or to cooperate with a uthorities t o m ake su re e ffective remedy is provided. For example, in 2021, as t he r esult o f o ur p ortfolio r eview i n Malaysia related to forced labor and related client en gagement, s everal c lients h ave improved their practices in this area, or are in the process of doing so, by providing workers c ompensation f or r ecruitment f ees and c onstructing b etter ac commodations to house those working for them. Learning and Engagement Engaging Stakeholders To ensure that we are living up to our commitment to respect human rights and anticipate emerging risks, we regularly communicate our approach externally, engage with stakeholders on their issues of concern and work to advance respect for human rights more broadly. During 2021, we led an Equator Principles Association collaboration with Shift to develop enhanced guidance for EP finan - cial institutions for evaluating adequate grievance mechanisms and access to remedy. Citi is also a member of the Shift Financial Institutions Practitioners Circle, through which we participate in workshops related to skill building on human rights due diligence for ESRM practitioners and deep dives into emerging salient human rights risks. This collaboration has helped us refine our approach to forced labor and human rights in the Asia Pacific region. In addition, we continued to pay close attention t o h uman r ights i ssues ra ised by s takeholders r egarding s pecific i ndus - tries. I n 2 021, c oncerns w ere ra ised b y stakeholders relating to the oil and gas, manufacturing, technology and palm oil sectors. We engage with these industries directly t hrough c lient r elationships, s take - holder meetings and active participation in relevant initiatives. For instance, our partic - ipation in the Roundtable on Sustainable Palm Oil enables us to engage with multiple stakeholders c onnected t o t he p alm o il value chain, to improve the collective effort to reduce human rights risks associated with this commodity. In addition, our touch points during annual reviews allow us to evaluate human rights risks and manage - ment t hrough c lient en gagements. Although banks are often under pressure to disclose specific findings related to client projects, we are bound by legal requirements related to confidentiality that limit our ability to disclose such infor - mation without client consent. As a result, addressing requests for transparency is a balancing act between protecting the confidentiality of our clients’ information and disclosing information to stakeholders as appropriate to advance the protection of human rights. Reporting Mechanisms for Stakeholders Our Ethics Hotline provides a way for our employees, suppliers and other external stakeholders, including the public, to report concerns about unethical behavior to Citi’s Ethics Office. Stakeholders and whistleblowers can report violations to the Ethics Hotline using a 24-hour phone line, email address, fax line, website or physical mailing a ddress. In addition, for project-related finance, we apply the Equator Principles to assess and manage environmental and social risks. This includes an assessment of the project sponsor’s stakeholder engagement process, as well as its operational-level grievance mechanisms that allow affected communities to raise concerns proactively with the project developers. Employee Training Human rights content is integrated into the training we provide for the employees responsible for implementing our ESRM Policy and in our Code of Conduct train - ing, which is required of all employees. In recent years, we have developed a comprehensive training module on modern slavery, which we provided to our Resource Management Organization (our employees responsible for procurement and supply chain activities). In 2021, we updated that training with the goal of expanding it to other functions globally. Contents ESGatCiti SustainableFinance SustainableProgress Equitable&ResilientCommunities Talent&DEI RiskManagement&ResponsibleBusiness Appendices CITI 2021 ESG REPORT 133
Responsible Sourcing As a global firm that engages with thousands of suppliers across the world, our commitment to responsible sourcing can have wide-ranging effects. Citi’s goal is to have a positive impact on people, the environment and the economy through our supply chain decisions. We seek to work with suppliers that share our values, and we set high standards for performance, measurement and responsible business practices. We are committed to providing more opportunities for certified diverse suppli - ers. Citi’s Supply Chain Development, Inclusion and Sustainability (SCDIS) Program provides the framework and governance that guide Citi employees to make sourcing decisions that support inclusive processes and increase our roster of diverse suppliers. Additionally, the SCDIS Program works across our supply chain to enhance sustainability practices, while mitigating social and environmental risks for all suppliers. Supplier Diversity Citi is committed to integrating supplier diversity across our entire business. Our SCDIS team sets clear supplier diversity goals and embeds them in our sourcing processes. Every bid over $250,000 requires the consideration of diverse firms. Promoting the inclusion of diverse suppli - ers in the bidding process helps us to build a supplier base that more fully represents the communities we serve. Racial Equity One o f C iti’s Action for Racial Equity commitments is investment in Black entrepreneurship, which includes a goal to increase our overall spend with certified diverse s uppliers t o $ 1 b illion a nnually, including $ 250 m illion w ith B lack-owned firms. We achieved over $1 billion in diverse supplier s pend i n 2 021. W e h ave a lso e stab - lished a task force that meets bi-weekly to r eview p rogress a gainst o ur su pplier diversity g oals, e valuate s pend w ith di verse suppliers a nd d iscuss n ew o pportunities with b roader i nitiatives ac ross t he c ompany. In 2 021, w e i ntroduced m ore t han 2 00 diverse su ppliers, w ho h ave e xpertise i n information t echnology s taffing, l earning and d evelopment, c ustomer e xperience, neurodiversity, c areer en try, a nd a dvertising and marketing, to Citi business leaders. Supplier Policies Citi has detailed standards and policies, which guide responsible sourcing initiatives and communicate our expectations related to environmental and social issues to our suppliers: • The Citi Statement of Supplier Principles outlines the foundational guidelines for our sustainable supply chain initiatives, including those related to human rights in the workplace, ethical business practices, implementation of required management systems and environmental sustainability. • The Citi Requirements for Suppliers provides detailed processes and procedures that our suppliers must follow for contractual compliance and facilitates awareness of other key Citi policy obligations. • We also ask suppliers to abide by the Citi Statement on Human Rights . For more information about our approach in this area, see the Human Rights section . Consistent with applicable modern slavery regulations, Citi publishes disclosures outlining our approach to identifying and mitigating the risks of modern slavery in our operations and supply chain. 2021 SPENDING WITH TIER 1 * DIVERSE SUPPLIERS $1,212M spent with Tier 1 diverse suppliers ** $432M spent with Tier 1 Black-owned suppliers $172M spent with Tier 1 women-owned suppliers * Tier 1 suppliers are those Citi procures goods and services from directly. ** This includes spend with many types of diverse suppliers, including Black-owned and women-owned fi rms. Contents ESGatCiti SustainableFinance SustainableProgress Equitable&ResilientCommunities Talent&DEI RiskManagement&ResponsibleBusiness Appendices CITI 2021 ESG REPORT 134
In addition to increasing our spend with diverse su ppliers, w e h ave a n Action for Racial Equity commitment to strengthen Citi’s policies and practices to become an anti-racist i nstitution. T his i ncludes e xpand - ing C iti’s c apital m arket a ctivities w ith minority-owned b roker-dealers t o a ssist with b usiness an d f ranchise d evelopment. In 2021, we engaged diverse broker- dealers to participate in 92% of Citi’s benchmark debt issuances, including 100% of our USD transactions. During the year, we also issued our first Citi Social Finance bond, with a notional value of $1 billion. For this transaction, we worked with a syndicate of minority- and women-owned businesses, of which Black-owned broker- dealers comprised approximately 20%. In addition, to commemorate Martin Luther King Jr. Day, we worked exclusively w ith Black-owned b roker-dealers to syndicate a $2.5 billion bond issuance. To promote additional opportunities, we host an annual breakfast, during which our diverse broker-dealers can share best practices and network with Citi leaders. Women-Owned Businesses Citi is committed to procuring goods and services from women-owned businesses and identifying opportunities for these firms, with an emphasis in developing markets. In 2021, we procured $172 million in goods and services from women-owned businesses. During 2021, Citi participated in WEConnect I nternational sessions for women-owned bu sinesses g lobally, that emphasized diversity and supply chain development and sustainability. We also joined WEConnect matchmaker and supplier showcase sessions in Latin America that enabled women-owned businesses to present their capabilities and make connections with Citi’s procure - ment colleagues. Similarly, Citi Indonesia was part of capacity-building workshops held by WEConnect to strengthen market access for women-owned businesses. We worked with the Women’s Business Enterprise National Council (WBENC) to expand our Bridge built by Citi SM program, a lending platform that connects businesses with local banks for loans. Through this partnership, Citi collaborated with WBENC to identify more than 2,000 women-owned businesses based in locations where the Bridge built by Citi program lending oppor - tunity is available to them. Additionally, we rolled out an initiative with our major IT suppliers in India to further the participation of women in technology. This included sessions with suppliers to discuss best practices for recruitment, hiring, retention and career progression for women, as well as a “Return to Career” program focused on bringing women back into the workforce who were on sabbatical or long leave. Our efforts to support women-owned businesses align with SDG 5: Achieve gender equality and empower all women and girls . Our work in this area helps address target 5.5 , which aims to ensure women’s full and effective participation and equal opportunities for leadership at all levels of decision-making in political, economic, and public life . SDG Goal 5: Gender Equality Building Capabilities of Diverse Suppliers The SCDIS team provides U.S.-based small firms and women-, veteran-, disability-, LGBTQ+- and minority-owned businesses access to business opportunities, training and mentoring. Our team identifies diverse suppliers, including small businesses that can meet our supply chain needs, then subsequently works to build their capabilities. In 2021, we established our Mentor- Protégé program, designed to strengthen our diverse suppliers’ capabilities and expand their opportunities both inside and outside Citi. Through this program, Citi connects established Tier 1 suppliers with minority-, Black-, and/or women-owned Tier 2 suppliers in a mentoring relation - ship. This provides smaller, diverse suppli - ers with an opportunity to gain valuable experience in financial services and build important skills to help them compete in the marketplace. One successful pairing within this program is that of mentor company Tata Consultancy Services (TCS), a Tier 1 supplier offering IT & Operations services to Citi, and protégé firm Technology Concepts Group International (TCGi), a Black-, woman-owned supplier that provides IT services to TCS for the benefit of Citi. The unique element of this pairing is that TCS has contextualized and structured the mentorship around TCGi’s current challenges and shifted gears from COLLABORATING TO BUILD SUPPLIER DIVERSITY In addition to advancing our own supplier diversity, our SCDIS team engages with others to support broader supplier diversity efforts. Our memberships with mission-centric organizations include the National LGBT Chamber of Commerce, WEConnect International, WBENC and the National Minority Supplier Development Council (NMSDC) along with several of its global part - ners, including the Canadian Aboriginal and Minority Supplier Council, the South African Supplier Diversity Council, Minority Supplier Development UK and Supply Nation in Australia. Contents ESGatCiti SustainableFinance SustainableProgress Equitable&ResilientCommunities Talent&DEI RiskManagement&ResponsibleBusiness Appendices CITI 2021 ESG REPORT 135
training to capability building. As a result, TCGi is building holistic expertise including technical, functional and soft skills. We continue to host events for diverse businesses across the globe to share best practices for doing business with Citi and other large companies. Our global “Doing Business with Citi” session is open to any supplier affiliated with select diversity certification agencies. The 2021 event had nearly 700 attendees, most of whom were diverse suppliers. In addition, Citi participated in the NMSDC Emerging Entrepreneurs Program, which includes a new mentoring approach called Success Circles. Entrepreneurs are placed with a group of experts who use their collective talents and connections to help the entrepreneurs build their businesses. Citi also provided a scholarship to the Tuck School of Business Minority Business Enterprise Program as part of this initiative. During 2021, we collaborated with the New York & New Jersey Minority Supplier Development Council to host the 11th annual Sustainability Symposium, where Citi hosted and moderated a Sustainability panel. Panelists shared perspectives on supply chain sustainability, ESG metrics, human rights, net zero carbon emissions programs and the impact of COVID-19 on business growth. The panel included leaders from Citi, UN Women, Ernst & Young and Accenture. We continue to support the Broad-Based Black Economic Empowerment (BBBEE) program in South Africa, maintaining a Level 3 BBBEE Scorecard for the inclusion of diverse suppliers during 2020/2021 for local operations. Supplier Engagement and Evaluation Since 2013, the SCDIS team has used a Corporate Responsibility Questionnaire (CRQ) to gauge how effectively our suppli - ers are managing critical issues, such as human rights, environmental manage - ment, health and safety, labor practices and diversity. In 2020, we began rolling out an updated version of this evaluation tool, which includes an expanded assessment in the areas of modern slavery, supplier diversity, environmental sustainability, corporate responsibility, labor rights and workplace safety. This latest version of the CRQ brings more rigor to our supplier assessment process and will continue to raise the bar for our ESG practices across Citi’s supply chain. It is also helping raise awareness about supply chain corporate 2021 Corporate Responsibility Questionnaire (CRQ) Surveys Completed 277 Mexico 1,049 North America 277 Latin America 192 Europe, Middle East, and Africa 1,133 Asia Pacific The CRQ is available in 13 languages: • Arabic • English • French • German • Hungarian • Japanese • Korean • Portuguese • Russian • Spanish • Turkish • Simplified Chinese • Traditional Chinese Contents ESGatCiti SustainableFinance SustainableProgress Equitable&ResilientCommunities Talent&DEI RiskManagement&ResponsibleBusiness Appendices CITI 2021 ESG REPORT 136
responsibility with our colleagues across the company. Our goal is for all suppliers to complete the CRQ every two years. This helps improve environmental and social practices throughout our supply chain. Supply Chain Sustainability Focus Areas Citi has three sustainability focus areas for our supply chain: paper and paper products, IT hardware and e-waste disposal, and travel and logistics. We have developed actions for each of these areas and incorporated them into our supply chain Global Operating Procedures. As a result of choosing EPEAT-certified options for 99% of our deployed servers, laptops, desktop computers, monitors and mobile phones, we estimate an energy savings of 273 million kilowatt-hours and a greenhouse gas reduction of 57,200 metric tons of CO 2 over the life cycle of the products. In support of responsible forestry, Citi made a commitment in 2020 to use Forest Stewardship Council (FSC) Chain of Custody-certified paper for the outer envelopes used for statements and customer communications. During 2021, we made the transition to and began using FSC-certified paper for outer envelopes. We also began integrating a requirement for FSC-certified bulk roll paper (used for printing statements) into our Request for Proposal (RFP) process. However, we have paused this effort due to global supply chain disruptions that have posed serious challenges to sourcing adequate amounts of FSC-certified paper. We will reassess whether it is possible to move forward with updated RFPs in 2022 and continue to advance our use of digital alternatives. Contents ESGatCiti SustainableFinance SustainableProgress Equitable&ResilientCommunities Talent&DEI RiskManagement&ResponsibleBusiness Appendices CITI 2021 ESG REPORT 137
Appendices In This Section 139 GRI Content Index 150 Sustainability Accounting Standards Board Index 155 The Principles for Responsible Banking Index 168 Task Force on Climate-related Financial Disclosures Index 170 United Nations Global Compact Index 172 United Nations Guiding Principles Reporting Framework Index 176 Assurance Contents ESGatCiti SustainableFinance SustainableProgress Equitable&ResilientCommunities Talent&DEI RiskManagement&ResponsibleBusiness Appendices CITI 2021 ESG REPORT 138
GRI Content Index We prepared this report in accordance with the GRI Standards: Core option. We also reported on many disclosures beyond the Core reporting op - tion, including disclosures from the Financial Services Sector Supplement. The following index provides readers with references for where they can find information in this report and other public documents addressing GRI disclosures relevant to our business. All disclosures are reported fully. Please visit the GRI website for the full text of the disclosures and other information on the GRI reporting framework. Disclosure Number and Title Report Section or Other Documentation GRI 102: General Disclosures 2016 102-1 Name of the organization Citigroup Inc. 102-2 Activities, brands, products, and services • Citi at a Glance • 2021 10-K pages 4-6, 14, 20, 22, 24, 26 and 28 102-3 Location of headquarters 388 Greenwich St., New York, NY 10013 102-4 Location of operations • Citi at a Glance • Citi Website — Countries and Jurisdictions 102-5 Ownership and legal form • 2021 10-K pages 1 and 4 102-6 Markets served • Citi at a Glance • 2021 10-K pages 4-9, 14, 20, 22, 24, 26 and 28 102-7 Scale of the organization • Citi at a Glance • 2021 10-K pages 4-9 102-8 Information on employees and other workers Citi may engage external service providers who may be responsible for performing noncore business activities or engage nonemployee resources who are employed by an external third party but support Citi processes. These nonemployee resources could be working under Citi supervision or be working under the supervision of an external third party in the third party’s facility. Citi may engage external service providers or nonemployees for a variety of different business purposes, including project-based work for a defined period of time, specialized/niche skill sets that are not readily available or professional and outsourced services. There are no significant variations in employment numbers (such as seasonal variations in employment). • Employment Data • 2021 10-K pages 62-64 102-9 Supply chain • Action for Racial Equity • Responsible Sourcing 102-10 Significant changes to the organization and its supply chain • 2021 Annual Report 102-11 Precautionary Principle or approach As discussed in the respective sections of this report, we evaluate and address risks as part of our Environmental and Social Risk Management (ESRM) efforts. Our ESRM Policy prohibits activities we believe pose risks to us, our clients and our stakeholders. This may include taking precautionary actions. 102-12 External initiatives • Environmental and Social Policy Framework 102-13 Membership of associations • Citi at a Glance • Stakeholder Engagement at Citi • Climate Risk and Net Zero > Climate Risk in Our Maritime Shipping Portfolio • Risk Management > Industry Collaboration • Citi Political Activities Statement Trade Associations • Environmental and Social Policy Framework 102-14 Statement from senior decision-maker • Letter from Our CEO Contents ESGatCiti SustainableFinance SustainableProgress Equitable&ResilientCommunities Talent&DEI RiskManagement&ResponsibleBusiness Appendices ESGS ataC ius niblnG 139
Disclosure Number and Title Report Section or Other Documentation 102-15 Key impacts, risks, and opportunities • Letter from Our CEO • ESG Governance at Citi • Our Material ESG Issues: Citi in a Global Context • Our $1 Trillion Commitment • Financing the Low-Carbon Transition • Climate Risk and Net Zero • Human Rights > Our Salient Human Rights Risks • 2021 10-K pages 45-59 102-16 Values, principles, standards, and norms of behavior • Citi at a Glance • Our Transformation • Risk Management • Citi Corporate Governance 102-17 Mechanisms for advice and concerns about ethics • Our Transformation > Ethics and Culture at Citi • Citi Code of Conduct • Ethics Hotline 102-18 Governance structure • ESG Governance at Citi • Citi Corporate Governance • 2022 Proxy Statement pages 22-24 102-19 Delegating authority • ESG Governance at Citi • Citigroup Board of Director’s Committee Charter s • 2022 Proxy Statement pages 34-38 102-20 Executive-level responsibility for economic, environmental, and social topics • ESG Governance at Citi 102-21 Consulting stakeholders on economic, environmental, and social topics • ESG Governance at Citi • Stakeholder Engagement at Citi • Climate Risk and Net Zero > Reducing Climate Risk in Our Financing • Risk Management > Public Policy • Risk Management > Monitoring the Changing Risk Landscape • Human Rights > Our Commitment to Respect Human Rights • Human Rights > Learning and Engagement • 2022 Proxy Statement pages 12, 85-86 102-22 Composition of the highest governance body and its committees • 2022 Proxy Statement pages 34-38 102-23 Chair of the highest governance body The Chair of the Board is a nonexecutive, independent director. • 2022 Proxy Statement page 29 102-24 Nominating and selecting the highest governance body • Nomination, Governance and Public Affairs Committee Charter • 2022 Proxy Statement pages 47-51 102-25 Conflicts of interest • 2022 Proxy Statement pages 25-28, 39-42 and 98 102-26 Role of highest governance body in setting purpose, values, and strategy • ESG Governance at Citi • 2022 Proxy Statement pages 47-51 102-27 Collective knowledge of highest governance body • ESG Governance at Citi • 2022 Proxy Statement pages 10-11 and 52-63 102-28 Evaluating the highest governance body’s performance • Corporate Governance Guidelines page 6 • 2022 Proxy Statement page 31 Contents ESGatCiti SustainableFinance SustainableProgress Equitable&ResilientCommunities Talent&DEI RiskManagement&ResponsibleBusiness Appendices ESGS ataC ius niblnG 140
Disclosure Number and Title Report Section or Other Documentation 102-29 Identifying and managing economic, environmental, and social impacts • ESG Governance at Citi • Stakeholder Engagement at Citi • Climate Risk and Net Zero > Citi’s Approach to Managing Climate Risk • Sustainable Operations > Managing Climate Risk in Our Operations • Risk Management > Environmental and Social Risk Management • Human Rights > Our Commitment to Respect Human Rights • Human Rights > Respecting Human Rights in Our Financing Decisions • Responsible Sourcing > Supplier Engagement and Evaluation • The Principles for Responsible Banking Index > 2.1 Impact Analysis • Nomination, Governance and Public Affairs Committee Charter • Risk Management Committee Charter • 2021 10-K pages 60-61 and 118-119 • 2022 Proxy Statement pages 32-34 102-30 Effectiveness of risk management processes • ESG Governance at Citi • Climate Risk and Net Zero > Citi’s Approach to Managing Climate Risk • Sustainable Operations > Managing Climate Risk in Our Operations • Risk Management > Environmental and Social Risk Management • Human Rights > Respecting Human Rights in Our Financing Decisions • Risk Management Committee Charter • Nomination, Governance and Public Affairs Committee Charter • 2021 10-K pages 66-73, 77-81, 92-100, 101-103 and 110-121 102-31 Review of economic, environmental, and social topics • ESG Governance at Citi • 2022 Proxy Statement pages 32-34 and 36 102-32 Highest governance body’s role in sustainability reporting • Head of Global Public Affairs 102-33 Communicating critical concerns • ESG Governance at Citi > ESG Governance • Citi Code of Conduct • 2022 Proxy Statement pages 43-44 102-35 Remuneration policies We compensate our executives fairly, based on individual and company performance, competitive benchmarking and support of our Mission and Value Proposition. • ESG Governance at Citi > Remuneration • Compensation Philosophy • Personnel and Compensation Committee Charter • 2022 Proxy Statement pages 64-67 102-36 Process for determining remuneration Our Proxy Statement contains a summary of each named executive officer’s financial and nonfinancial performance goals, which are approved by the Board’s Personnel and Compensation Committee. We seek to design our executive pay program to motivate balanced behaviors consistent with our focus on long-term strategic goals. For example, diversity and inclusion, including representation of women and U.S. Black colleagues at the Assistant Vice President to Managing Director levels, and ethics and culture are incorporated into senior executives’ scorecards, which are a factor in remuneration. • ESG Governance at Citi > Remuneration • Personnel and Compensation Committee Charter • 2022 Proxy Statement pages 64-67 102-37 Stakeholders’ involvement in remuneration Citi incorporates shareholder and stakeholder input on executive pay into our Compensation Philosophy. • Compensation Philosophy • Personnel and Compensation Committee Charter 102-40 List of stakeholder groups • Stakeholder Engagement at Citi 102-41 Collective bargaining agreements • Human Rights > Respecting the Human Rights of Our Employees 102-42 Identifying and selecting stakeholders • Stakeholder Engagement at Citi • Human Rights > Learning and Engagement Contents ESGatCiti SustainableFinance SustainableProgress Equitable&ResilientCommunities Talent&DEI RiskManagement&ResponsibleBusiness Appendices ESGS ataC ius niblnG 141
Disclosure Number and Title Report Section or Other Documentation 102-43 Approach to stakeholder engagement • Our Material ESG Issues: Citi in a Global Context • Stakeholder Engagement at Citi • Climate Risk and Net Zero > Reducing Climate Risk in Our Financing • Risk Management > Environmental and Social Risk Management • Human Rights > Learning and Engagement • Responsible Sourcing > Supplier Engagement and Evaluation 102-44 Key topics and concerns raised • Stakeholder Engagement at Citi • Climate Risk and Net Zero > Reducing Climate Risk in Our Financing • Risk Management > Environmental and Social Risk Management • Human Rights > Our Commitment to Respect Human Rights • Human Rights > Respecting Human Rights in Our Financing Decisions • Human Rights > Learning and Engagement • Responsible Sourcing > Supplier Engagement and Evaluation 102-45 Entities included in the consolidated financial statements • 2021 10-K pages 4-6, 146 102-46 Defining report content and topic Boundaries • Our Material ESG Issues: Citi in a Global Context 102-47 List of material topics • Our Material ESG Issues: Citi in a Global Context 102-48 Restatements of information • Climate Risk and Net Zero > Reducing Climate Risk in Our Financing • Sustainable Operations > Environmental Performance for Operations • Sustainable Operations > Environmental Impact Report 102-49 Changes in reporting There are no significant changes from the previous reporting period. 102-50 Reporting period This report covers fiscal and calendar year 2021. 102-51 Date of most recent report April 2021 102-52 Reporting cycle Annual 102-53 Contact point for questions regarding the report Global Public Affairs Citigroup Inc. 388 Greenwich St. New York, NY 10013 [email protected] 102-54 Claims of reporting in accordance with the GRI Standards This report has been prepared in accordance with the GRI Standards: Core option. 102-55 GRI content index • GRI Content Index 102-56 External assurance We secure external assurance annually for data related to our reporting on the Equator Principles and environmental data for our operations. • Assurance GRI 201: Economic Performance 2016 201-1 Direct economic value generated and distributed • 2021 10-K pages 7-9 201-2 Financial implications and other risks and opportunities due to climate change • Financing the Low-Carbon Transition > Transforming Our Business to Support a Low-Carbon Economy • Climate Risk and Net Zero • Sustainable Operations > Managing Climate Risk in Our Operations • 2021 TCFD Report • 2021 10-K pages 57-58 201-3 Defined benefit plan obligations and other retirement plans • Citi Benefits Handbook • 2021 10-K pages 171-182 Contents ESGatCiti SustainableFinance SustainableProgress Equitable&ResilientCommunities Talent&DEI RiskManagement&ResponsibleBusiness Appendices ESGS ataC ius niblnG 142
GRI 202: Market Presence 2016 202-1 Ratios of standard entry level wage by gender compared to local minimum wage We offer competitive salaries based on our Compensation Philosophy , which includes ensuring that entry-level employees receive competitive wages within the industry. We also offer employees the opportunity to take advantage of formal or informal flexible work arrangements, including part-time work and job sharing. We conduct a robust annual review of compensation, which includes multiple layers of reviews of compensation recommendations and pay equity analysis. 202-2 Proportion of senior management hired from the local community Most employees are hired locally. When hiring for senior management, we may consider qualified candidates from across the globe. GRI 203: Indirect Economic Impacts 2016 203-1 Infrastructure investments and services supported • Our $1 Trillion Commitment • Financing the Low-Carbon Transition > Transforming Our Business to Support a Low-Carbon Economy • Action for Racial Equity > Action for Racial Equity: An Update on Our Progress • Citi Impact Fund • COVID-19 Relief and Recovery • Affordable Housing • Strategic Philanthropy 203-2 Significant indirect economic impacts • Citi’s Value Proposition: A Mission of Enabling Growth and Progress • Financing the Low-Carbon Transition > Transforming Our Business to Support a Low-Carbon Econom y • COVID-19 Relief and Recovery GRI 205: Anti-corruption 2016 103-1 Explanation of the material topic and its Boundary • Our Material ESG Issues: Citi in a Global Context • Risk Management > Managing Corruption and Tax-Related Risks 103-2 The management approach and its components • ESG Governance at Citi • Risk Management > Managing Corruption and Tax-Related Risks 103-3 Evaluation of the management approach • ESG Governance at Citi • Our Transformation > Ethics and Culture at Citi • Risk Management > Managing Corruption and Tax-Related Risks 205-1 Operations assessed for risks related to corruption • Risk Management > Managing Corruption and Tax-Related Risks • Anti-Bribery Program Statement 205-2 Communication and training about anti- corruption policies and procedures • Our Transformation > Ethics and Culture at Citi • Risk Management > Managing Corruption and Tax-Related Risks • Anti-Bribery Program Statement • Anti-Money Laundering Program • Citi Code of Conduct GRI 206: Anti-competitive Behavior 2016 103-1 Explanation of the material topic and its Boundary • Our Material ESG Issues: Citi in a Global Context 103-2 The management approach and its components • ESG Governance at Citi • Citi Code of Conduct • 2021 10-K pages 66-69 103-3 Evaluation of the management approach • ESG Governance at Citi • 2021 10-K pages 66-69 206-1 Legal actions for anti-competitive behavior, anti-trust, and monopoly practices • 2021 10-K pages 296-303 GRI 302: Energy 2016 103-1 Explanation of the material topic and its Boundary • Our Material ESG Issues: Citi in a Global Context Contents ESGatCiti SustainableFinance SustainableProgress Equitable&ResilientCommunities Talent&DEI RiskManagement&ResponsibleBusiness Appendices ESGS ataC ius niblnG 143
103-2 The management approach and its components • ESG Governance at Citi • Our $1 Trillion Commitment • Financing the Low-Carbon Transition • Climate Risk and Net Zero > Our Net Zero Commitment • Sustainable Operations > Operational Footprint Goals • Sustainable Progress Strategy 103-3 Evaluation of the management approach • Financing the Low-Carbon Transition > Transforming Our Business to Support a Low-Carbon Economy • Sustainable Operations > Operational Footprint Goals 302-1 Energy consumption within the organization • Sustainable Operations > Environmental Performance for Operations • Sustainable Operations > Environmental Impact Report 302-3 Energy intensity • Sustainable Operations > Environmental Impact Report 302-4 Reduction of energy consumption • Sustainable Operations > Environmental Performance for Operations • Sustainable Operations > Environmental Impact Report GRI 304: Biodiversity 2016 103-1 Explanation of the material topic and its Boundary • Our Material ESG Issues: Citi in a Global Context • Financing the Low-Carbon Transition > Climate and Biodiversity • Risk Managemen t > Environmental and Social Risk Management 103-2 The management approach and its components • ESG Governance at Citi • Financing the Low-Carbon Transition > Climate and Biodiversity • Risk Managemen t > Environmental and Social Risk Management 103-3 Evaluation of the management approach • Risk Management > Environmental and Social Risk Management 304-2 Significant impacts of activities, products, and services on biodiversity • Financing the Low-Carbon Transition > Climate and Biodiversity • Risk Management > Environmental and Social Risk Management 304-3 Habitats protected or restored • Risk Management > Protecting Biodiversity and Addressing Resettlement Concerns in Panama Cit y GRI 305: Emissions 2016 103-1 Explanation of the material topic and its Boundary • Our Material ESG Issues: Citi in a Global Context • 2021 TCFD Report 103-2 The management approach and its components • ESG Governance at Citi • Climate Risk and Net Zero > Our Net Zero Commitment • Sustainable Operations > Operational Footprint Goals • Sustainable Progress Strategy 103-3 Evaluation of the management approach • Sustainable Operations > Operational Footprint Goals 305-1 Direct (Scope 1) GHG emissions • Sustainable Operations > Environmental Performance for Operations • Sustainable Operations > Environmental Impact Report 305-2 Energy indirect (Scope 2) GHG emissions • Sustainable Operations > Environmental Performance for Operations • Sustainable Operations > Environmental Impact Report 305-3 Other indirect (Scope 3) GHG emissions • Sustainable Operations > Environmental Impact Report 305-4 GHG emissions intensity • Sustainable Operations > Environmental Impact Report 305-5 Reduction of GHG emissions • Sustainable Operations > Environmental Performance for Operations • Sustainable Operations > Environmental Impact Report GRI 306: Waste 2020 103-1 Explanation of the material topic and its Boundary • Our Material ESG Issues: Citi in a Global Context • Sustainable Operations > Operational Footprint Goals 103-2 The management approach and its components • ESG Governance at Citi • Sustainable Operations > Operational Footprint Goals • Sustainable Progress Strategy 103-3 Evaluation of the management approach • Sustainable Operations > Operational Footprint Goals Contents ESGatCiti SustainableFinance SustainableProgress Equitable&ResilientCommunities Talent&DEI RiskManagement&ResponsibleBusiness Appendices ESGS ataC ius niblnG 144
306-2 Management of significant waste-related impacts • Sustainable Operations > Operational Footprint Goals • Sustainable Operations > Sustainable Building Principles in Action 306-3 Waste generated Citi did not generate any hazardous waste during the reporting period. • Sustainable Operations > Environmental Performance for Operations • Sustainable Operations > Environmental Impact Report GRI 308: Supplier Environmental Assessment 2016 308-1 New suppliers that were screened using environmental criteria • Responsible Sourcing > Supplier Engagement and Evaluation GRI 401: Employment 2016 103-1 Explanation of the material topic and its Boundary • Our Material ESG Issues: Citi in a Global Context • Diversity, Equity & Inclusion 103-2 The management approach and its components • ESG Governance at Citi • Diversity, Equity & Inclusion 103-3 Evaluation of the management approach • Diversity, Equity & Inclusion 401-1 New employee hires and employee turnover • Employment Data 401-2 Benefits provided to full-time employees that are not provided to temporary or part-time employees • Return to Office and the Future of Work • Citi Benefits Handbook GRI 403: Occupational Health and Safety 2018 103-1 Explanation of the material topic and its Boundary • Our Material ESG Issues: Citi in a Global Context • Sustainable Operations > Employee and Customer Well-Being • Return to Office and the Future of Work 103-2 The management approach and its components • ESG Governance at Citi • Sustainable Operations > Sustainable Building Principles in Action • Sustainable Operations > Employee and Customer Well-Being • Return to Office and the Future of Work • Human Rights > Freedom of Association 103-3 Evaluation of the management approach • Sustainable Operations > Employee and Customer Well-Being • Return to Office and the Future of Work 403-3 Occupational health services • Sustainable Operations > Employee and Customer Well-Being • Return to Office and the Future of Work 403-4 Worker participation, consultation, and communication on occupational health and safety • Sustainable Operations > Employee and Customer Well-Being • Human Rights > Freedom of Association 403-6 Promotion of worker health • Sustainable Operations > Employee and Customer Well-Being • Return to Office and the Future of Work GRI 404: Training and Education 2016 103-1 Explanation of the material topic and its Boundary • Our Material ESG Issues: Citi in a Global Context • Diversity, Equity & Inclusion > Recruit, Retain and Promote 103-2 The management approach and its components • ESG Governance at Citi • Diversity, Equity & Inclusion > Recruit, Retain and Promote 103-3 Evaluation of the management approach • Diversity, Equity & Inclusion > Recruit, Retain and Promote 404-2 Programs for upgrading employee skills and transition assistance programs • Diversity, Equity & Inclusion > Recruit, Retain and Promote 404-3 Percentage of employees receiving regular performance and career development reviews Employees receive formal feedback from their managers through mid-year and year-end reviews. Citi encourages employees and their managers to create individual plans that consider the skills, strategic development opportunities and behaviors needed to enhance current performance and prepare for future roles. These plans are discussed as part of mid-year and year-end reviews, and employees are encouraged to take part in stretch assignments and development programs to further build skills. All Citi employees have the ability to request feedback from and provide feedback to colleagues, while managers can also ask for feedback on team members throughout the year. Contents ESGatCiti SustainableFinance SustainableProgress Equitable&ResilientCommunities Talent&DEI RiskManagement&ResponsibleBusiness Appendices ESGS ataC ius niblnG 145
GRI 405: Diversity and Equal Opportunity 2016 103-1 Explanation of the material topic and its Boundary • Our Material ESG Issues: Citi in a Global Context • Diversity, Equity & Inclusion • Human Rights > Our Commitment to Respect Human Rights • Human Rights > Respecting the Human Rights of Our Employees 103-2 The management approach and its components • ESG Governance at Citi • Diversity, Equity & Inclusion • Human Rights > Our Commitment to Respect Human Rights • Human Rights > Respecting the Human Rights of Our Employees 103-3 Evaluation of the management approach • Diversity, Equity & Inclusion 405-1 Diversity of governance bodies and employees • Employment Data • Board of Directors • 2022 Proxy Statement page 30 GRI 407: Freedom of Association and Collective Bargaining 2016 103-1 Explanation of the material topic and its Boundary • Our Material ESG Issues: Citi in a Global Context • Human Rights > Respecting the Human Rights of Our Employees 103-2 The management approach and its components • ESG Governance at Citi • Human Rights > Respecting the Human Rights of Our Employees 103-3 Evaluation of the management approach • Human Rights > Respecting the Human Rights of Our Employees 407-1 Operations and suppliers in which the right to freedom of association and collective bargaining may be at risk • Human Rights > Respecting the Human Rights of Our Employees GRI 408: Child Labor 2016 103-1 Explanation of the material topic and its Boundary • Our Material ESG Issues: Citi in a Global Contex t • Human Rights > Respecting Human Rights in Our Financing Decisions 103-2 The management approach and its components • ESG Governance at Citi • Human Rights > Extending Respect for Human Rights Through Our Suppliers • Human Rights > Respecting Human Rights in Our Financing Decisions • Citi Statement of Supplier Principles • Citi Statement on Human Rights 103-3 Evaluation of the management approach • Human Rights > Respecting Human Rights in Our Financing Decisions 408-1 Operations and suppliers at significant risk for incidents of child labor We have not identified any operations as having significant risk for incidents of child labor. Our business overall is not at high risk because of the nature of work in the financial services industry. In addition, we do not directly source high-risk agricultural commodities, conflict minerals or any other raw materials, goods or services in significant amounts from suppliers in high-risk jurisdictions. GRI 409: Forced or Compulsory Labor 2016 103-1 Explanation of the material topic and its Boundary • Our Material ESG Issues: Citi in a Global Context • Human Rights > Our Commitment to Respect Human Rights • Human Rights > Extending Respect for Human Rights Through Our Suppliers • Human Rights > Respecting Human Rights in Our Financing Decisions 103-2 The management approach and its components • ESG Governance at Citi • Human Rights > Extending Respect for Human Rights Through Our Suppliers • Human Rights > Respecting Human Rights in Our Financing Decisions • Responsible Sourcing > Supplier Engagement and Evaluation • Citi Statement of Supplier Principles • Citi Statement on Human Rights • Citi Modern Slavery Disclosures 103-3 Evaluation of the management approach • Human Rights > Extending Respect for Human Rights Through Our Supplier s • Human Rights > Respecting Human Rights in Our Financing Decisions • Responsible Sourcing > Supplier Engagement and Evaluation Contents ESGatCiti SustainableFinance SustainableProgress Equitable&ResilientCommunities Talent&DEI RiskManagement&ResponsibleBusiness Appendices ESGS ataC ius niblnG 146
409-1 Operations and suppliers at significant risk for incidents of forced or compulsory labor We have not identified any operations as having significant risk for incidents of forced or compulsory labor. In addition, we do not directly source high-risk agricultural commodities, conflict minerals or other raw materials in significant amounts from suppliers in high-risk jurisdictions. While our own business operations and supply chain are not at high risk because of the nature of work in the financial services industry, our ESRM policy includes processes to evaluate corporate clients to determine if they present a high risk of forced labor or compulsory labor and we have taken appropriate mitigating steps. • Human Rights > Extending Respect for Human Rights Through Our Suppliers • Human Rights > Respecting Human Rights in Our Financing Decisions • Responsible Sourcing > Supplier Engagement and Evaluation GRI 411: Rights of Indigenous Peoples 2016 103-1 Explanation of the material topic and its Boundary • Our Material ESG Issues: Citi in a Global Context • Human Rights > Our Commitment to Respect Human Rights • Human Rights > Respecting Human Rights in Our Financing Decisions 103-2 The management approach and its components • ESG Governance at Citi • Human Rights > Our Commitment to Respect Human Rights • Human Rights > Respecting Human Rights in Our Financing Decisions 103-3 Evaluation of the management approach • Human Rights > Respecting Human Rights in Our Financing Decisions 411-1 Incidents of violations involving rights of indigenous peoples • Human Rights > Identifying Human Rights Risks in Transactions GRI 412: Human Rights Assessment 2016 103-1 Explanation of the material topic and its Boundary • Our Material ESG Issues: Citi in a Global Context • Human Rights > Our Commitment to Respect Human Rights • Responsible Sourcing 103-2 The management approach and its components • ESG Governance at Citi • Human Rights • Responsible Sourcing > Supplier Engagement and Evaluation • Citi Statement on Human Rights • Citi Requirements for Suppliers • Citi Statement of Supplier Principles • Citi Modern Slavery Disclosures 103-3 Evaluation of the management approach • Human Rights > Respecting the Human Rights of Our Employees • Human Rights > Extending Respect for Human Rights Through Our Suppliers • Human Rights > Respecting Human Rights in Our Financing Decisions • Responsible Sourcing > Supplier Engagement and Evaluation 412-1 Operations that have been subject to human rights reviews or impact assessments • Risk Management > Environmental and Social Risk Management • Human Rights > Identifying Human Rights Risks in Transactions • Responsible Sourcing > Supplier Engagement and Evaluation 412-2 Employee training on human rights policies or procedures • Risk Management > ESRM Training • Human Rights > Respecting the Human Rights of Our Employees • Human Rights > Employee Training 412-3 Significant investment agreements and contracts that include human rights clauses or that underwent human rights screening • Human Rights > Respecting Human Rights in Our Financing Decisions GRI 413: Local Communities 2016 103-1 Explanation of the material topic and its Boundary • Our Material ESG Issues: Citi in a Global Context • Our Commitment to Social Finance • Risk Management > Environmental and Social Risk Management 103-2 The management approach and its components • ESG Governance at Citi • Our Commitment to Social Finance • Risk Management > Our ESRM Policy • Citi’s Environmental and Social Policy Framework Contents ESGatCiti SustainableFinance SustainableProgress Equitable&ResilientCommunities Talent&DEI RiskManagement&ResponsibleBusiness Appendices ESGS ataC ius niblnG 147
103-3 Evaluation of the management approach • Our Commitment to Social Finance • Risk Management > Policy Implementation 413-1 Operations with local community engagement, impact assessments, and development programs • Stakeholder Engagement at Citi • Action for Racial Equity • Citi Impact Fund • COVID-19 Relief and Recovery • Affordable Housing • Strategic Philanthropy • Risk Management > Environmental and Social Risk Management • Human Rights > Learning and Engagement • Responsible Sourcing > Supplier Engagement and Evaluation 413-2 Operations with significant actual and potential negative impacts on local communities • Risk Management > Environmental and Social Risk Management • Human Rights > Our Commitment to Respect Human Rights • Human Rights > Extending Respect for Human Rights Through Our Supplier s • Human Rights > Respecting Human Rights in Our Financing Decisions • Responsible Sourcing > Supplier Engagement and Evaluation GRI 414: Supplier Social Assessment 2016 414-1 New suppliers that were screened using social criteria • Responsible Sourcing > Supplier Engagement and Evaluation GRI 415: Public Policy 2016 103-1 Explanation of the material topic and its Boundary • Our Material ESG Issues: Citi in a Global Context • Risk Management > Public Policy 103-2 The management approach and its components • ESG Governance at Citi • Risk Management > Public Policy • Citi Political Activities Statement 103-3 Evaluation of the management approach • Risk Management > Public Policy • Citi Political Activities Statement 415-1 Political contributions • Citi U.S. Political Contributions GRI 417: Marketing and Labeling 2016 103-1 Explanation of the material topic and its Boundary • Our Material ESG Issues: Citi in a Global Context • Serving Our Customers and Clients Responsibly 103-2 The management approach and its components • ESG Governance at Citi • Serving Our Customers and Clients Responsibly 103-3 Evaluation of the management approach • Our Material ESG Issues: Citi in a Global Context • Serving Our Customers and Clients Responsibly 417-1 Requirements for product and service information and labeling • Serving Our Customers and Clients Responsibly GRI 418: Customer Privacy 2016 103-1 Explanation of the material topic and its Boundary • Our Material ESG Issues: Citi in a Global Context • Risk Management > Safeguarding Data and Protecting Customer Information 103-2 The management approach and its components • Risk Management > Safeguarding Data and Protecting Customer Information • Citi Code of Conduct • Citi Online Privacy Statement • Citi Security Center 103-3 Evaluation of the management approach • Risk Management > Safeguarding Data and Protecting Customer Information 418-1 Substantiated complaints concerning breaches of customer privacy and losses of customer data • Risk Management > Safeguarding Data and Protecting Customer Information Contents ESGatCiti SustainableFinance SustainableProgress Equitable&ResilientCommunities Talent&DEI RiskManagement&ResponsibleBusiness Appendices ESGS ataC ius niblnG 148
GRI 419: Socioeconomic Compliance 2016 103-1 Explanation of the material topic and its Boundary • Our Material ESG Issues: Citi in a Global Context 103-2 The management approach and its components • ESG Governance at Citi • Risk Management > Managing Corruption and Tax-Related Risks • Serving Our Customers and Clients Responsibly • 2021 10-K pages 66-69 103-3 Evaluation of the management approach • Risk Management > Managing Corruption and Tax-Related Risks • Serving Our Customers and Clients Responsibly • 2021 10-K pages 66-69 419-1 Non-compliance with laws and regulations in the social and economic area • 2021 10-K pages 66-69, 116-117 • 2021 Annual Report FINANCIAL SERVICES SECTOR SUPPLEMENT FS6 Percentage of the portfolio for business lines by specific region, size (e.g., micro/SME/large) and by sector • 2021 10-K pages 7-28 FS8 Monetary value of products and services designed to deliver a specific environmental benefit for each business line broken down by purpose • Our $1 Trillion Commitment • Financing the Low-Carbon Transition > Transforming Our Business to Support a Low-Carbon Economy FS13 Access points in low-populated or economically disadvantaged areas by type • Our Commitment to Social Finance • Action for Racial Equity • Citi Impact Fund • COVID-19 Relief and Recovery • Affordable Housing • Strategic Philanthropy FS14 Initiatives to improve access to financial services for disadvantaged people • Our Commitment to Social Finance • Action for Racial Equity • Citi Impact Fund • COVID-19 Relief and Recovery • Affordable Housing • Strategic Philanthropy Contents ESGatCiti SustainableFinance SustainableProgress Equitable&ResilientCommunities Talent&DEI RiskManagement&ResponsibleBusiness Appendices ESGS ataC ius niblnG 149
Sustainability Accounting Standards Board Index This index was prepared in accordance with Industry Standards Version 2018-10 issued by the Sustainability Accounting Standards Board (SASB). The disclosures below relate to three sector standards aligned to our mix of businesses: Commercial Banks, Consumer Finance and Investment Banking & Brokerage. Unless otherwise noted, data and descriptions apply to our entire company, not just the businesses relevant to that sector. We do not yet disclose all metrics included in the sector standards, but we will continue to evaluate their relevance to our business and our ability to improve, and we will consider increasing the number of metrics we include in the future. All data is as of and for the year ended Dec. 31, 2021, unless otherwise noted. COMMERCIAL BANKS Topic Accounting Metric Category Code Report Section or Other Documentation Data Security (1) Number of data breaches, (2) percentage involving personally identifiable information (PII), (3) number of account holders affected Quantitative FN-CB- 230a.1 Citi has a robust program that addresses the cybersecurity life cycle of preparedness and prevention, detection, response, mitigation, lessons learned and training. Cybersecurity incidents, including any data breaches, are reported to consumers, regulators, business partners and others as legally required and otherwise appropriate. For security reasons, Citi generally does not publicly reveal further details regarding the security incidents we may encounter in a particular year. Citi provides a general discussion of cybersecurity incidents with regard to Operational Risk in its 10-K. • 2021 10-K pages 52 and 115-116 Description of approach to identifying and addressing data security risks Discussion and Analysis FN-CB- 230a.2 • Risk Management > Safeguarding Data and Protecting Customer Information Financial Inclusion & Capacity Building (1) Number and (2) amount of loans outstanding qualified to programs designed to promote small business and community development Quantitative FN-CB- 240a.1 Citi engages in community development efforts by equity investment through the Citi Impact Fund and financing affordable housing and community development projects through our Citi Community Capital group. Key statistics and the impacts of these efforts as well as activity to support small business lending can be found in our 2021 Environmental, Social and Governance (ESG) Report. • Equitable and Resilient Communities > Investing in Our Communities: 2021 Highlights • Our Commitment to Social Finance • Action for Racial Equity • Citi Impact Fund • COVID-19 Relief and Recovery • Affordable Housing • Strategic Philanthropy • Citi Community Capital Website (1) Number and (2) amount of past due and nonaccrual loans qualified to programs designed to promote small business and community development Quantitative FN-CB- 240a.2 Citi does not report this information. Number of no-cost retail checking accounts provided to previously unbanked or underbanked customers Quantitative FN-CB- 240a.3 In 2014, Citi launched the Access Account — a simple, checkless bank account with low or no monthly fees and no overdraft fees, which provides customers with a straightforward way to save money and manage their finances. As of Dec. 31, 2021, there were 336,677 active Access checking accounts. This figure excludes high-yield savings accounts. On Feb. 24, 2022, Citi announced plans to eliminate overdraft fees, returned item fees and overdraft protection fees by mid-2022, representing the Company’s continued commitment to expand access to inclusive banking products and services that can help advance economic progress, especially for underbanked and unbanked communities. In addition to eliminating these fees, Citi will continue to offer a robust suite of free overdraft protection services for its consumers. Citi does not track if account holders were formerly unbanked/ underbanked. • Risk Management > Eliminating Overdraft Fees for Our Customers’ Financial Wellness • Access Account webpage • Citi Retail Banking Overdraft Fees Change Number of participants in financial literacy initiatives for unbanked, underbanked, or underserved customers Quantitative FN-CB- 240a.4 Our efforts to support underbanked individuals and small businesses are discussed in our 2021 ESG Report. • Our Commitment to Social Finance Contents ESGatCiti SustainableFinance SustainableProgress Equitable&ResilientCommunities Talent&DEI RiskManagement&ResponsibleBusiness Appendices ESGS ataC ius niblnG 150
Topic Accounting Metric Category Code Report Section or Other Documentation Incorporation of ESG Factors in Credit Analysis Commercial and industrial credit exposure, by industry Quantitative FN-CB- 410a.1 • 2021 10-K page 79 Description of approach to incorporation of environmental, social, and governance (ESG) factors in credit analysis Discussion and Analysis FN-CB- 410a.2 • Risk Management > Environmental and Social Risk Management • Environmental and Social Policy Framework • 2021 10-K pages 118-119 Business Ethics Total amount of monetary losses as a result of legal proceedings associated with fraud, insider trading, anti-trust, anti-competitive behavior, market manipulation, malpractice, or other related financial industry laws or regulations Quantitative FN-CB- 510a.1 Citi discloses all material legal and regulatory proceedings in its 10- K, including when a suit was filed, the court, the parties involved, the allegations and the relief sought. Citi also discloses information regarding material inquiries or investigations by regulators, including any legal and regulatory proceedings associated with such business ethics matters. • 2021 10-K pages 296-303 Description of whistleblower policies and procedures Discussion and Analysis FN-CB- 510a.2 • Human Rights > Reporting Mechanisms for Stakeholders • Citi Code of Conduct pages 10-11 Systemic Risk Management Global Systemically Important Bank (G-SIB) score, by category Quantitative FN-CB- 550a.1 • 2021 10-K page 31 • 2021 Systemic Risk Report (FR Y-15) Description of approach to incorporation of results of mandatory and voluntary stress tests into capital adequacy planning, long-term corporate strategy, and other business activities Discussion and Analysis FN-CB- 550a.2 • 2021 10-K page 32 Activity Metric (1) Number and (2) value of checking and savings accounts by segment: (a) personal and (b) small business Quantitative FN-CB- 000.A Citi discloses the number of end-of-period retail banking and credit card accounts by region. Citi does not disaggregate personal and small business accounts. • 4Q21 Quarterly Financial Data Supplement pages 9, 12, 14 and 16 (1) Number and (2) value of loans by segment: (a) personal, (b) small business, and (c) corporate Quantitative FN-CB- 000.B Citi discloses the value of outstanding consumer and corporate loans in its 10-K. Consumer loans are reported as consumer mortgages and credit card loans, while personal, small business and other loans are aggregated. • 2021 10-K pages 70-83 CONSUMER FINANCE Topic Accounting Metric Category Code Response Customer Privacy Number of account holders whose information is used for secondary purposes Quantitative FN-CF- 220a.1 Citi does not report this information. Total amount of monetary losses as a result of legal proceedings associated with customer privacy Quantitative FN-CF- 220a.2 Citi discloses all material legal and regulatory proceedings in its 10- K, including when a suit was filed, the court, the parties involved, the allegations and the relief sought. Citi also discloses information regarding material inquiries or investigations by regulators. Citi did not have any material matters requiring disclosure associated with customer privacy in its 2021 10-K. • 2021 10-K pages 296-303 Contents ESGatCiti SustainableFinance SustainableProgress Equitable&ResilientCommunities Talent&DEI RiskManagement&ResponsibleBusiness Appendices ESGS ataC ius niblnG 151
Topic Accounting Metric Category Code Response Data Security (1) Number of data breaches, (2) percentage involving personally identifiable information (PII), (3) number of account holders affected Quantitative FN-CF- 230a.1 See response to FN-CB-230a.1. Card-related fraud losses from (1) card-not-present fraud and (2) card-present and other fraud Quantitative FN-CF- 230a.2 Citi did not have any material fraud losses requiring disclosure. Description of approach to identifying and addressing data security risks Discussion and Analysis FN-CF- 230a.3 See response to FN-CB-230a.2. Selling Practices Percentage of total remuneration for covered employees that is variable and linked to the amount of products and services sold Quantitative FN-CF- 270a.1 Citi does not track this information. Approval rate for (1) credit and (2) pre-paid products for applicants with FICO scores above and below 660 Quantitative FN-CF- 270a.2 Citi does not disclose its approval rates for its credit card and pre-paid products. Citi provides a FICO score distribution of outstanding North America Citi-Branded and Citi Retail Services card receivables in its 10-K. The disclosure distribution is disaggregated by scores above and below 680 and does not include pre-paid products. • 2021 10-K pages 207-208 (1) Average fees from add-on products, (2) average APR, (3) average age of accounts, (4) average number of trade lines, and (5) average annual fees for pre-paid products, for customers with FICO scores above and below 660 Quantitative FN-CF- 270a.3 Citi does not track this information. (1) Number of complaints filed with the Consumer Financial Protection Bureau (CFPB), (2) percentage with monetary or nonmonetary relief, (3) percentage disputed by consumer, (4) percentage that resulted in investigation by the CFPB Quantitative FN-CF- 270a.4 Citi does not report this information. Total amount of monetary losses as a result of legal proceedings associated with selling and servicing of products Quantitative FN-CF- 270a.5 Citi discloses all material legal and regulatory proceedings in its 10- K, including when a suit was filed, the court, the parties involved, the allegations and the relief sought. Citi also discloses information regarding material inquiries or investigations by regulators associated with selling and servicing of products. • 2021 10-K pages 296-303 Activity Metric Number of unique consumers with an active (1) credit card account and (2) pre-paid debit card account Quantitative FN-CF- 000.A Citi discloses the number of end-of-period retail banking and credit card accounts by region. Citi does not disaggregate credit card and pre-paid debit card accounts nor report unique consumers. • 4Q21 Quarterly Financial Data Supplement pages 9, 12, 14 and 16 Number of (1) credit card accounts and (2) pre-paid debit card accounts Quantitative FN-CF- 000.B Citi discloses the number of end-of-period retail banking and credit card accounts by region. Citi does not disaggregate credit card and pre-paid debit card accounts. • 4Q21 Quarterly Financial Data Supplement pages 9, 12, 14 and 16 Contents ESGatCiti SustainableFinance SustainableProgress Equitable&ResilientCommunities Talent&DEI RiskManagement&ResponsibleBusiness Appendices ESGS ataC ius niblnG 152
INVESTMENT BANKING & BROKERAGE Topic Accounting Metric Category Code Response Employee Diversity & Inclusion Percentage of gender and racial/ethnic group representation for (1) executive management, (2) non-executive management, (3) professionals, and (4) all other employees Quantitative FN-IB- 330a.1 • Diversity, Equity & Inclusion > Representation Goals • Employment Data Incorporation of Environmental, Social, and Governance Factors in Investment Banking & Brokerage Activities Revenue from (1) underwriting, (2) advisory, and (3) securitization transactions incorporating integration of environmental, social, and governance (ESG) factors, by industry Quantitative FN-IB- 410a.1 Citi does not report this information. (1) Number and (2) total value of investments and loans incorporating integration of environmental, social, and governance (ESG) factors, by industry Quantitative FN-IB- 410a.2 • Our $1 Trillion Commitment • Risk Management > ESRM Consultation Data Citi also incorporates environmental and social criteria for transactions that contribute to our $1 trillion sustainable finance commitment . Description of approach to incorporation of environmental, social, and governance (ESG) factors in investment banking and brokerage activities Discussion and Analysis FN-IB- 410a.3 • Risk Management > Environmental and Social Risk Management • Citi’s Environmental and Social Policy Framework Business Ethics Total amount of monetary losses as a result of legal proceedings associated with fraud, insider trading, anti-trust, anti-competitive behavior, market manipulation, malpractice, or other related financial industry laws or regulations Quantitative FN-IB- 510a.1 See response to FN-CB-510a.1. Description of whistleblower policies and procedures Discussion and Analysis FN-IB- 510a.2 See response to FN-CB-510a.2. Professional Integrity (1) Number and (2) percentage of covered employees with a record of investment-related investigations, consumer- initiated complaints, private civil litigations, or other regulatory proceedings Quantitative FN-IB- 510b.1 Citi does not report this information. Number of mediation and arbitration cases associated with professional integrity, including duty of care, by party Quantitative FN-IB- 510b.2 Citi does not report this information. Total amount of monetary losses as a result of legal proceedings associated with professional integrity, including duty of care Quantitative FN-IB- 510b.3 Citi discloses all material legal and regulatory proceedings in its 10- K, including when a suit was filed, the court, the parties involved, the allegations and the relief sought. Citi also discloses information regarding material inquiries or investigations by regulators associated with professional integrity, including duty of care. • 2021 10-K pages 296-303 Description of approach to ensuring professional integrity, including duty of care Discussion and Analysis FN-IB- 510b.4 • Serving Our Customers and Clients Responsibly • Citi Code of Conduct Contents ESGatCiti SustainableFinance SustainableProgress Equitable&ResilientCommunities Talent&DEI RiskManagement&ResponsibleBusiness Appendices ESGS ataC ius niblnG 153
Systemic Risk Management Global Systemically Important Bank (G-SIB) score, by category Quantitative FN-IB- 550a.1 See response to FN-CB-550a.1. Description of approach to incorporation of results of mandatory and voluntary stress tests into capital adequacy planning, long-term corporate strategy, and other business activities Discussion and Analysis FN-IB- 550a.2 See response to FN-CB-550a.2. Employee Incentives & Risk Taking Percentage of total remuneration that is variable for Material Risk Takers (MRTs) Quantitative FN-IB- 550b.1 Citi discloses the percentage of variable remuneration for the Executive Management Team in its Proxy Statement. • 2022 Proxy Statement page 81 Percentage of variable remuneration of Material Risk Takers (MRTs) to which malus or clawback provisions were applied Quantitative FN-IB- 550b.2 Citi discloses the percentage of variable remuneration subject to clawback provisions for the Executive Management Team in its Proxy Statement. • 2022 Proxy Statement pages 81 and 88 Discussion of policies around supervision, control, and validation of traders’ pricing of Level 3 assets and liabilities Discussion and Analysis FN-IB- 550b.3 • 2021 10-K pages 124 and 263-264 Activity Metric (1) Number and (2) value of (a) underwriting, (b) advisory, and (c) securitization transactions Quantitative FN-IB- 000.A Per Dealogic, our transaction volumes for 2021 were: Transaction Type Volume ($ M) Deals (#) Underwriting 890,494.58 3,457 Advisory (completed) 820,459.53 317 Securitizations 153,112.44 401 • Dealogic press view standards were used to run the league tables. • Values include Dealogic Rank Eligible transactions only. • Citi volume for Mergers and Acquisitions is Equal Credit to Target and Acquirer Advisors. • Citi volume for underwriting is Full to Book Manager, Equal if Joint Books. • Underwriting is inclusive of equity and equity-linked securities, debt capital markets issuances including securitization of asset and mortgage-backed securities and syndicated loans. • Securitizations consist of asset and mortgage-backed securities. • Derivatives are not accounted for in the table above. (1) Number and (2) value of proprietary investments and loans by sector Quantitative FN-IB- 000.B Through Citi’s Impact Fund, we make equity investments in companies that are addressing societal challenges, including workforce development, sustainability, infrastructure, financial capability, and access to capital and economic opportunity. • Citi Impact Fund (1) Number and (2) value of market making transactions in (a) fixed income, (b) equity, (c) currency, (d) derivatives, and (e) commodity products Quantitative FN-IB- 000.C Citi does not report this information. Contents ESGatCiti SustainableFinance SustainableProgress Equitable&ResilientCommunities Talent&DEI RiskManagement&ResponsibleBusiness Appendices ESGS ataC ius niblnG 154
Reporting and Self- Assessment Requirements High-Level Summary of Bank’s Response References Principle 1: Alignment We will align our business strategy to be consistent with and contribute to individuals’ needs and society’s goals, as expressed in the SDGs, the Paris Agreement and relevant national and regional frameworks. 1.1 Describe (high-level) your bank’s business model, including the main customer segments served, types of products and services provided, the main sectors and types of activities, and where relevant the technologies financed across the main geographies in which your bank has operations or provides products and services. Citi is a global diversified financial services company whose businesses provide consumers, corporations, governments and institutions with a broad, yet focused, range of financial products and services, including consumer banking and credit, corporate and investment banking, securities brokerage, trade and securities services and wealth management. Citi has approximately 200 million customer accounts and does business in more than 160 countries and jurisdictions. During 2021, Citigroup was managed pursuant to two operating segments — Institutional Clients Group (ICG) and Global Consumer Banking (GCB). As part of its strategic refresh, Citi made management reporting changes to align with its vision and strategy, including to assist Citi in decisions about resources and capital allocation and to assess business performance. In the first quarter of 2022, Citi revised its financial reporting structure to align with these management reporting changes to enable investors and others to better understand the performance of Citi’s businesses. These changes are discussed on page 6 of our 2021 10-K. 2021 Environmental, Social and Governance (ESG) Report: • Citi at a Glance External References: • About Citi • Consumer Businesses • Institutional Businesses • 2021 10-K, pp. 4-6 The Principles for Responsible Banking Index The Principles for Responsible Banking (PRB) are a framework for ensuring that signatory banks’ strategy and practice align with Sustainable Development Goals (SDGs) and the Paris Climate Agreement (Paris Agreement). The Principles encourage a sustainable banking system and help the industry demonstrate how it makes a positive contribution to society. They embed sustainability at the strategic, portfolio and transactional levels and across all business areas. Following the guidance provided by UN Environment Programme Finance Initiative (UNEP FI), we mapped the Principles to our core activities and are reporting on our progress. The results are outlined in the index below. Contents ESGatCiti SustainableFinance SustainableProgress Equitable&ResilientCommunities Talent&DEI RiskManagement&ResponsibleBusiness Appendices ESGS ataC ius niblnG 155
Reporting and Self- Assessment Requirements High-Level Summary of Bank’s Response References 1.2 Describe how your bank has aligned and/or is planning to align its strategy to be consistent with and contribute to society’s goals, as expressed in the SDGs, the Paris Agreement, and relevant national and regional frameworks. Many of our activities support the SDGs, including sustainable finance such as renewable energy project finance and public sector finance; corporate philanthropy; Citi Impact Fund investments; inclusive finance activity and employee diversity programs. Citi is also part of the Global Investors for Sustainable Development (GISD) Alliance, which is committed to accelerating the financing of the SDGs. Examples of our initiatives that align with and contribute to society’s goals are summarized below: $1 Trillion Sustainable Finance Commitment In 2021 we announced our $1 trillion sustainable finance by 2030 commitment. This extends our prior five-year, $250 Billion Environmental Finance Goal to $500 Billion by 2030, and includes a $500 Billion Social Finance Goal towards financing in areas such as affordable basic infrastructure, affordable housing, diversity and equity and economic inclusion, among others. Sustainable Progress Strategy Climate change is integrated into the three pillars of our Sustainable Progress Strategy: • Low-Carbon Transition: our work to finance and facilitate low-carbon solutions and support our clients in their decarbonization and transition strategies • Climate Risk: our efforts to measure, manage and reduce the climate risk and impacts of our client portfolio • Sustainable Operations: our efforts to reduce the environmental footprint of our facilities and further integrate sustainable practices across our global operations Fossil Fuel Sector Approaches Under our Environmental and Social Risk Management (ESRM) Policy, we have updated our Sector Approaches for fossil fuel industries, such as thermal coal mining, coal-fired power and Arctic oil and gas. We have included a commitment to eliminate our exposure to thermal coal mining companies by 2030, as well as requirements for clients with coal-fired power generation to engage with Citi on low-carbon transition strategies. Net Zero Commitment In 2021, Citi announced its commitment to net zero greenhouse gas (GHG) emissions by 2050, including net zero GHG emissions for its operations by 2030. In early 2022, we released our initial net zero plan, baseline emissions and 2030 emissions reduction targets for our Energy and Power loan portfolios. Action for Racial Equity As part of our Action for Racial Equity , Citi and the Citi Foundation have committed $1 billion in strategic initiatives through 2023 to help close the racial wealth gap. Citi Impact Fund We established the Citi Impact Fund, through which we are investing in “double bottom line” companies that are addressing societal challenges and have expanded this fund over recent years. Pathways to Progress Citi and the Citi Foundation’s Pathways to Progress initiative aims to build job skills and equip young people, particularly those from underserved communities, with the skills and networks for improved economic opportunity. In addition to the examples above, Citi has adopted or publicly endorsed a large number of external principles and standards that inform our approach to sustainable finance and risk management and allow us to provide innovative financial services that enable growth and economic progress while meeting our responsibilities to people and the planet. Please refer to our Environmental and Social Policy Framework for a full list. 2021 ESG Report: • Citi and the Sustainable Development Goals • Sustainable Finance • Sustainable Progress • Climate Risk and Net Zero • Equitable and Resilient Communities • Citi Impact Fund External References: • Action for Racial Equity • Environmental and Social Policies • Environmental and Social Policy Framework • Net Zero Commitment • Sustainable Progress Strategy Contents ESGatCiti SustainableFinance SustainableProgress Equitable&ResilientCommunities Talent&DEI RiskManagement&ResponsibleBusiness Appendices ESGS ataC ius niblnG 156
Reporting and Self- Assessment Requirements High-Level Summary of Bank’s Response References Principle 2: Impact and Target Setting We will continuously increase our positive impacts while reducing the negative impacts on, and managing the risks to, people and environment resulting from our activities, products and services. To this end, we will set and publish targets where we can have the most significant impacts. 2.1 Impact Analysis: Show that your bank has identified the areas in which it has its most significant (potential) positive and negative impact through an impact analysis that fulfills the following elements: a) Scope: The bank’s core business areas, products/services across the main geographies that the bank operates in have been as described under 1.1. have been considered in the scope of the analysis. b) Scale of Exposure: In identifying its areas of most significant impact the bank has considered where its core business/its major activities lie in terms of industries, technologies and geographies. c) Context & Relevance: Your bank has taken into account the most relevant challenges and priorities related to sustainable development in the countries/regions in which it operates. d) Scale and intensity/salience of impact: In identifying its areas of most significant impact, the bank has considered the scale and intensity/ salience of the (potential) social, economic and environmental impacts resulting from the bank’s activities and provision of products and services. Show that building on this analysis, the bank has • Identified and disclosed its areas of most significant (potential) positive and negative impact • Identified strategic business oppor - tunities in relation to the increase of positive impacts / reduction of negative impacts Introduction Building on our track record of over 20 years of work on climate change, sustainability and ESG issues, Citi’s approach to impact analysis is a process that has developed organically for our priority strategic initiatives. Prior to becoming a signatory to the Principles, we were engaged in this impact assessment process and we continue to learn from it and adapt it to new and emerging best practices. As such, our process involves concurrent workstreams that provide continuous feedback for the monitoring of potential impacts. This integrated process aligns with the directional intent of the Principles to “embed sustainability at the strategic, portfolio, and transactional levels across all business areas.” We recognize that any approach towards impact analysis is never complete, and the guidance developed by the PRB working groups can be used to help complement our existing work. Additionally, for financial institutions that are beginning their work to explore areas of greatest impacts, we regard the Principles as an efficient framework for embarking on this level of analysis. We plan to use the Principles and reporting from our peers to benchmark the impact areas we have identified and ensure that we are addressing society’s needs in the regions in which we operate and the markets that we serve. Citi’s Approach Citi’s approach to impact consists of multiple concurrent processes, summarized below. Note that these processes, as described, do not necessarily occur in the order presented. 1. Feedback Pathways: To identify potential impact areas, we engage a number of internal and external stakeholders, partners and tools, including: a) Periodic stakeholder engagement: Citi reg ularly reviews its stakeholder partnerships across a range of functions including Global Public Affairs; Investor Relations; Human Resources and Corporate Governance as well as Sustainability; Government Affairs and other teams in Public Affairs. Examples of our stakeholder engagements from 2021 are highlighted in the Stakeholder Engagement at Citi section of this report. Furthermore, we periodically have feedback sessions for stakeholders including clients, investors and NGOs facilitated by the nonprofit sustainability advocacy organization Ceres. These sessions focus on areas such as our Sustainable Progress Strategy and approach to addressing climate change including, most recently, our setting of net zero targets and measurement of baseline emissions. For more information, please see pages 26-27 of our 2021 TCFD Report. b) Partnerships with trade organizations: Becoming a signatory t o global industry initiatives and participating in working groups keeps us abreast of emerging issues and best practices for addressing them. Engagements with organizations such as the Equator Principles, Institute of International Finance (IIF), United Nations Environment Programme Finance Initiative (UNEP FI) and GISD highlight potential issues, increasing awareness of our own potential impacts as a global bank. Such involvement also allows for opportunities to support public policy and regulation that encourages sustainable development. c) Third-party ratings: Analyses cond ucted by third-party organizations allow Citi to benchmark our approaches to certain ESG issues against standardized frameworks and methodologies. Such ratings and their accompanying reports identify areas for improvement and provide useful data that can help drive performance. 2021 ESG Report: • Our Material ESG Issues: Citi in a Global Context • Stakeholder Engagement at Citi • Sustainable Finance • Sustainable Progress • Climate Risk and Net Zero • Equitable and Resilient Communities External References: • 2021 TCFD Report • Action for Racial Equity • Banking in Color • Closing the Racial Inequality Gaps • Environmental and Social Policies • Environmental and Social Policy Framework • Net Zero Commitment • Sustainable Progress Strategy • The Devaluation of Assets in Black Neighborhoods • The Racial Wealth Gap • 2021 10-K Contents ESGatCiti SustainableFinance SustainableProgress Equitable&ResilientCommunities Talent&DEI RiskManagement&ResponsibleBusiness Appendices ESGS ataC ius niblnG 157
High-Level Summary of Bank’s Response (continued) d) Public-Private Partnerships: Working with research organizations, academic institutions and in the case of our racial equity work, initiatives like the U.S. Treasury OCC’s Project REACh (Roundtable for Economic Access and Change) allows Citi the opportunity to direct private sector resources towards public-sector initiatives while also providing first-hand insight into the issues facing the clients, countries and communities with which we work. 2. Normalization of Feedback: Given the myriad streams of incoming feedback and the numerous potential impact areas identified by the pathways described above, we use the following tools to help identify which areas are the most salient and actionable: a) Materiality Assessments: We periodically conduct materiality assessments to identify our most relevant (or “material”) reporting topics from an ESG perspective — which is a broader standard than that used in our financial disclosures. Such assessments provide a methodological way to gauge and quantify the relative salience of potential impact areas to our key stakeholders. This assessment also mirrors — and informs — our increased strategic efforts on these issues. It has also driven our increased reporting on these material topics. b) Research: Citi maintains strong relationships with academic institutions, think tanks and industry groups that periodically publish reports highlighting developing trends and areas of economic and social impact. Citi also considers research conducted by our thought leadership group, Citi Global Perspectives & Solutions (Citi GPS), which analyzes the global economy’s most demanding challenges. c) Consideration of core business areas, products/services and the geographies we work in: Qualitative and quantitative factors such as market presence, sectoral exposure and revenue associated with certain businesses and regions may also contribute to our assessment of our potential impacts. Citi’s Initial Impact Areas The following describes considerations taken as part of our ESG impact analysis approach, which identified our two areas of greatest impact: climate change globally and racial equity in the United States. Note: As mentioned in our response to disclosure 1.1 of this index, during 2021, Citi was managed pursuant to two operating segments, ICG and GCB, and and the reporting structure changed in Q1 2022, as described on page 6 of our 2021 10-K. The findings below are based on the GCB and ICG reporting structure during 2021. However, we believe the conclusions will be applicable to the new structure in 2022. Scope and Scale: In our initial review of potential impact areas, we consider our core business activities under our two primary segments, GCB and ICG, the regions they serve and the revenues attributed to businesses within each. Regions: • GCB: North America; Latin America; Asia • ICG: North America; Europe, Middle East, and Africa (EMEA); Latin America; Asia Core Business Activities: • GCB: Retail banking; Branded cards; Retail services* • ICG: Investment banking (advisory and equity and debt underwriting), Markets (fixed income markets, equity markets, securities services and other), Treasury and trade solutions, Corporate lending and Private bank * This GCB business is in North America only Findings (Based on 2021 10-K filing): GCB: In 2021, revenues for retail banking activity in Latin America and Asia were nearly double the revenue of branded cards in these regions. In North America, the opposite was true, with branded cards exceeding retail banking revenues. However, absolute revenue from retail banking in North America was highest among the three regions. Likewise, aggregate revenue for all three GCB businesses in North America exceeded Latin America and Asia combined. ICG: Unlike GCB, which had a majority of its revenue concentrated in North America, revenues for aggregate ICG activity were more evenly distributed among the primary regions, reflecting this segment’s global work. Among the highest revenue-generating activities were markets and securities services (particularly fixed income activity) and treasury and trade solutions. Additionally, we consider activity outside of our core businesses. For example, through strategic grant-making efforts, the Citi Foundation promotes economic progress in low-income communities around the world, including programs that increase financial inclusion. The Citi Impact Fund is a $200 million venture capital fund with a mission of investing in double bottom line companies that are addressing societal changes. The fund prioritizes companies that are led or owned by women or racial/ethnic minorities and that are addressing societal challenges, such as reaching low- and moderate-income households with innovative financial and workforce services, delivering solutions for the climate transition economy and addressing needs for inclusive healthcare and housing. Initial Areas of Focus: GCB: Based on the screening above, we focused on North America, given the concentration of revenue generation there, and focused on global activity for ICG. While GCB revenue in North America during 2021 was driven by our branded cards activity, we feel that a focus on retail banking has more impact, considering the potential societal benefits from small business lending and greater access to financial services and credit through programs like the Citi ® Access Account Package. ICG: Although our fixed income markets and treasury and trade solutions activity generated the most revenue during 2021, they serve to support market-making activity and cash-management capacity for clients and thus have more indirect impact. We concluded that our corporate lending and underwriting activity is the most directly associated with impact, and that through these activities we can be more influential and actionable. This is supported by our industry group partnerships described in the Context and Relevance section below. Therefore, global corporate lending is the scope of our initial focus. Contents ESGatCiti SustainableFinance SustainableProgress Equitable&ResilientCommunities Talent&DEI RiskManagement&ResponsibleBusiness Appendices ESGS ataC ius niblnG 158
High-Level Summary of Bank’s Response (continued) We also consider activities of the Citi Foundation and Impact Fund, where they complement Citi’s ESG-related goals and efforts alongside our core business activities. In the future we will consider corporate underwriting. Context and Relevance From the feedback pathways described in the Citi’s Approach section above, we maintain awareness of the most relevant sustainable development challenges and priorities in the countries and regions in which we operate. Below, we discuss our focus on climate change mitigation globally and racial equity in the United States. Global Context: The climate crisis is one of the most critical challenges facing our global society and economy in the 21st century. The data is irrefutable and the world’s climate scientists agree: Urgent action must be taken to address the current and potential impacts of climate change, including chronic changes to temperature and precipitation, diminishing polar sea ice, rising sea levels and more intense and frequent extreme weather events. 2021 was the sixth warmest year on record. That year, we experienced devastating wildfires on the West Coast of the U.S. and in Australia, and one of the most active hurricane seasons in the Atlantic. Additionally, the Intergovernmental Panel on Climate Change’s (IPCC’s) 6th Assessment Report, released in 2021, further highlights the urgent need to address climate change. Reports also show that vulnerable and marginalized communities are likely to bear a disproportionate share of any physical climate impacts. U.S. Context: A wide range of data and studies have found that many major gaps in economic opportunity, education, income, housing and wealth run along racial lines, particularly between Black and white households. Some gaps remain wide 60 years after the civil rights movement and some, including in homeownership rates and college degree attainment, are even wider now. These gaps have not only had implications for Black Americans and other people of color but the broader economy as well. Over the last few years, the disproportionate impact of COVID-19 on communities of color and growing demand for racial justice further highlighted the impacts of racial inequity. Intensity and Salience Climate Change: We have employed a number of tools to assess the intensity and salience of climate change impacts: We published baseline emissions for our Energy and Power loan portfolios in accordance with the Partnership for Carbon Accounting Financials (PCAF) standard and established emissions targets, with intentions to analyze the emissions of other carbon-intensive sectors in the future. Several industry-wide initiatives also identify corporate lending as a key impact area with potential to mitigate climate change: • The PCAF standard was established to assess financed emissions with an initial focus on lending • The UNEP FI Guidelines for Climate Target Setting for Banks (“UNEP FI Guidelines”) focus on lending and investment activities • PCAF also formed a Capital Markets Working Group, with which Citi has been involved, to develop standards for measuring emissions associated with underwrit - ing activity — an area of activity that Citi will also explore for its potential impacts. Racial Equity: For over 20 years, Citi and the Citi Foundation have invested in organizations and partnerships that support financial inclusion and expanding economic opportunities for low- income families and communities of color, such as the Asset Building Policy Network. Through engagement with these and other stakeholders, including minority depository institutions (MDIs), we have enhanced our understanding of the structural inequities that fuel the racial wealth gap and their impact on communities. Numerous publications and research reports articulate the scale, intensity and salience of racial equity (see External References). Additionally, the Citi GPS report, Closing the Racial Inequality Gaps, articulates the economic impacts of the racial wealth gap. The analysis in the report shows that if four key racial gaps for Black people — wages, education, housing and investment — had been closed 20 years ago, $16 trillion could have been added to the U.S. economy. And if the gaps were closed as of 2020, $5 trillion could have been added to U.S. GDP over the next five years. Next Steps Our work towards addressing our areas of greatest impact is never complete, and we anticipate the following areas of activity as we move toward further implementation of the principles. Climate Change: As per our NZBA commitments, we will set targets for and establish baseline emissions for additional carbon-intensive sectors, such as Auto Manufacturing, Commercial Real Estate, Steel and Thermal Coal Mining, with additional sectors such as Agriculture, Aluminum, Cement, Iron and other segments of the Transportation sector to follow, as methodological capabilities evolve to accommodate them. Additionally, once a capital markets methodology is finalized and published by PCAF, Citi plans to integrate these emissions into annual disclosures and targets. Racial Equity: As discussed in the Action for Racial Equity section of this report, we seek to lead and expand firmwide engagement with MDIs, diverse broker-dealers and diverse asset managers through our newly formed Diverse Financial Institutions Group. We are also conducting a third-party racial equity audit to assess our efforts to address the racial wealth gap in the United States through implementation of Action for Racial Equity . Biodiversity: We recognize that loss of biodiversity globally is an increasing emergency, and we are continuing to expand our understanding of the complex dynamics between climate and biodiversity. These two topics are interconnected, and there are increasing concerns that climate change, along with other human activity, has significantly stressed natural systems and contributed to ongoing extinction events. Although there is increasing focus on biodiversity, there has historically been limited information available to understand how companies rely on and impact natural capital as well as natural capital’s impact on climate. Citi is a member of the Taskforce on Nature-Related Financial Disclosures (TNFD) Forum and participated in an informal working group prior to the TNFD’s launch to develop its workplan to create a complementary framework to TCFD focused on reporting evolving nature-related risks. For our impact analysis, we have identified impacts associated with our core businesses and their portfolios as described in the introduction to this section. We may further refine this process and increase the scope of our impact analysis as we explore different methodologies in subsequent reporting. Contents ESGatCiti SustainableFinance SustainableProgress Equitable&ResilientCommunities Talent&DEI RiskManagement&ResponsibleBusiness Appendices ESGS ataC ius niblnG 159
Reporting and Self- Assessment Requirements High-Level Summary of Bank’s Response References 2.2 Target Setting Show that the bank has set and published a minimum of two S pecific, M easurable (can be qualitative or quantitative), A chievable, R elevant and T ime-bound ( SMART ) targets, which address at least two of the identified “areas of most significant impact”, resulting from the bank’s activities and provision of products and services. Show that these targets are linked to and drive alignment with and greater contribution to appropriate SDGs, the goals of the Paris Agreement, and other relevant international, national or regional frameworks. The bank should have identified a baseline (assessed against a particular year) and have set targets against this baseline. Show that the bank has analysed and acknowledged significant (potential) negative impacts of the set targets on other dimensions of the SDG/climate change/society’s goals and that it has set out relevant actions to mitigate those as far as feasible to maximize the net positive impact of the set targets. As part of our initial impact analysis work, we have developed targets for each of the identified impact areas: Climate Change Net Zero Commitment: In 2021, we announced our commitment to net zero GHG emissions by 2050, including net zero GHG emissions for our own operations by 2030. In early 2022, we published our initial net zero plan, baseline emissions and interim 2030 targets for our Energy and Power loan portfolios. For more information, see the Climate Risk and Net Zero section of this report. $1 Trillion Commitment to Sustainable Finance: In 2021 we announced our $1 trillion sustainable finance by 2030 commitment, which includes a $500 Billion Environmental Finance Goal toward the financing and facilitation of a wide array of climate solutions, such as renewable energy, clean technology, water conservation and sustainable transportation. The $1 trillion commitment also includes $500 billion in social finance toward investments in affordable basic infrastructure, affordable housing, diversity and equity, economic inclusion, education, food security and healthcare. Thermal Coal Mining Exposure: Within our ESRM Policy, we have included a commitment to eliminate our exposure to thermal coal mining companies by 2030, and in early 2021, we also expanded our policy related to coal-fired power. For more information, see our Environmental and Social Policy Framework. These goals will drive alignment with SDGs 7 (Affordable and Clean Energy), 9 (Industry, Innovation, and Infrastructure) and 13 (Climate Action). Racial Equity Action for Racial Equity: In 2020, Citi and the Citi Foundation committed $1 Billion in strategic initiatives through 2023 to help close the racial wealth gap. Our pledge focuses on four key goals and outcomes: • Expand banking and access to credit in communities of color • Invest in Black entrepreneurship • Invest in affordable housing and promote the growth of Black homeownership • Strengthen Citi’s policies and practices in order to become an anti-racist institution These goals will drive alignment with SDGs 8 (Decent Work and Economic Growth) and 11 (Sustainable Cities and Communities). 2021 ESG Report: • Sustainable Finance • Climate Risk and Net Zero • Action for Racial Equity • Citi Impact Fund External References: • Action for Racial Equity • Environmental and Social Policy Framework • Net Zero Commitment We have established a firm-wide target for net zero emissions, updated our prior environmental finance target to be a comprehensive commitment to sustainable finance, which now includes social criteria, maintain Sector Approaches related to our exposure to the coal industry, and established goals under a racial equity initiative. We believe these are in line with the requirements of the Principles. Contents ESGatCiti SustainableFinance SustainableProgress Equitable&ResilientCommunities Talent&DEI RiskManagement&ResponsibleBusiness Appendices ESGS ataC ius niblnG 160
Reporting and Self- Assessment Requirements High-Level Summary of Bank’s Response References 2.3 Plans for Target Implementation and Monitoring Show that your bank has defined actions and milestones to meet the set targets. Show that your bank has put in place the means to measure and monitor progress against the set targets. Definitions of key performance indicators, any changes in these definitions, and any rebasing of baselines should be transparent. Measures and actions we plan to put in place: Climate Change: In early 2022, we released our 2021 TCFD Report, which highlights potential emissions-reduction approaches for our Energy and Power loan portfolios to reach net zero GHG emissions. In the initial net zero plan for these portfolios, we provide a phased timeline of actions and measures to achieve our interim 2030 targets including client transition assessment; advisory and finance; clean tech finance; public policy engagement, risk management; and portfolio management. These areas of activity are detailed further in the report. Racial Equity: In November 2021, we released our Year One Progress report, which summarizes progress made against our Action for Racial Equity commitments to help close the racial wealth gap and expand economic mobility for communities of color in the United States. The report also includes overviews on our approach to working with MDIs, providing venture capital to Black founders, supporting more equitable rental housing, embedding equity in asset management and leveraging philanthropy from the Citi Foundation to support small businesses. In October 2021, we committed to conduct an audit of Action for Racial Equity , which intends to assess the design and implementation of our effort and will help inform how to adapt and grow our work to address the racial wealth gap. Key Performance Indicators: Citi will report progress toward our targets annually using the key performance indicators listed below: Net Zero Commitment: • Emissions associated with key carbon-intensive sectors • Emissions associated with our operations $1 Trillion Sustainable Finance Commitment: • Financial performance broken down by region, criteria and business • Environmental and social impacts Thermal Coal Mining Credit Exposure: • Credit exposure to thermal coal companies Action for Racial Equity: • Growth in banking and access to credit in communities of color • Amount of equity investments in Black-owned firms • Amount of equity investments in MDIs • Growth of consumer lending capabilities that increase access to mortgage products and services 2021 ESG Report: • Sustainable Finance • Climate Risk and Net Zero • Action for Racial Equity • Citi Impact Fund External References: • 2021 TCFD Report • Action for Racial Equity • ARE Year One Progress Report • Environmental and Social Policy Framework • Net Zero Commitment Citi has established strategies and initiatives to implement the identified targets. We have identified key performance indicators that we will report annually to monitor progress toward these targets. While the provided indicators are not an exhaustive list, we anticipate that these metrics may evolve as we move further toward implementation. Contents ESGatCiti SustainableFinance SustainableProgress Equitable&ResilientCommunities Talent&DEI RiskManagement&ResponsibleBusiness Appendices ESGS ataC ius niblnG 161
Reporting and Self- Assessment Requirements High-Level Summary of Bank’s Response References 2.4 Progress on Implementing Targets For each target separately: Show that your bank has implemented the actions it had previously defined to meet the set target. Or explain why actions could not be implemented / needed to be changed and how your bank is adapting its plan to meet its set target. Report on your bank’s progress over the last 12 months (up to 18 months in your first reporting after becoming a signatory) toward achieving each of the set targets and the impact your progress resulted in (where feasible and appropriate, banks should include quantitative disclosures). Net Zero Commitment: Following the announcement of our net zero commitment in March 2021, in early 2022, we released our initial net zero plan for our Energy and Power loan portfolios, including baseline emissions and 2030 emissions reduction targets. We will continue our work to develop emissions baselines and targets for additional carbon-intensive sectors in our portfolio. $1 Trillion Sustainable Finance Goal: Building on our $250 Billion Environmental Finance Goal, we announced a commitment to a $1 trillion in sustainable finance by 2030. The commitment expands the prior $250 Billion Environmental Goal to $500 Billion and includes $500 Billion toward Social Finance. Detailed progress toward the first two years of tracking toward this commitment is provided in the Sustainable Finance section of this report. As of YE2021, we have financed and facilitated $163.1 billion toward our Environmental Finance Goal and $59.0 billion toward our Social Finance Goal for a total of $222.1 billion toward the $1 trillion commitment. Thermal Coal Mining Exposure: Following the publication of the 2020 baseline, we saw a reduction of 30% in 2021, as detailed in this report. Action for Racial Equity: By November 2021, one year into our three-year pledge, Citi and the Citi Foundation had already exceeded our $1 billion commitment to invest in initiatives expanding economic opportunity for communities of color. For more details, please refer to the Equitable and Resilient Communities section in this report. 2021 ESG Report: • Sustainable Finance • Climate Risk and Net Zero • Action for Racial Equity External References: • 2021 TCFD Report • Action for Racial Equity • Environmental and Social Policy Framework • Net Zero Commitment We have set the targets described above and are in the early stages of implementing the measures we have put in place. In some cases, such as for our Action for Racial Equity , Citi and the Citi Foundation have exceeded the initiative’s financial targets. We will report on progress made toward achieving our targets in our subsequent reporting. Principle 3: Clients and Customers We will work responsibly with our clients and our customers to encourage sustainable practices and enable economic activities that create shared prosperity for current and future generations. 3.1 Provide an overview of the policies and practices your bank has in place and/or is planning to put in place to promote responsible relationships with its customers. This should include high-level information on any programmes and actions implemented (and/or planned), their scale and, where possible, the results thereof. Citi has a number of policies and systems in place to ensure we treat customers responsibly and fairly: • Citi Code of Conduct • Citi’s Treating Customers Fairly Principles • Global Consumer Fairness Policy • Global Financial Access Policy More details can be found in the Serving Our Customers and Clients Responsibly section of this report. 2021 ESG Report: • Serving our Customers and Clients Responsibly External References: • Citi Code of Conduct Contents ESGatCiti SustainableFinance SustainableProgress Equitable&ResilientCommunities Talent&DEI RiskManagement&ResponsibleBusiness Appendices ESGS ataC ius niblnG 162
Reporting and Self- Assessment Requirements High-Level Summary of Bank’s Response References 3.2 Describe how your bank has worked with and/or is planning to work with its clients and customers to encourage sustainable practices and enable sustainable economic activities. This should include information on actions planned/implemented, products and services developed, and, where possible, the impacts achieved. Through our $1 trillion commitment to sustainable finance, we will finance and facilitate a wide array of climate solutions, such as renewable energy, clean technology, water conservation and sustainable transportation as well as activities in social finance, which include investments in education, affordable housing and basic infrastructure, healthcare, economic inclusion and food security. Reaching the goal will require the development of innovative financing solutions, increasing engagement and helping clients across all sectors, no matter where they are in their own sustainability journeys, to enable more sustainable business models and practices. For more information, please see the Sustainable Finance section in this report. To facilitate these transitions, we have established dedicated teams embedded across our businesses to offer strategic sustainability and ESG services and solutions. Our business groups, including Banking, Capital Markets and Advisory; Global Markets; Global Wealth Management; and Treasury and Trade Solutions, all have dedicated bankers or teams focused on advising clients and offering customized ESG-themed products and services. Under our net zero commitment, we will engage clients in carbon-intensive sectors that have low-carbon transition opportunities. We have formed specialized business units to work closely with clients to support their business plans as they transition to net zero including the Natural Resources & Clean Energy Transition team; the Sustainability & Corporate Transitions team; and the Sustainable Debt Capital Markets team. For more information, please see our 2021 TCFD Report. Our ESRM Policy helps us finance projects and activities responsibly by engaging our clients on environmental and social risks and good practices. Ongoing engagement with our clients is an important part of our ESRM process. When we first established our ESRM Policy, our engagements were tied to specific, project-related financial transactions and their associated environmental and social risks and mitigation efforts. However, as we have developed Sector Approaches and Areas of High Caution over the years, we have added corporate-level reviews and client engagements in a number of sectors. These sector-specific risk review processes encourage dialogue between Citi and our clients about the material environmental and social risks associated with their operations, enabling us to develop a better understanding of prevailing industry practices and our clients’ performance and guide our clients toward better sustainability practices. 2021 ESG Report: • Sustainable Finance • Climate Risk and Net Zero • Risk Management > Environmental and Social Risk Management External References: • 2021 TCFD Report • Environmental and Social Policy Framework • Net Zero Commitment Principle 4: Stakeholders We will proactively and responsibly consult, engage and partner with relevant stakeholders to achieve society’s goals. 4.1 Describe which stakeholders (or groups/types of stakeholders) your bank has consulted, engaged, collaborated or partnered with for the purpose of implementing these Principles and improving your bank’s impacts. This should include a high- level overview of how your bank has identified relevant stakeholders and what issues were addressed/results achieved. Citi believes that we are best able to drive business value when we serve the interests of a wide array of stakeholders, including our shareholders. We made a deliberate effort to continue stakeholder engagement in a pandemic environment. To fulfill this approach, we regularly review our stakeholder partnerships across a range of functions, including Global Public Affairs, Investor Relations, Human Resources and Corporate Governance, as well as Sustainability & ESG, Government Affairs and other teams in Public Affairs. A summary of the groups we have engaged with, the topics addressed, and results achieved is provided in Stakeholder Engagement section of this report. We also highlight our climate-related engagement with clients and trade associations in our 2021 TCFD Report. 2021 ESG Report: • Stakeholder Engagement • Climate Risk and Net Zero > Participation in Net Zero Frameworks • Climate Risk and Net Zero > Engagement • Risk Management > Client Engagement External References: • 2021 TCFD Report Contents ESGatCiti SustainableFinance SustainableProgress Equitable&ResilientCommunities Talent&DEI RiskManagement&ResponsibleBusiness Appendices ESGS ataC ius niblnG 163
Reporting and Self- Assessment Requirements High-Level Summary of Bank’s Response References Principle 5: Governance & Culture We will implement our commitment to these Principles through effective governance and a culture of responsible banking. 5.1 Describe the relevant governance structures, policies and procedures your bank has in place/is planning to put in place to manage significant positive and negative (potential) impacts and support effective implementation of the Principles. Citi’s Board of Directors plays an important role in providing oversight of our efforts to ensure responsible business practices. For example, the Nomination, Governance and Public Affairs Committee (NGPAC) of the Board oversees Citi’s global ESG activities and performance, and the Risk Management Committee (RMC) provides oversight of Citi’s Risk Management function, reviews Citi’s risk appetite framework, including reputational risk appetite, and reviews key risk policies, including those focused on environmental and social risk. The Ethics, Conduct and Culture Committee of the Board oversees management’s efforts to foster a culture of ethics within the company and receives regular reports from senior management on the progress of those efforts. In 2021, we formed a new Global ESG Council consisting of senior members of management in order to provide enhanced oversight of our ESG activities and goals. Additionally, to support the development and launch of our net zero plan, we formed a Net Zero Task Force in 2021. The Task Force, led by our CSO, includes leaders from diverse business units and many other functions throughout Citi. Citi also has a Global Sustainability Steering Committee, a senior-level committee formed to advise on our sustainability and climate change strategy. For more details on governance for ESG and sustainability issues, please refer to the ESG Governance section of this report. For more details on Citi’s climate change governance, please see our 2021 TCFD Report. 2021 ESG Report: • ESG Governance at Citi External References: • 2021 TCFD Report • Ethics, Conduct and Culture Committee Charter • Nomination, Governance and Public Affairs Committee Charter • Risk Management Committee Charter Contents ESGatCiti SustainableFinance SustainableProgress Equitable&ResilientCommunities Talent&DEI RiskManagement&ResponsibleBusiness Appendices ESGS ataC ius niblnG 164
Reporting and Self- Assessment Requirements High-Level Summary of Bank’s Response References 5.2 Describe the initiatives and measures your bank has implemented or is planning to implement to foster a culture of responsible banking among its employees. This should include a high-level overview of capacity building, inclusion in remuneration structures and performance management and leadership communication, amongst others. Citi has implemented a number of programs and initiatives that instill a culture of responsible banking among its employees, listed below: Cod e of Conduct: Citi’s Code of Conduct outlines the standards of ethics and professional behavior expected of employees and representatives of Citi when dealing with clients, business colleagues, shareholders, communities and each other. It also provides an overview of key legal and regulatory requirements and select global policies. Citi’s Code of Conduct applies to all directors, officers and employees of Citi worldwide. Upon joining Citi, employees must acknowledge that they have read and will comply with our Code. Programs and Training: Citi has policies, procedures and internal controls to comply with anti-bribery laws, and we conduct an annual bribery risk assessment of all global business lines. We provide our staff with anti-bribery training annually and supplement it with targeted training and communications as needed. Citi’s Anti-Money Laundering (AML) Program protects our clients, our franchise and the global financial system from the risks of money laundering and terrorist financing. The program includes more than 5,600 employees globally, including 225 designated AML Country Officers covering every Citi business, function and geographic area. Global Financial Crimes Investigations and Intelligence (GFCII) tackles financial crime and provides a globally consistent approach to the prevention and detection of risk. GFCII leverages partnerships with law enforcement, nonprofits and internal stakeholders to obtain actionable intelligence, allowing for proactive identification of illicit activity and effective mitigation of risk. Our Sanctions Program includes policies and procedures, risk category statement and tolerance thresholds, enterprise-wide screening, annual risk assessments and audits of sanctions control processes, employee training and a diverse team of Compliance professionals stationed around the world. For more information, please see Managing Corruption and Tax-Related Risks section of this report. ESRM Training: Key risk and banking personnel are provided with annual training on our ESRM Policy to help them identify triggers for engagement with our specialist ESRM team. For more information, please see the ESRM Management section of this report. Serving Our Customers and Clients Responsibly: We have policies and systems in place to help ensure that we treat customers responsibly and fairly including our Code of Conduct, responsible marketing practices, our Treating Customers Fairly Principles, our Global Financial Access Policy and our Global Consumer Fairness Policy. Remuneration: The Personnel and Compensation Committee of the Board holds senior executives responsible, and in turn senior executives hold their team members responsible, for managing our sustainability and other ESG- related efforts through incentive compensation decisions. Citi’s incentive compensation program is discretionary, not formulaic. For details on ESG- linked remuneration for key executives and managers, please refer to the Remuneration section of this report. 2021 ESG Report: • ESG Governance at Citi > Remuneration • Our Transformation > Ethics and Culture at Citi • Risk Management > Managing Corruption and Tax-Related Risks • Risk Management > ESRM Training • Serving Our Customers and Clients Responsibly External References: • Citi Code of Conduct Contents ESGatCiti SustainableFinance SustainableProgress Equitable&ResilientCommunities Talent&DEI RiskManagement&ResponsibleBusiness Appendices ESGS ataC ius niblnG 165
Reporting and Self- Assessment Requirements High-Level Summary of Bank’s Response References 5.3 Governance Structure for Implementation of the Principles Show that your bank has a governance structure in place for the implementation of the PRB, including: a) target-setting and actions to achieve targets set b) remedial action in the event of targets or milestones not being achieved or unexpected negative impacts being detected. Our Sustainability & ESG team, in collaboration with partners across the bank, is responsible for developing sustainability and climate-related targets, monitoring progress toward their achievement to ensure we are on track and identifying and addressing any unexpected negative impacts. Our Chief Sustainability Officer, Head of Community Investing and Development and other senior executives have oversight over target-setting, measures put in place to achieve the targets and determining remedial action where targets are not on track, or where measures need to be put in place to address unforeseen negative impacts. We track our progress toward achieving our targets via reports to the NGPAC and/or the full Board of Directors. The Chief Sustainability Officer and Head of Community Investing and Development periodically report to the Board on progress made with achieving our targets and any remedial action taken to ensure achievement of targets and/or how negative impacts were addressed. Reports are also provided to the Global ESG council on a periodic basis for progress towards our Action for Racial Equity commitments, $1 trillion sustainable finance commitment and net zero targets. 2021 ESG Report: • ESG Governance at Citi • Our Transformation > Ethics and Culture at Citi We have progressed substantially in fulfilling this requirement. The firm has a governance structure with oversight of ESG issues and will ensure that the Principles are implemented, managing significant impacts and setting and monitoring targets. The Sustainability & ESG team leads day-to-day implementation of the Principles in concert with other teams throughout the organization. Principle 6: Transparency & Accountability We will periodically review our individual and collective implementation of these Principles and be transparent about and accountable for our positive and negative impacts and our contribution to society’s goals. 6.1 Progress on Implementing the Principles for Responsible Banking Show that your bank has progressed on implementing the six Principles over the last 12 months (up to 18 months in your first reporting after becoming a signatory) in addition to the setting and implementation of targets in minimum two areas (see 2.1-2.4). Show that your bank has considered existing and emerging international/ regional good practices relevant for the implementation of the six Principles for Responsible Banking. Based on this, it has defined priorities and ambitions to align with good practice. Show that your bank has implemented/ is working on implementing changes in existing practices to reflect and be in line with existing and emerging international/regional good practices and has made progress on its implementation of these Principles. In 2021, Citi made considerable progress toward implementing the Principles and our targets, as described below. Net Zero Commitment: In January 2022, we released our initial net zero plan, including baseline emissions and 2030 emissions reduction targets for our Energy and Power loan portfolios. Additionally, in developing our initial net zero plan, we have participated in key net zero frameworks, including our continued participation in PCAF as well as the NZBA and the Glasgow Financial Alliance for Net Zero (GFANZ) of which we are founding members. For more information on these organizations and how they serve as converging net zero guideposts across the financial industry, please see our 2021 TCFD Report. Citi remains committed to working closely with clients to support their business plans as they transition to net zero. In March 2021, we created the Natural Resources & Clean Energy Transition team in order to drive client engagement efforts in the Energy, Power and Chemicals sectors. This team includes corporate and investment bankers with deep knowledge of these sectors and unites them under a single umbrella to more effectively evaluate and pursue opportunities to assist our clients with the net zero transition. $1 Trillion Sustainable Finance Commitment: We recently established a $1 trillion by 2030 sustainable finance commitment, which expands our Environmental Finance Goal to $500 billion, with a focus on circular economy, clean technology, energy efficiency, green buildings, renewable energy, sustainable agriculture and land use, sustainable transportation and water quality and conservation. This commitment also includes $500 billion in social finance activity in affordable basic infrastructure, affordable housing, diversity and equity, economic inclusion, education, food security and healthcare. The expanded emphasis on social finance allows Citi to address a more holistic set of societal needs, in addition to protecting the environment and fighting global climate change, all supporting the UN SDGs. Multiple businesses and banking teams across Citi contribute environmental and social activities that count toward the $1 trillion sustainable finance commitment. Progress toward the $1 trillion commitment can be found in the Sustainable Finance section of this report. 2021 ESG Report: • Citi and the Sustainable Development Goals • Our $1 Trillion Commitment • Climate Risk and Net Zero • Our Commitment to Social Finance • Risk Management > Environmental and Social Risk Management External References: • 2021 TCFD Report • Action for Racial Equity Contents ESGatCiti SustainableFinance SustainableProgress Equitable&ResilientCommunities Talent&DEI RiskManagement&ResponsibleBusiness Appendices ESGS ataC ius niblnG 166
High-Level Summary of Bank’s Response (continued) Climate Risk: In early 2022, we released our 2021 TCFD Report, detailing our continued work to incorporate climate risk and opportunity identification and management into our overall business strategy and efforts. Additionally, during 2021, we expanded our climate change governance through the formation of a Global ESG Council, consisting of senior members of management. We also grew our dedicated Climate Risk team to accommodate additional areas of expertise. For more information, please see our 2021 TCFD Report. Action for Racial Equity: By November 2021 — one year into our three-year pledge — Citi and the Citi Foundation had already invested $1 billion into initiatives expanding economic opportunity for communities of color, putting us on track to exceed our original $1.1 billion commitment set in 2020. In 2021, we created a Diverse Financial Institutions Group, a dedicated team within Citi that is serving as a hub to lead and expand firmwide engagement with MDIs, diverse broker-dealers and diverse asset managers. Additionally, we have committed to conducting a Racial Equity Audit to evaluate our Action for Racial Equity work by the end of 2022. For more information, see the Action for Racial Equity section in this report. Engagement on SDGs: Citi remains a member of the GISD Alliance, which includes 30 of the world’s largest investors committed to accelerating the financing of the SDGs. Biodiversity: Following our participation in the informal working group for the TNFD, we have become a member of the TNFD Forum. Through our ongoing collaboration with TNFD, we are able to contribute to the development of nature-related reporting norms and standards and continue to refine our understanding of the complex dynamics between climate and biodiversity and our connection to those impacts through our financial relationships with our clients. Citi has made considerable progress towards implementing the principles including, identifying areas of impact, setting targets related to these impact areas and setting up internal resources to support the implementation of these targets and the Principles throughout the firm. Contents ESGatCiti SustainableFinance SustainableProgress Equitable&ResilientCommunities Talent&DEI RiskManagement&ResponsibleBusiness Appendices ESGS ataC ius niblnG 167
Task Force on Climate-related Financial Disclosures Index The following table indicates where readers can find information that addresses the TCFD requirements, either in this report or other publicly avail - able documents. In addition, see our 2021 TCFD Report , which includes detailed information in response to TCFD requirements. Disclosure Report Section or Other Documentation Governance a) Describe the Board’s oversight of climate-related risks and opportunities. • 2021 TCFD Report • Nomination, Governance and Public Affairs Committee Charter b) Describe management’s role in assessing and managing climate- related risks and opportunities. • Climate Risk and Net Zero • 2021 TCFD Report Strategy a) Describe the climate-related risks and opportunities the organization has identified over the short, medium and long term. • Our $1 Trillion Commitment • Financing the Low-Carbon Transition • Climate Risk and Net Zero • 2021 TCFD Report • Citi’s Environmental and Social Policy Framework b) Describe the impact of climate- related risks and opportunities on the organization’s businesses, strategy and financial planning. • Financing the Low-Carbon Transition • Climate Risk and Net Zero • Sustainable Operations • Citi’s Environmental and Social Policy Framework c) Describe the resilience of the organization’s strategy, taking into consideration different climate- related scenarios, including a 2°C or lower scenario. • Climate Risk and Net Zero • Sustainable Operations > Managing Climate Risk in Our Operations • 2021 TCFD Report Risk Management a) Describe the organization’s processes for identifying and assessing climate-related risks. • Climate Risk and Net Zero • Risk Management > Environmental and Social Risk Management • Citi’s Environmental and Social Policy Framework b) Describe the organization’s processes for managing climate- related risks. • Climate Risk and Net Zero • Sustainable Operations > Managing Climate Risk in Our Operations • Risk Management > Environmental and Social Risk Management • Citi’s Environmental and Social Policy Framework c) Describe how processes for identifying, assessing and managing climate-related risks are integrated into the organization’s overall risk management. • Climate Risk and Net Zero • Sustainable Operations > Managing Climate Risk in Our Operations • Risk Management > Environmental and Social Risk Management • Citi’s Environmental and Social Policy Framework • 2021 10-K pages 118–119 Contents ESGatCiti SustainableFinance SustainableProgress Equitable&ResilientCommunities Talent&DEI RiskManagement&ResponsibleBusiness Appendices ESGS ataC ius niblnG 168
Disclosure Report Section or Other Documentation Metrics and Targets a) Disclose the metrics used by the organization to assess climate- related risks and opportunities in line with its strategy and risk management process. • Our $1 Trillion Commitment • Climate Risk and Net Zero • Financing the Low-Carbon Transition • Sustainable Operations > Net Zero Commitment • Sustainable Operations > Operational Footprint Goals • Risk Management > Environmental and Social Risk Management • 2021 TCFD Report • Citi’s Environmental and Social Policy Framework b) Disclose Scope 1, Scope 2 and, if appropriate, Scope 3 greenhouse gas emissions, and the related risks. • Climate Risk and Net Zero • Sustainable Operations > Environmental Performance for Operations • Sustainable Operations > Environmental Impact Report • 2021 TCFD Report c) Describe the targets used by the organization to manage climate- related risks and opportunities and performance against targets. • Our $1 Trillion Commitment • Financing the Low-Carbon Transition • Climate Risk and Net Zero > Our Commitment to Reduce Financing for Coal • Climate Risk and Net Zero > Portfolio Analysis and Measurement • Sustainable Operations > Net Zero Commitment • Sustainable Operations > Operational Footprint Goals • Sustainable Operations > Environmental Performance for Operations Contents ESGatCiti SustainableFinance SustainableProgress Equitable&ResilientCommunities Talent&DEI RiskManagement&ResponsibleBusiness Appendices ESGS ataC ius niblnG 169
United Nations Global Compact Index This report serves as our 2021 communication on progress for the United Nations Global Compact (UNGC). Citi joined the UNGC in 2010, and we continue to embed the Compact’s 10 principles across our business and report on activities related to human rights, labor issues, the environment and anti-corruption. “Citi’s ongoing support and participation in the United Nations Global Compact reinforce our ESG agenda and work to support our clients, colleagues and communities. From enabling the transition to a net zero economy, to supporting the equitable growth of underserved communities around the world, we’re committed to continue playing our part to build a better world.” JANE FRASER, CHIEF EXECUTIVE OFFICER UNGC Principle Report section or other documentation Human Rights Principle 1: Businesses should support and respect the protection of internationally proclaimed human rights; and • Human Rights > Our Commitment to Respect Human Rights • Human Rights > Identifying Human Rights Risks in Transactions • Citi Code of Conduct • Citi Statement on Human Rights Principle 2: make sure that they are not complicit in human rights abuses. • Risk Management > Environmental and Social Risk Management • Human Rights • Citi Statement on Human Rights Labor Principle 3: Businesses should uphold the freedom of association and the effective recognition of the right to collective bargaining; • Human Rights > Respecting the Human Rights of Our Employees • Citi Statement on Human Rights Principle 4: the elimination of all forms of forced and compulsory labor; • Human Rights > Addressing Forced Labor in Malaysia • Human Rights > Extending Respect for Human Rights Through Our Suppliers • Human Rights > Respecting Human Rights in Our Financing Decisions • Citi Statement of Supplier Principles • Citi Statement on Human Rights • Citi Modern Slavery Disclosures Principle 5: the effective abolition of child labor; and • Human Rights > Respecting Human Rights in Our Financing Decisions • Citi Statement of Supplier Principles • Citi Statement on Human Rights • Citi Modern Slavery Disclosures Principle 6: the elimination of discrimination in respect of employment and occupation. • Action for Racial Equity > Action for Racial Equity: An Update on Our Progress • Diversity, Equity & Inclusion • Human Rights > Respecting the Human Rights of Our Employees • Human Rights > Extending Respect for Human Rights Through Our Suppliers • Citi Code of Conduct • Citi Requirements for Suppliers • Citi Statement of Supplier Principles • Citi Statement on Human Rights • Citi U.S. Affirmative Action and Equal Employment Opportunity Policy Statement Environment Principle 7: Businesses should support a precautionary approach to environmental challenges; • Climate Risk and Net Zero • Risk Management > Environmental and Social Risk Management Contents ESGatCiti SustainableFinance SustainableProgress Equitable&ResilientCommunities Talent&DEI RiskManagement&ResponsibleBusiness Appendices ESGS ataC ius niblnG 170
UNGC Principle Report section or other documentation Principle 8: undertake initiatives to promote greater environmental responsibility; and • Our $1 Trillion Commitment • Financing the Low-Carbon Transition • Climate Risk and Net Zero • Sustainable Operations • Responsible Sourcing > Supplier Engagement and Evaluation • Responsible Sourcing > Supply Chain Sustainability Focus Areas Principle 9: encourage the development and diffusion of environmentally friendly technologies. • Our $1 Trillion Commitment • Financing the Low-Carbon Transition • Climate Risk and Net Zero Anti-corruption Principle 10: Businesses should work against corruption in all its forms, including extortion and bribery. • Risk Management > Managing Corruption and Tax-Related Risks • Anti-Bribery Program • Anti-Money Laundering Program • Citi Code of Conduct • Citi Requirements for Suppliers • Citi Statement of Supplier Principles Contents ESGatCiti SustainableFinance SustainableProgress Equitable&ResilientCommunities Talent&DEI RiskManagement&ResponsibleBusiness Appendices ESGS ataC ius niblnG 171
United Nations Guiding Principles Reporting Framework Index We have included information and disclosures in this report aligned with the United Nations Guiding Principles reporting framework. This reflects our support of the UN Guiding Principles on Business and Human Rights and our commitment to transparency and accountability regarding our hu - man rights-related activities and policies. The following table indicates where readers can find information that addresses the framework require - ments, either in this report or other publicly available documents. Section of the Framework Report Section or Other Documentation Part A: Governance of Respect for Human Rights Policy commitment A1 What does the company say publicly about its commitment to respect human rights? A1.1 How has the public commitment been developed? • Human Rights > Our Commitment to Respect Human Rights A1.2 Whose human rights does the public commitment address? • Human Rights > Our Commitment to Respect Human Rights • Citi Statement on Human Rights A1.3 How is the public commitment disseminated? • Our Transformation > Code of Conduct The following documents, which state Citi’s commitment to respect human rights and our expectations about the commitment of others, are posted publicly: • Citi Code of Conduct • Citi Requirements for Suppliers • Citi Statement of Supplier Principles • Citi Statement on Human Rights Embedding respect for human rights A2 How does the company demonstrate the importance it attaches to the implementation of its human rights commitment? A2.1 How is day-to-day responsibility for human rights performance organized within the company, and why? • ESG Governance at Citi • Diversity, Equity & Inclusion • Risk Management > Safeguarding Data and Protecting Customer Information • Risk Management > Policy Implementation • Human Rights > Due Diligence in Client Transactions • Responsible Sourcing A2.2 What kinds of human rights issues are discussed by senior management and by the Board, and why? • Human Rights > Our Salient Human Rights Risks A2.3 How are employees and contract workers made aware of the ways in which respect for human rights should inform their decisions and actions? • Our Transformation > Code of Conduct • Risk Management > ESRM Training • Human Rights > Respecting the Human Rights of Our Employees • Human Rights > Learning and Engagement • Citi Code of Conduct A2.4 How does the company make clear in its business relationships the importance it places on respect for human rights? • Risk Management > Policy Implementation • Human Rights > Extending Respect for Human Rights Through Our Suppliers • Human Rights > Respecting Human Rights in Our Financing Decisions • Responsible Sourcing > Supplier Engagement and Evaluation • Citi Requirements for Suppliers • Citi Statement of Supplier Principles A2.5 What lessons has the company learned during the reporting period about achieving respect for human rights, and what has changed as a result? • Action for Racial Equity > Action for Racial Equity: An Update on Our Progress • Using Our Corporate Voice to Drive Change • Human Rights Contents ESGatCiti SustainableFinance SustainableProgress Equitable&ResilientCommunities Talent&DEI RiskManagement&ResponsibleBusiness Appendices ESGS ataC ius niblnG 172
Section of the Framework Report Section or Other Documentation Part B: Defining the Focus of Reporting Statement of salient issues B1 State the salient human rights issues associated with the company’s activities and business relationships during the reporting period. • Human Rights > Our Salient Human Rights Risks • Human Rights > Salient Human Rights Risks: Stakeholder Impacts • Human Rights > Identifying Human Rights Risks in Transactions • Citi Statement on Human Rights Determination of salient issues B2 Describe how the salient human rights issues were determined, including any input from stakeholders. • Human Rights > Our Commitment to Respect Human Rights Choice of focal geographies B3 If reporting on the salient human rights issues focuses on particular geographies, explain how that choice was made. This report provides a breakdown of our human rights due diligence for several salient risks at the project level and a separate breakdown of our due diligence of these and other environmental and social risks at the regional and sector levels for purposes of fulfilling the transparency requirements of the Equator Principles . • Risk Management > 2021 Projects Covered by the Equator Principles • Risk Management > ESRM Consultation Data • Human Rights > Identifying Human Rights Risks in Transactions Additional severe impacts B4 Identify any severe impacts on human rights that occurred or were still being addressed during the reporting period, but which fall outside of the salient human rights issues, and explain how they have been addressed. Part C: Management of Salient Human Rights Issues Specific policies C1 Does the company have any specific policies that address its salient human rights issues and, if so, what are they? C1.1 How does the company make clear the relevance and significance of such policies to those who need to implement them? • Risk Management > ESRM Training • Human Rights > Respecting the Human Rights of Our Employees • Human Rights > Employee Training • Responsible Sourcing > Supplier Engagement and Evaluation • Citi Code of Conduct • Citi Requirements for Suppliers • Citi Statement of Supplier Principles Stakeholder engagement C2 What is the company’s approach to engagement with stakeholders in relation to each salient human rights issue? C2.1 How does the company identify which stakeholders to engage with in relation to each salient issue, and when and how to do so? • Stakeholder Engagement at Citi • Risk Management > Monitoring the Changing Risk Landscape • Human Rights > Engaging Stakeholders • Responsible Sourcing > Supplier Engagement and Evaluation C2.2 During the reporting period, which stakeholders has the company engaged with regarding each salient issue, and why? • Human Rights > Engaging Stakeholders • Responsible Sourcing > Supplier Engagement and Evaluation C2.3 During the reporting period, how have the views of stakeholders influenced the company’s understanding of each salient issue and/or its approach to addressing it? • Human Rights > Engaging Stakeholders Contents ESGatCiti SustainableFinance SustainableProgress Equitable&ResilientCommunities Talent&DEI RiskManagement&ResponsibleBusiness Appendices ESGS ataC ius niblnG 173
Section of the Framework Report Section or Other Documentation Assessing impacts C3 How does the company identify any changes in the nature of each salient human rights issue over time? C3.1 During the reporting period, were there any notable trends or patterns in impacts related to a salient issue and, if so, what were they? • Human Rights > Addressing Forced Labor in Malaysia • Human Rights > Identifying Human Rights Risks in Transactions C3.2 During the reporting period, did any severe impacts occur that were related to a salient issue and, if so, what were they? Integrating findings and taking action C4 How does the company integrate its findings about each salient human rights issue into its decision-making processes and actions? C4.1 How are those parts of the company whose decisions and actions can affect the management of salient issues, involved in finding and implementing solutions? • ESG Governance at Citi • Risk Management > Environmental and Social Risk Management • Human Rights > Respecting Human Rights in Our Financing Decisions C4.2 When tensions arise between the prevention or mitigation of impacts related to a salient issue and other business objectives, how are these tensions addressed? • Risk Management > Policy Implementation • Human Rights > Respecting Human Rights in Our Financing Decisions C4.3 During the reporting period, what action has the company taken to prevent or mitigate potential impacts related to each salient issue? • Action for Racial Equity > Action for Racial Equity: An Update on Our Progress • Affordable Housing • Diversity, Equity & Inclusion • Risk Management > Safeguarding Data and Protecting Customer Information • Human Rights > Addressing Forced Labor in Malaysia • Human Rights > Respecting the Human Rights of Our Employees • Human Rights > Protection of Indigenous Rights in Latin America • Human Rights > Identifying Human Rights Risks in Transactions Tracking performance C5 How does the company know if its efforts to address each salient human rights issue are effective in practice? C5.1 What specific examples from the reporting period illustrate whether each salient issue is being managed effectively? In 2021, we identified risks of impacts to racial/ethnic minorities in global supply chains. We took steps to mitigate the risks of our involvement in such impacts by limiting the scope of our financing to clients in some cases and ceasing business relationships in others. In particular, we enhanced our governance of human rights risks in the Asia Pacific region with a special Human Rights Task Force and also initiated a portfolio review of the Malaysia franchise, to evaluate forced labor concerns in clients’ operations across different industries. In addition, see the case studies below. • Our $1 Trillion Commitment > Sustainable Finance in Action • Human Rights > Addressing Forced Labor in Malaysia • Human Rights > Protection of Indigenous Rights in Latin America • Human Rights > Identifying Human Rights Risks in Transactions • Responsible Sourcing > Supplier Engagement and Evaluation Contents ESGatCiti SustainableFinance SustainableProgress Equitable&ResilientCommunities Talent&DEI RiskManagement&ResponsibleBusiness Appendices ESGS ataC ius niblnG 174
Section of the Framework Report Section or Other Documentation Remediation C6 How does the company enable effective remedy if people are harmed by its actions or decisions in relation to a salient human rights issue? C6.1 Through what means can the company receive complaints or concerns related to each salient issue? • Our Transformation > Escalating Business and Ethical Concerns • Human Rights > Reporting Mechanisms for Stakeholders • Citi Code of Conduct C6.2 How does the company know if people feel able and empowered to raise complaints or concerns? • Risk Management > Assessing Our Culture of Ethics C6.3 How does the company process complaints and assess the effectiveness of outcomes? • Our Transformation > Assessing Our Culture of Ethics • Our Transformation > Escalating Business and Ethical Concerns • Human Rights > Providing Access to Remedy • Human Rights > Reporting Mechanisms for Stakeholders • Citi Code of Conduct C6.4 During the reporting period, what were the trends and patterns in complaints or concerns and their outcomes regarding each salient issue, and what lessons has the company learned? • Action for Racial Equity • Human Rights > Identifying Human Rights Risks in Transactions C6.5 During the reporting period, did the company provide or enable remedy for any actual impacts related to a salient issue and, if so, what are typical or significant examples? • Human Rights > Providing Access to Remedy Contents ESGatCiti SustainableFinance SustainableProgress Equitable&ResilientCommunities Talent&DEI RiskManagement&ResponsibleBusiness Appendices ESGS ataC ius niblnG 175
Assurance Greenhouse Gas Verification Opinion Number UK.PRS.V OL.INV.0100. 2021 / 2022/04/07 T he inventory of Greenhouse Gas emissions and environmental data in the period 1 st January 2021 – 31 st December 2021 for Citigroup, Inc. 388 Greenwich Street New York, NY, 10013 has been verified in accordance with ISO 14064 - 3:20 19 and the principles of completeness, transparency, accuracy, consistency and relevance To represent a total amount of: 44,683 tCO 2 e of GHG emissions Scope 1 463 ,311 tCO 2 e of GHG emissions Scope 2 ( location based) 60, 979 tCO 2 e of GHG emissions Scope 2 ( market based) 507, 994 tCO 2 e of total GHG emissions Scopes 1 and 2, based on Scope 2 location - based emissions 10, 586 tCO 2 e of GHG emissions Scope 3 1,110. 83 GWh of electricity consumption 26. 35 GWh of district heating and cooling 178 .00 GWh of natural gas 0.74 GWh of LPG 0.0 2 GWh of fuel oil 31. 59 GWh of diesel 5, 824 metric tonnes of waste diverted from landfill 25, 595 metric tonnes of total waste 3, 366 ,620 cubic meters of potable water consumed 253 ,010 cubic meters of non -potable water consumed 10, 554 tCO 2 e from business travel by air 32 tCO 2 e from business travel by rail The inventory of Greenhouse Gas emissions has been verified as meeting the requirements of the WRI/WBCSD GHG Protocol – A Corporate Accounting and Reporting Standard and the GHG Protocol – Scope 2 Guidance – Amendment to the GHG Protocol Corporate Standard . For the following activities Banking and Finance Lead Assessor: Clare Robertson Technical Reviewer: Paulomi Raythatha Authorised by: Pamela Chadwick SGS United Kingdom Ltd Verification Opinion Date : 6 th April 20 22 This Opinion is not valid without the full verification scope, objectives, criteria and conclusion available on pages 2 to 5 of this Opinion . Contents ESGatCiti SustainableFinance SustainableProgress Equitable&ResilientCommunities Talent&DEI RiskManagement&ResponsibleBusiness Appendices ESGS ataC ius niblnG 176
Assurance Schedule A ccompanying Greenhouse Gas Verification Opinion Number UK.PRS.V OL.INV.0100. 2021 / 2022/04/07 Brief Description of Verification Process SGS has been contracted by Citigroup, Inc. for the verification of direct and indirect carbon dioxide (CO 2 ) equivalent e missions and environmental data as provided by Citigroup, Inc. , 388 Greenwich Street, New York, NY, 10013 in their GHG Statement in the form of a Management Assertion covering CO 2 equivalent emissions and environmental data . Statement of Independence and Competence The SGS Group of companies is the world leader in ins pection, testing and verification, operating in more than 140 countries and providing services including management systems and service certification; quality, environmental, social and ethical auditing; sustainability report assurance and greenhouse gases verification. SGS affirms our independence from Citigroup, Inc. being free from bias and conflicts of interest with the organization, its subsidiaries and stakeholders. The assurance team was assembled based on their knowledge, experience and qualifications for this assignment, and comprised Lead Verifiers in Greenhouse Gases and Environmental Data Reporting Roles and responsibilities The management of Citigroup, Inc. is respon sible for the organization’s GHG and environmental data inform ation system , the development and maintenance of records and reporting procedures in accordance with that system, including the calc ulation and determination and reporting of GHG emissions and environmental data . It is SGS’ responsibility to express an i ndependent GHG verification opinion on the GHG e missions and environmental data as provided in the Citigroup, Inc. GHG Statement for the period 1 st January 20 21 – 31 st December 2021. As independent auditors to Citigroup Inc. our work was conducted based on current best practice in independent verification and in accordance with SGS policies regarding impartiality and independence. SGS has no conflict of interest in relation to providing these services to Citigroup Inc. SGS conducted a third - party verification following the requirements of ISO 14064 - 3: 2019 of the provided CO 2 equivalent and environmental data Statement in the period December 2021 to April 2022 . The assessment included a desk review with remote verification . The verification was based on the verification scope, objectives and criteria as agreed between Citigroup, In c. and SGS on 1/ 12/2021 Level of Assurance The level of assurance agreed is limited . Scop e Citigroup, In c. has commissioned an independent verification by SGS of reported CO 2 equivalent emissions and environmental data arising from their activities, to establish conformance with the requirements of WRI/WBCSD GHG Protocol and its amendments for CO 2 equivalent emissions and the principles of completeness, transparency, accuracy, consistency and relevance for environmental data, within the scope of the verification as outlined below . Data and information supporting the CO 2 equivalent and environmental data statement were historical and estimated in nature and proven by evidence. Contents ESGatCiti SustainableFinance SustainableProgress Equitable&ResilientCommunities Talent&DEI RiskManagement&ResponsibleBusiness Appendices ESGS ataC ius niblnG 177
Assurance This engagement covers verification of emiss ions from anthropogenic sources of greenhouse gases and other environmental data included within the organi s ation’s boundary and meets the requirements of WRI/WBCSD GHG Protocol and its amendments . • The organizational boundary was established following the operational control approach • Title or description of activities: Banking and Finance • Location/boundary of the activities: Global • Physical infrastructure, activities, technologies and processes of the organization: Data Centres, Of fices, Operation Centres, Retail Services, and Retail non -serviced facilities . • GHG sources, sinks and/or reservoirs included: Scope 1: Direct GHG emissions and removals – stationary combustion in owned, leased and sub -leased locations . Transportation fleet, fugitive and refrigerant emissions are excluded from the inventory ; Category 2: Indirect GHG emissions from imported energy – purchased electricity and district heating and cooling ; Scope 3: Other i ndirect GHG emissions – Business T ravel (air and rail (rail travel is to trips which are booked through Citi’s primary Travel Management Company only)) . • Types of GHGs included: CO 2, N 2 O, CH 4 • GHG Reduction Initiatives : None . • GHG information for the following period was verified: 1 st January 2021 to 31 st December 2021 • Types of environmental data included: electricity consumption, district heating (steam & chilled water), natural gas consumption, fuel oil consumption, waste diverted from landfill, total waste and water (potable and non -potable) consumed • Intended user of the verification Opinion : Internal and external stakeholders . Objective The purpose of this verification exercise we re, by review of objective evidence, to independently review: • • Whether the CO 2 equivalent emissions and environmental data are as declared by the organi s ation’s statement • • That t he data reported are accurate, complete, consistent, transparent and free of material error or omissio n • • The implementation of Citigroup, Inc systems & procedures for the management and reporting of environmental data and the calculation of greenhouse gas emissions Criteria Criteria against which the verification assessment is undertaken are th e requirements of the WRI/WBCSD GHG Protocol (for CO2 equivalent emissions only) and its amendments, the GHG Inventory and environmental data methodology as defined by Citigroup, Inc., and the principles of completeness, transparency, accuracy, consistency and relevance . Contents ESGatCiti SustainableFinance SustainableProgress Equitable&ResilientCommunities Talent&DEI RiskManagement&ResponsibleBusiness Appendices ESGS ataC ius niblnG 178
Assurance Materiality The materiality required of the verification was considered by SGS to be below 10%, based on the needs of the intended user of the GHG and environmental data Statement Conclusion Citigroup, Inc. provided the GHG and environmental Statement based on the requirements of the WRI/WBCSD GHG Protocol and its amendments , the Citigroup, Inc. methodology and the principles of completeness, transparency, accuracy, consistency and relevance. The following GHG emissions and environmental data for the period 1 st January 2021 – 31 st December 2021 are verified by SGS to a limited leve l of assurance, consistent with the agreed verification scope, objectives and criteria. 44,683 tCO 2 e of GHG emissions Scope 1 463,311 tCO 2 e of GHG emissions Scope 2 (location based) 60,979 tCO 2 e of GHG emissions Scope 2 (market based) 507,994 tCO 2 e of total GHG emissions Scopes 1 and 2, based on Scope 2 location - based emissions 10,586 tCO 2 e of GHG emissions Scope 3 1,110.83 GWh of electricity consumption 26.35 GWh of district heating and cooling 178.00 GWh of natural gas 0.74 GWh of LPG 0.02 GWh of fue l oil 31.59 GWh of diesel 5,824 metric tonnes of waste diverted from landfill 25,595 metric tonnes of total waste 3,366,620 cubic meters of potable water consumed 253,010 cubic meters of non -potable water consumed 10,554 tCO 2 e from business travel by air 32 tCO 2 e from business travel by rail SGS’ approach is risk -based, drawing on an understanding of the risks associated with modeling GHG emission information and the controls in place to mitigate these risks. Our examination included assessment, on a sample basis, of evidence relevant to the voluntary reporting of emission and environmental data . SGS concludes with limited assurance that there is no evidence to suggest that the reported CO 2 equivalent and environmental data assertion is not materiall y correct and is not a fair representation of GHG and environmental data and information based on the calculation methodologies utilised . Contents ESGatCiti SustainableFinance SustainableProgress Equitable&ResilientCommunities Talent&DEI RiskManagement&ResponsibleBusiness Appendices ESGS ataC ius niblnG 179
Assurance We planned and performed our work to obtain the information, explanations and evidence that we considered necessary to provide a limited level of assurance that the CO 2 equivalent emissions and environmental data for the period 1 st January – 31 st December 2021 are fairly stated. This Opinion shall be interpreted with the CO 2 equivalent and environmental data statement of Citigroup, Inc. as a whole. Note: This Opinion is issued, on behalf of Client, by SGS United Kingdom Ltd, Ross more Business Park, Inward Way, Ellesmere Port, Cheshire, CH65 3EN (“SGS”) under its General Conditions for GHG Validation and Verification Services .The findings recorded hereon are based upon an audit performed by SGS. A full copy of this Opinion and the supporting GHG Statement may be consulted at Citigroup, Inc., 388 Greenwich Street , New York, NY 100 13. This Opinion does not relieve Client from compliance with any bylaws, federal, national or regional acts and regula tions or with any guidelines issued pursuant to such regulations. Stipulations to the contrary are not binding on SGS and SGS shall have no responsibility vis - à - vis parties other than its Client. Contents ESGatCiti SustainableFinance SustainableProgress Equitable&ResilientCommunities Talent&DEI RiskManagement&ResponsibleBusiness Appendices ESGS ataC ius niblnG 180
Assurance GP5024 Issue 4 SGS REPORT ON CITIGROUP INC.’s “CITI’S 2021 ESG REPORT ” , SECTION “ 2021 PROJECTS COVERED BY THE EQUATOR PRINCIPLES ” NATURE AND SCOPE OF THE ASSURANCE/VERIFICATION SGS was commissioned by Citigroup Inc. to conduct an independent assurance of the “Citi’s 2021 ESG Report ” , section “ 2021 Projects Covered by the Equator Principles” . The scope of the assurance, based on the SGS Sustainability Report Assurance methodology, included the data in accompanying tables, contained in this report. The information in the “Citi’s 2021 ESG Report ” of Citigroup Inc. and its presentation are the responsibility of the directors and the management of Citigroup Inc. SGS has not been involved in the preparation of any of the material included in the “Citi’s 2021 ESG Report ” . Our responsibi lity is to express an opinion on the text, data, graphs and statements within the scope of verification with the intention to inform all Citigroup Inc. ’ stakeholders. The SGS protocols are based upon the internationally recognized Assurance S tandard ISAE 3000. This standard follows differing options for Assurance depending on the context and capabilities of the Reporting Organization. This report has been assured at a limited level of scrutiny using our protocol s for evaluat ion of content veracity and the alignment to the Equator Principles and the internal policies and procedures of Citigroup Inc . The assurance comprised a combination of pre -assurance research, interviews with relevant employees; documentation and record review and the evaluation of the report for the alignment to the Equator Principles . STATEMENT OF INDEPENDENCE AND COMPETENCE The SGS Group of companies is the world leader in inspection, testing and verification, operating in more than 140 countries and providing services including management systems and service certification; quality, environmental, social and ethical auditing; sustainability report assurance and greenhouse gases verification . SGS affirms our independence from Citigroup Inc. , being free from bias and conflicts of interest with the organization , its subsidiaries and stakeholders. The assurance team was assembled based on their knowledge, experience and qualifications for this assignment, and comprised a Lead Assuror f or Sustainability Reporting and Equator Principles , Lead Verifier in Greenhouse Gases, and Principal Auditor registered with IRCA (International Register of Certificated Auditors) in Environmental, Quality, Occupational Health & Safety, and Social Systems . ASSURANCE OPINION Based on the methodology described and the verification work performed on the “Citi’s 2021 ESG Report”, section “ 2021 Projects Covered by the Equator Principles” , we did not observe any circumstance that made us believe that the information and data contained within i s inaccurate, un reliable, or does not provide a fair and balanced representation of Citigroup Inc. ’ activities in 2021 . The assurance team is of the opinion that the Report can be used by the Citigroup Inc. ’ Stakeholders. We believe that Citigroup Inc. has chosen an appropriate level of assurance. ASSURANCE STATEMENT Contents ESGatCiti SustainableFinance SustainableProgress Equitable&ResilientCommunities Talent&DEI RiskManagement&ResponsibleBusiness Appendices ESGS ataC ius niblnG 181
Assurance GP5024 Issue 2 CONCLU SIONS WITH REGARDS TO EQUATOR PRINCIPLES REPORTING DATA FOR 2021 In our opinion the “Citi’s 2021 ESG Report ” reported information of the Equator Principles , as detailed at the section “ 2021 Projects Covered by Equator Principles” and is pr esented in accordance with the Equator Principles I V (EP4) , Annex B “Minimum Reporting Requirement s ” . SGS based this opinion in the review of Citi’s internal documents and a sample of EP-covered financial products and their respective EP checklists and Independent Reviews. Citigroup Inc. reported information is aligned to the EP Reporting Criteria requirements as follows : • Public Reporting of the EP-covered financial products separately : Project Finance Advisory Services, Project Finance Loans, Project-Related Corporate Loans , Bridge Loans and Project-Related Refinance and Project -Related Acquisition Finance . There were only Project Finance Loans and PRCL in 2021 . • The loans were categorized as A, B or C, dependent on the environmental and social risks posed. • Total number of Project Finance Loans and Project- Related Corporate Loans that reached Financial Close d uring the reporting period ( 2021 ) • T he Project Finance Loans and Project- Related Corporate Loans were broken down by: Sector, Region, Country Designation, and whether an whether an Independent Review has been carried out. • Independent review is required for A projects and , for B projects when ne eded. Both Project Finance transactions were category B, and both had an Independent Review. • The EP transactions were over the threshold of : o 10 million USD for Project Capital Cost required in the Equator Principles IV for project finance loans, and o Over 50 million USD for Project -Related Corporate Loans (total aggregate loan amount and the EPFI’s individual commitment) in the Equator Principles I V • It was identified the transactions which their combined Scope 1 and Scope 2 Emissions are expected to be more than 100,000 tonnes of CO 2 equivalent annually. In these cases, an annual GHG emissions report and a climate change risk assessment is requested for the transaction . Lead Assessor : U rsula Antun ez Pamela Chadw ick Bu siness Manager SGS UK Ltd Lead Sustainability Report Assuror : Ursula Antunez de Mayolo Corzo Date: 21 st March of 2022 www.sgs.com Contents ESGatCiti SustainableFinance SustainableProgress Equitable&ResilientCommunities Talent&DEI RiskManagement&ResponsibleBusiness Appendices ESGS ataC ius niblnG 182
Forward-Looking Statements The disclosures included in this report are being provided to the public in an effort to provide transparency into our environmental, social and governance (ESG) initiatives to respond to stakeholder requests, and to further enhance our collective understanding of ESG issues. Our approaches to the disclosures included in this report are different from those included in mandatory regulatory reporting, including under SEC regulations. Certain statements in this report may contain “forward-looking statements.” These statements speak only as of the date they are originally made and are based on management’s current expectations and are subject to known and unknown risks, uncertainties, changes in circumstances, and assumptions that are difficult to predict and are often beyond our control. These statements are not guarantees of future results, occurrences, or performance. Actual results and financial outcomes may differ materially from those expressed in or implied by any of these forward-looking statements due to a variety of factors, including, among others, global socio-demographic and economic trends, climate-related conditions and weather events, legislative and regulatory changes, and other unforeseen events or conditions. You should not place undue reliance on any forward-looking statement. Factors that could cause actual results to differ materially from those described in forward-looking statements can be found in this report, in Citi’s filings with the SEC, including, without limitation, the “Risk Factors” section of Citi’s 2021 Annual Report on Form 10-K and disclosures available on our corporate website. Citi does not undertake to update forward-looking statements to reflect the impact of circumstances or events that arise after the date the forward-looking statements were made. This report contains statements based on hypothetical or severely adverse scenarios and assumptions, and these statements should not necessarily be viewed as being representative of current or actual risk or forecasts of expected risk. While future events discussed in this report may be significant, any significance should not be read as necessarily rising to the level of materiality of the disclosures required under U.S. federal securities laws. © 2022 Citigro up Inc. Citi, Citi with Arc Design and Citibank are trademarks and servicemarks of Citigroup Inc. (and its affiliates) and are used and registered throughout the world. Contents ESGatCiti SustainableFinance SustainableProgress Equitable&ResilientCommunities Talent&DEI RiskManagement&ResponsibleBusiness Appendices CITI 2021 ESG REPORT 183