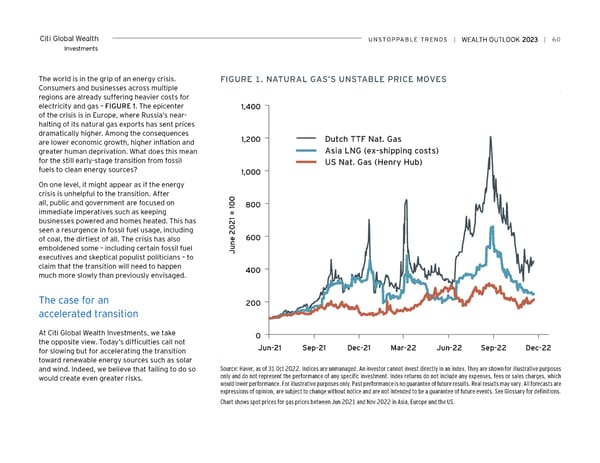
Citi Global Wealth UNSToPPABLe TreNDS | | 60 Investments The world is in the grip of an energy crisis. FiGUre 1. NATUrAL GAS’S UNSTABLe PriCe MoveS Consumers and businesses across multiple regions are already suffering heavier costs for electricity and gas – FIGURE 1. The epicenter 1,400 of the crisis is in Europe, where Russia’s near- halting of its natural gas exports has sent prices dramatically higher. Among the consequences Dutch TTF Nat. Gas are lower economic growth, higher inflation and 1,200 greater human deprivation. What does this mean Asia LNG (ex-shipping costs) for the still early-stage transition from fossil US Nat. Gas (Henry Hub) fuels to clean energy sources? 1,000 On one level, it might appear as if the energy crisis is unhelpful to the transition. After 0 all, public and government are focused on 0 800 1 immediate imperatives such as keeping = businesses powered and homes heated. This has 1 2 seen a resurgence in fossil fuel usage, including 0 2 600 of coal, the dirtiest of all. The crisis has also e n emboldened some – including certain fossil fuel u J executives and skeptical populist politicians – to claim that the transition will need to happen 400 much more slowly than previously envisaged. The case for an 200 accelerated transition At Citi Global Wealth Investments, we take 0 the opposite view. Today’s difficulties call not Jun-21 Sep-21 Dec-21 Mar-22 Jun-22 Sep-22 Dec-22 for slowing but for accelerating the transition toward renewable energy sources such as solar and wind. Indeed, we believe that failing to do so Source: Haver, as of 31 Oct 2022. Indices are unmanaged. An investor cannot invest directly in an index. They are shown for illustrative purposes would create even greater risks. only and do not represent the performance of any specific investment. Index returns do not include any expenses, fees or sales charges, which would lower performance. For illustrative purposes only. Past performance is no guarantee of future results. Real results may vary. All forecasts are expressions of opinion, are subject to change without notice and are not intended to be a guarantee of future events. See Glossary for definitions. Chart shows spot prices for gas prices between Jun 2021 and Nov 2022 in Asia, Europe and the US.
 Citi Wealth Outlook 2023 Page 59 Page 61