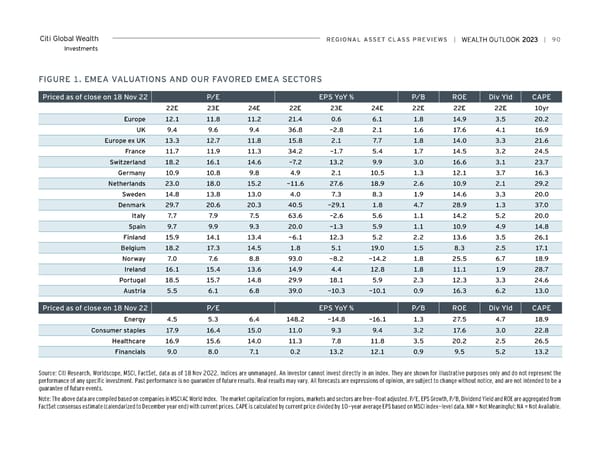
Citi Global Wealth reGioNAL ASSeT CLASS PreviewS | | 90 Investments FiGUre 1. eMeA vALUATioNS AND oUr FAvoreD eMeA SeCTorS Priced as of close on 18 Nov 22 P/e ePS YoY % P/B roe Div Yld CAPe 22e 23e 24e 22e 23e 24e 22e 22e 22e 10yr europe 12.1 11.8 11.2 21.4 0.6 6.1 1.8 14.9 3.5 20.2 UK 9.4 9.6 9.4 36.8 -2.8 2.1 1.6 17.6 4.1 16.9 europe ex UK 13.3 12.7 11.8 15.8 2.1 7.7 1.8 14.0 3.3 21.6 France 11.7 11.9 11.3 34.2 -1.7 5.4 1.7 14.5 3.2 24.5 Switzerland 18.2 16.1 14.6 -7.2 13.2 9.9 3.0 16.6 3.1 23.7 Germany 10.9 10.8 9.8 4.9 2.1 10.5 1.3 12.1 3.7 16.3 Netherlands 23.0 18.0 15.2 -11.6 27.6 18.9 2.6 10.9 2.1 29.2 Sweden 14.8 13.8 13.0 4.0 7.3 8.3 1.9 14.6 3.3 20.0 Denmark 29.7 20.6 20.3 40.5 -29.1 1.8 4.7 28.9 1.3 37.0 italy 7.7 7.9 7.5 63.6 -2.6 5.6 1.1 14.2 5.2 20.0 Spain 9.7 9.9 9.3 20.0 -1.3 5.9 1.1 10.9 4.9 14.8 Finland 15.9 14.1 13.4 -6.1 12.3 5.2 2.2 13.6 3.5 26.1 Belgium 18.2 17.3 14.5 1.8 5.1 19.0 1.5 8.3 2.5 17.1 Norway 7.0 7.6 8.8 93.0 -8.2 -14.2 1.8 25.5 6.7 18.9 ireland 16.1 15.4 13.6 14.9 4.4 12.8 1.8 11.1 1.9 28.7 Portugal 18.5 15.7 14.8 29.9 18.1 5.9 2.3 12.3 3.3 24.6 Austria 5.5 6.1 6.8 39.0 -10.3 -10.1 0.9 16.3 6.2 13.0 Priced as of close on 18 Nov 22 P/e ePS YoY % P/B roe Div Yld CAPe energy 4.5 5.3 6.4 148.2 -14.8 -16.1 1.3 27.5 4.7 18.9 Consumer staples 17.9 16.4 15.0 11.0 9.3 9.4 3.2 17.6 3.0 22.8 Healthcare 16.9 15.6 14.0 11.3 7.8 11.8 3.5 20.2 2.5 26.5 Financials 9.0 8.0 7.1 0.2 13.2 12.1 0.9 9.5 5.2 13.2 Source: Citi Research, Worldscope, MSCI, FactSet, data as of 18 Nov 2022. Indices are unmanaged. An investor cannot invest directly in an index. They are shown for illustrative purposes only and do not represent the performance of any specific investment. Past performance is no guarantee of future results. Real results may vary. All forecasts are expressions of opinion, are subject to change without notice, and are not intended to be a guarantee of future events. Note: The above data are compiled based on companies in MSCI AC World Index. The market capitalization for regions, markets and sectors are free-float adjusted. P/E, EPS Growth, P/B, Dividend Yield and ROE are aggregated from FactSet consensus estimate (calendarized to December year end) with current prices. CAPE is calculated by current price divided by 10-year average EPS based on MSCI index-level data. NM = Not Meaningful; NA = Not Available.
 Citi Wealth Outlook 2023 Page 89 Page 91