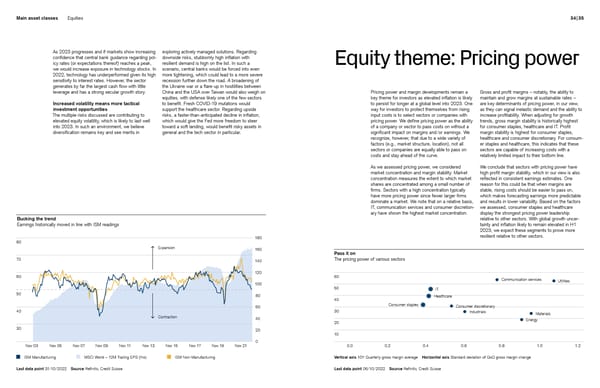
Main asset classes Equities 34 | 35 As 2023 progresses and if markets show increasing exploring actively managed solutions. Regarding confidence that central bank guidance regarding pol- downside risks, stubbornly high inflation with icy rates (or expectations thereof) reaches a peak, resilient demand is high on the list. In such a Equity theme: Pricing power we would increase exposure in technology stocks. In scenario, central banks would be forced into even 2022, technology has underperformed given its high more tightening, which could lead to a more severe sensitivity to interest rates. However, the sector recession further down the road. A broadening of generates by far the largest cash flow with little the Ukraine war or a flare-up in hostilities between leverage and has a strong secular growth story. China and the USA over Taiwan would also weigh on Pricing power and margin developments remain a Gross and profit margins – notably, the ability to equities, with defense likely one of the few sectors key theme for investors as elevated inflation is likely maintain and grow margins at sustainable rates – Increased volatility means more tactical to benefit. Fresh COVID-19 mutations would to persist for longer at a global level into 2023. One are key determinants of pricing power, in our view, investment opportunities support the healthcare sector. Regarding upside way for investors to protect themselves from rising as they can signal inelastic demand and the ability to The multiple risks discussed are contributing to risks, a faster-than-anticipated decline in inflation, input costs is to select sectors or companies with increase profitability. When adjusting for growth elevated equity volatility, which is likely to last well which would give the Fed more freedom to steer pricing power. We define pricing power as the ability trends, gross margin stability is historically highest into 2023. In such an environment, we believe toward a soft landing, would benefit risky assets in of a company or sector to pass costs on without a for consumer staples, healthcare and IT. Profit diversification remains key and see merits in general and the tech sector in particular. significant impact on margins and/or earnings. We margin stability is highest for consumer staples, recognize, however, that due to a wide variety of healthcare and consumer discretionary. For consum- factors (e.g., market structure, location), not all er staples and healthcare, this indicates that these sectors or companies are equally able to pass on sectors are capable of increasing costs with a costs and stay ahead of the curve. relatively limited impact to their bottom line. As we assessed pricing power, we considered We conclude that sectors with pricing power have market concentration and margin stability. Market high profit margin stability, which in our view is also concentration measures the extent to which market reflected in consistent earnings estimates. One shares are concentrated among a small number of reason for this could be that when margins are firms. Sectors with a high concentration typically stable, rising costs should be easier to pass on, have more pricing power since fewer larger firms which makes forecasting earnings more predictable dominate a market. We note that on a relative basis, and results in lower variability. Based on the factors IT, communication services and consumer discretion- we assessed, consumer staples and healthcare ary have shown the highest market concentration. display the strongest pricing power leadership Bucking the trend relative to other sectors. With global growth uncer- Earnings historically moved in line with ISM readings tainty and inflation likely to remain elevated in H1 2023, we expect these segments to prove more 180 180 resilient relative to other sectors. 80 160 Expansion 160 Pass it on 70 140 The pricing power of various sectors 140 120 120 60 60 Communication services 100 100 Utilities 50 IT 50 80 Healthcare 80 40 60 60 Consumer staples Consumer discretionary 40 30 Industrials Materials 40 Contraction 40 Energy 20 30 20 20 10 0 0 Nov 03 Nov 05 Nov 07 Nov 09 Nov 11 Nov 13 Nov 15 Nov 17 Nov 19 Nov 21 0.0 0.2 0.4 0.6 0.8 1.0 1.2 ISM Manufacturing MSCI World – 12M Trailing EPS (rhs) ISM Non-Manufacturing Vertical axis 10Y Quarterly gross margin average Horizontal axis Standard deviation of QoQ gross margin change Last data point 31/10/2022 Source Refinitiv, Credit Suisse Last data point 06/10/2022 Source Refinitiv, Credit Suisse
 Credit Suisse Investment Outlook 2023 Page 17 Page 19