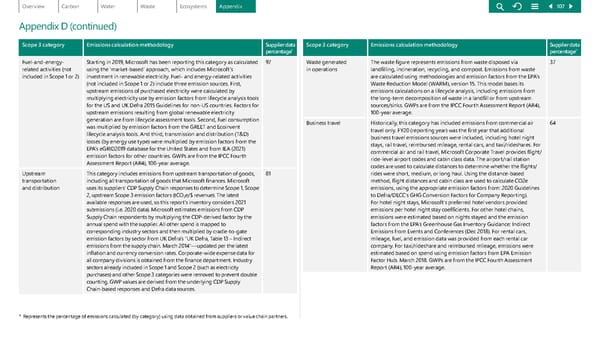
Scope 3 category Emissions calculation methodology Appendix D (continued) Scope 3 category Emissions calculation methodology Supplier data percentage * Fuel-and-energy - related activities (not included in Scope 1 or 2) Starting in 2019, Microsoft has been reporting this category as calculated using the 'market-based' approach, which includes Microsoft’s investment in renewable electricity. Fuel- and energy-related activities (not included in Scope 1 or 2) include three emission sources. First, upstream emissions of purchased electricity were calculated by multiplying electricity use by emission factors from lifecycle analysis tools for the US and UK Defra 2015 Guidelines for non-US countries. Factors for upstream emissions resulting from global renewable electricity generation are from lifecycle assessment tools. Second, fuel consumption was multiplied by emission factors from the GREET and Ecoinvent lifecycle analysis tools. And third, transmission and distribution (T&D) losses (by energy use type) were multiplied by emission factors from the EPA’s eGRID2019 database for the United States and from IEA (2021) emission factors for other countries. GWPs are from the IPCC Fourth Assessment Report (AR4), 100-year average. 97 Upstream transportation and distribution This category includes emissions from upstream transportation of goods, including all transportation of goods that Microsoft finances. Microsoft uses its suppliers' CDP Supply Chain responses to determine Scope 1, Scope 2, upstream Scope 3 emission factors (tCO 2 e/$ revenue). The latest available responses are used, so this report’s inventory considers 2021 submissions (i.e. 2020 data). Microsoft estimates emissions from CDP Supply Chain respondents by multiplying the CDP-derived factor by the annual spend with the supplier. All other spend is mapped to corresponding industry sectors and then multiplied by cradle-to-gate emission factors by sector from UK Defra’s "UK Defra, Table 13 – Indirect emissions from the supply chain. March 2014"—updated per the latest inflation and currency conversion rates. Corporate-wide expense data for all company divisions is obtained from the finance department. Industry sectors already included in Scope 1 and Scope 2 (such as electricity purchases) and other Scope 3 categories were removed to prevent double counting. GWP values are derived from the underlying CDP Supply Chain-based responses and Defra data sources. 81 Waste generated in operations The waste figure represents emissions from waste disposed via landfi lling, incineration, recycling, and compost. Emissions from waste are calculated using methodologies and emission factors from the EPA’s Waste Reduction Model (WARM), version 15. This model bases its emissions calculations on a lifecycle analysis, including emissions from the long-term decomposition of waste in a landfill or from upstream sources/sinks. GWPs are from the IPCC Fourth Assessment Report (AR4), 100-year average. 37 Business travel Historically, this category has included emissions from commercial air trav el only. FY20 (reporting year) was the first year that additional business travel emissions sources were included, including hotel night stays, rail travel, reimbursed mileage, rental cars, and taxi/rideshares. For commercial air and rail travel, Microsoft Corporate Travel provides flight/ ride-level airport codes and cabin class data. The airport/rail station codes are used to calculate distances to determine whether the flights/ rides were short, medium, or long haul. Using the distance-based method, flight distances and cabin class are used to calculate CO2e emissions, using the appropriate emission factors from: 2020 Guidelines to Defra/DECC's GHG Conversion Factors for Company Reporting). For hotel night stays, Microsoft's preferred hotel vendors provided emissions per hotel night stay coefficients. For other hotel chains, emissions were estimated based on nights stayed and the emission factors from the EPA's Greenhouse Gas Inventory Guidance: Indirect Emissions from Events and Conferences (Dec 2018). For rental cars, mileage, fuel, and emission data was provided from each rental car company. For taxi/rideshare and reimbursed mileage, emissions were estimated based on spend using emission factors from EPA Emission Factor Hub. March 2018. GWPs are from the IPCC Fourth Assessment Report (AR4), 100-year average. 64 * Represents the percentage of emissions calculated (by category) using data obtained from suppliers or value chain partners. Supplier data percentage * 107
 Environmental Sustainability Report | Microsoft Page 106 Page 108