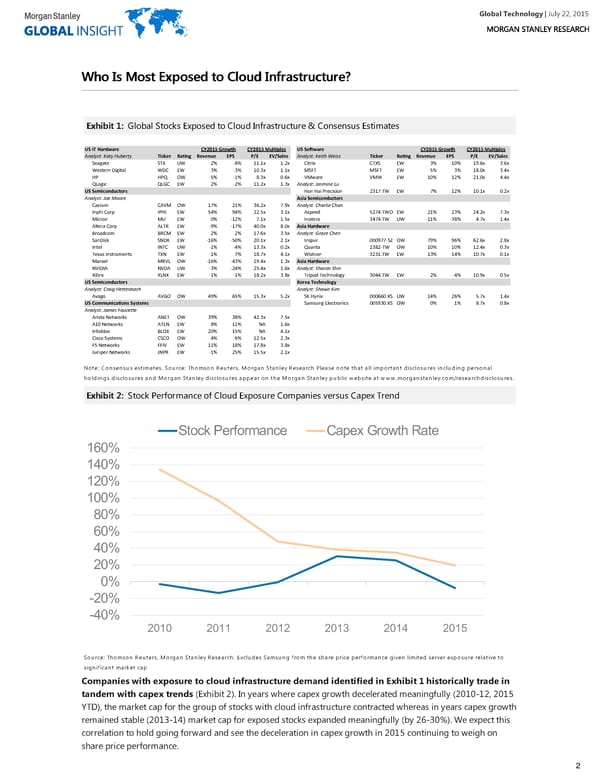
Global Technology| July 22, 2015 WWhhoo IIss MMoosstt EExxppoosseedd ttoo CClloouudd IInnffrraassttrruuccttuurree?? EExxhhiibbiitt 11:: Global Stocks Exposed to Cloud Infrastructure & Consensus Estimates US IT Hardware CY2015 Growth CY2015 Multiples US Software CY2015 Growth CY2015 Multiples Analyst: Katy Huberty Ticker Rating Revenue EPS P/E EV/Sales Analyst: Keith Weiss Ticker Rating Revenue EPS P/E EV/Sales Seagate STX UW -2% -8% 11.1x 1.2x Citrix CTXS EW 3% 10% 19.6x 3.6x Western Digital WDC EW -3% -3% 10.3x 1.1x MSFT MSFT EW 5% 3% 18.0x 3.4x HP HPQ OW -5% -1% 8.3x 0.6x VMware VMW EW 10% 12% 21.0x 4.4x QLogic QLGC EW 2% -2% 11.2x 1.3x Analyst: Jasmine Lu US Semiconductors Hon Hai Precision 2317.TW EW 7% 12% 10.1x 0.2x Analyst: Joe Moore Asia Semiconductors Cavium CAVM OW 17% 21% 36.2x 7.9x Analyst: Charlie Chan Inphi Corp IPHI EW 54% 94% 22.5x 3.1x Aspeed 5274.TWO EW 21% 23% 24.2x 7.3x Micron MU EW 0% -12% 7.1x 1.5x Inotera 3474.TW UW -11% -38% 4.7x 1.4x Altera Corp ALTR EW -9% -17% 40.0x 8.0x Asia Hardware Broadcom BRCM EW 2% 2% 17.6x 3.5x Analyst: Grace Chen SanDisk SNDK EW -16% -50% 20.1x 2.1x Inspur 000977-SZ OW 79% 96% 62.6x 2.8x Intel INTC UW -1% -4% 13.3x 0.2x Quanta 2382-TW OW 10% 10% 12.4x 0.3x Texas Instruments TXN EW 1% 7% 18.7x 4.1x Wistron 3231.TW EW 13% 14% 10.7x 0.1x Marvel MRVL OW -16% -43% 19.4x 1.3x Asia Hardware NVIDIA NVDA UW -3% -24% 25.4x 1.6x Analyst: Sharon Shin Xilinx XLNX EW -1% -1% 18.2x 3.8x Tripod Technology 3044.TW EW 2% -4% 10.9x 0.5x US Semiconductors Korea Technology Analyst: Craig Hettenbach Analyst: Shawn Kim Avago AVGO OW 49% 65% 15.3x 5.2x SK Hynix 000660.KS UW 14% 26% 5.7x 1.4x US Communications Systems Samsung Electronics 005930.KS OW 0% 1% 8.7x 0.8x Analyst: James Faucette Arista Networks ANET OW 39% 38% 42.3x 7.5x A10 Networks ATEN EW 8% 11% NA 1.6x Infoblox BLOX EW 20% 15% NA 4.1x Cisco Systems CSCO OW 4% 6% 12.5x 2.3x F5 Networks FFIV EW 11% 18% 17.8x 3.8x Juniper Networks JNPR EW -1% 25% 15.5x 2.1x Note: Consensus estimates. Source: Thomson Reuters, Morgan Stanley Research Please note that all important disclosures including personal holdings disclosures and Morgan Stanley disclosures appear on the Morgan Stanley public website at www.morganstanley.com/researchdisclosures. EExxhhiibbiitt 22:: Stock Performance of Cloud Exposure Companies versus Capex Trend Stock Performance Capex Growth Rate 160% 140% 120% 100% 80% 60% 40% 20% 0% -20% -40% 2010 2011 2012 2013 2014 2015 Source: Thomson Reuters, Morgan Stanley Research. Excludes Samsung from the share price performance given limited server exposure relative to significant market cap Companies with exposure to cloud infrastructure demand identified in Exhibit 1 historically trade in tandem with capex trends (Exhibit 2). In years where capex growth decelerated meaningfully (2010-12, 2015 YTD), the market cap for the group of stocks with cloud infrastructure contracted whereas in years capex growth remained stable (2013-14) market cap for exposed stocks expanded meaningfully (by 26-30%). We expect this correlation to hold going forward and see the deceleration in capex growth in 2015 continuing to weigh on share price performance. 2
 Global Technology Page 1 Page 3