Let's understand how to view analytics. RELAYTO analytics provides detailed insights into user engagement and behavior, allowing for data-driven content optimization and strategic decision-making. This enhances content effectiveness, personalization, and overall performance measurement, leading to improved user experience and higher ROI.
Opening Analytics Mode
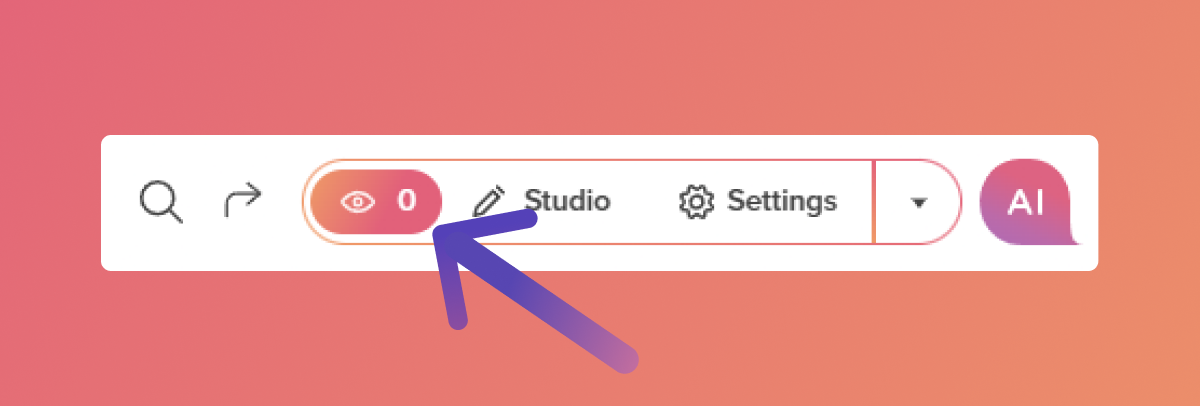
First, there are two ways you can enter analytics.
Click on the "eye" icon in the top right corner.
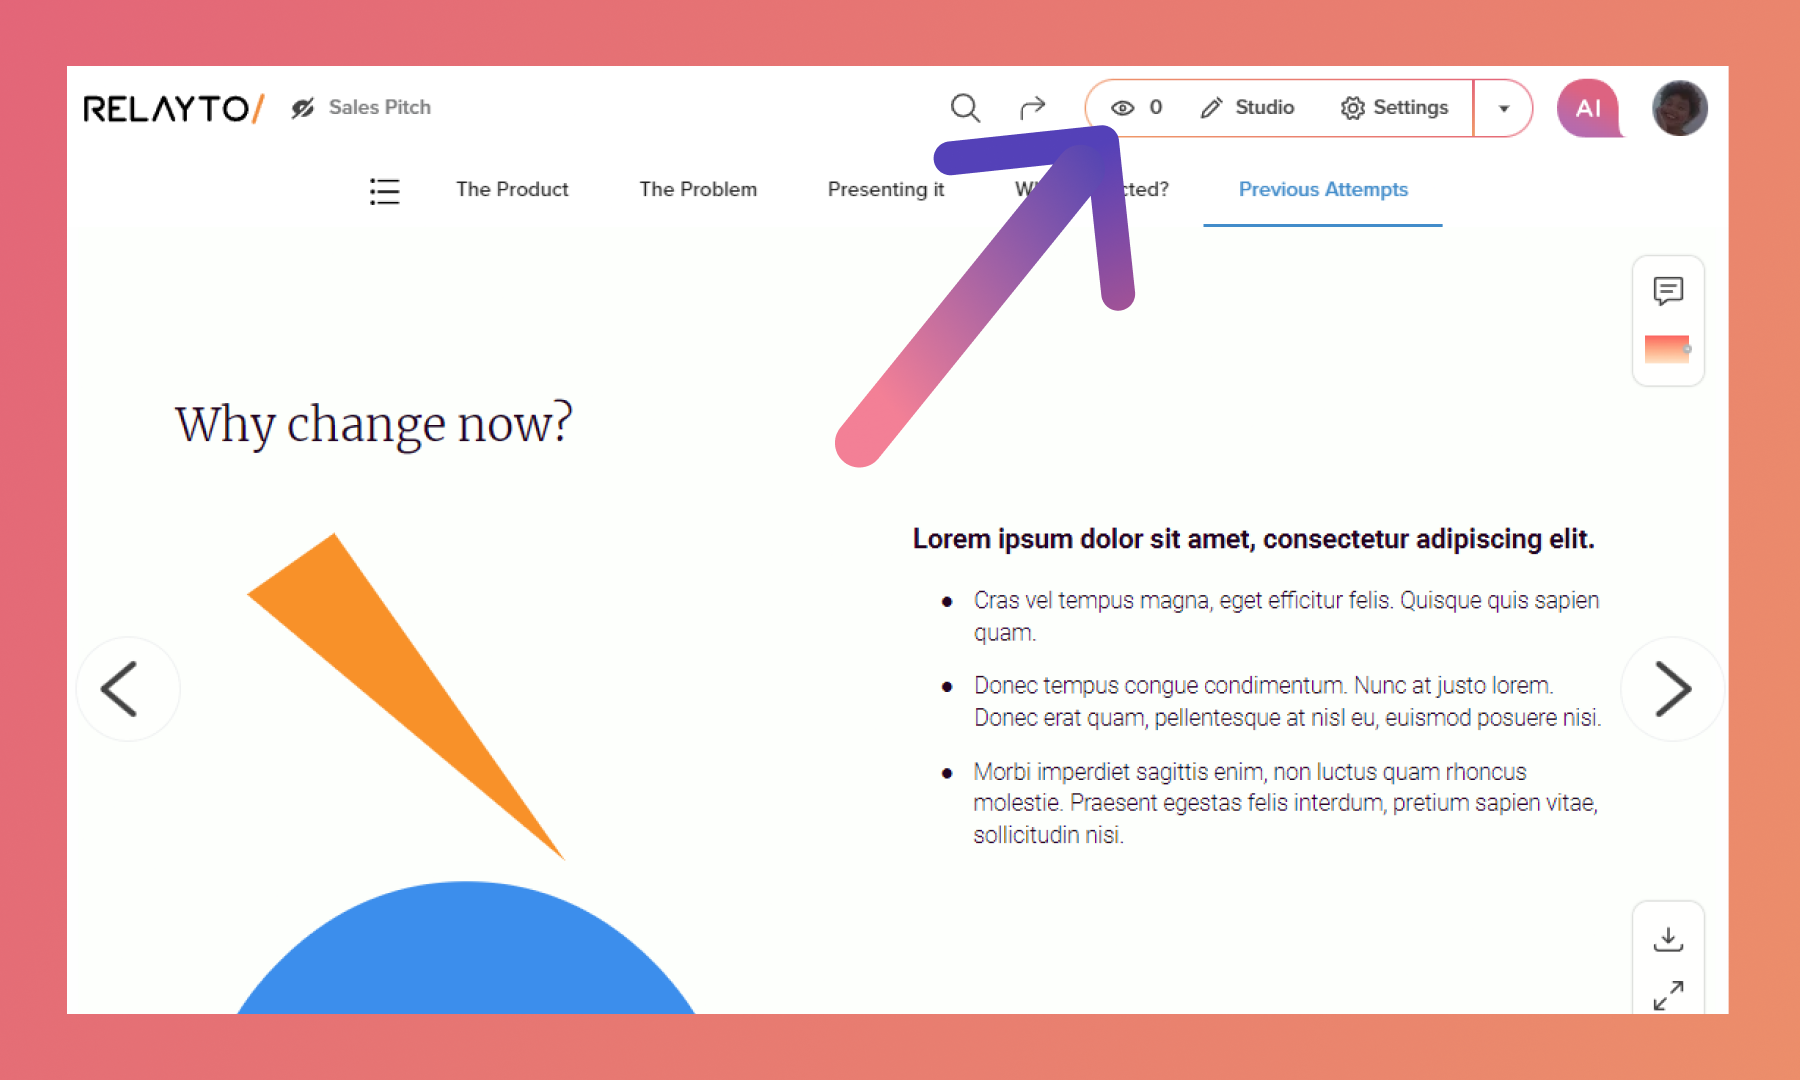
Click on the drop-down menu and then select "Analytics".
.png)
Explaining Analytics Tabs
Overview
The Overview page will display the primary analytics data for your experience. You can see views, clicks, average time spent, and total time per asset.
.png)
By Page
RELAYTO tracks not just page views, but every interactive element on the page: videos, forms, embedded documents, and more (any content that is layered over the page). Use filters to segment the data and download reports to analyze performance and improve follow-up.
.png)
By Day
View day-by-day metrics including number of views, unique visitors, and interaction trends to spot engagement patterns over time.
.png)
Locations
It reveals the geographical origins of your document's visitors. You can view it by country, city, or language.
.png)
Devices
It provides insights into the devices viewers use to access your digital experience, along with the number of visits for each device type.
.png)
Referrers
Gain insights into how visitors discover your digital experience, including the number of visits and visitors from each referral source.
.png)
People
You can find an overview of added users, with the option to click on an individual user to access detailed information about their activity.
.png)
Downloading Data
To download the data in .csv format, click the "download" icon.
.png)
Filtering Data
Select the period you want to view to filter by date.
.png)
Leaving Analytics Mode
To return to your experience, click the "eye" icon in the top right corner to close analytics.
Related Articles:
How to upload your content to RELAYTO
Thank you for joining us in this tutorial! If you have any questions or need help, feel free to email us at support@relayto.com or book a call here.