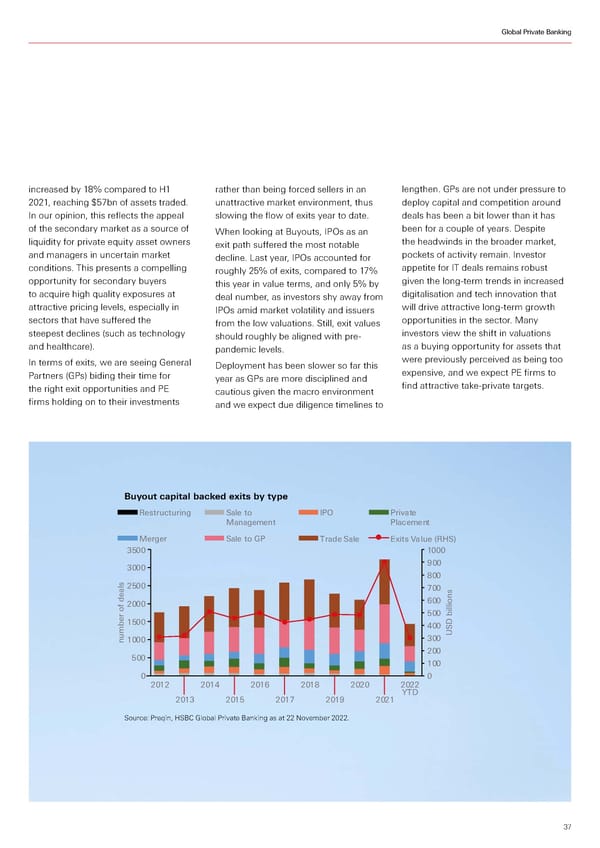
Global Private Banking increased by 18% compared to H1 rather than being forced sellers in an lengthen. GPs are not under pressure to 2021, reaching $57bn of assets traded. unattractive market environment, thus deploy capital and competition around In our opinion, this reflects the appeal slowing the flow of exits year to date. deals has been a bit lower than it has of the secondary market as a source of When looking at Buyouts, IPOs as an been for a couple of years. Despite liquidity for private equity asset owners exit path suffered the most notable the headwinds in the broader market, and managers in uncertain market decline. Last year, IPOs accounted for pockets of activity remain. Investor conditions. This presents a compelling roughly 25% of exits, compared to 17% appetite for IT deals remains robust opportunity for secondary buyers this year in value terms, and only 5% by given the long-term trends in increased to acquire high quality exposures at deal number, as investors shy away from digitalisation and tech innovation that attractive pricing levels, especially in IPOs amid market volatility and issuers will drive attractive long-term growth sectors that have suffered the from the low valuations. Still, exit values opportunities in the sector. Many steepest declines (such as technology should roughly be aligned with pre- investors view the shift in valuations and healthcare). pandemic levels. as a buying opportunity for assets that In terms of exits, we are seeing General Deployment has been slower so far this were previously perceived as being too Partners (GPs) biding their time for year as GPs are more disciplined and expensive, and we expect PE firms to the right exit opportunities and PE cautious given the macro environment find attractive take-private targets. firms holding on to their investments and we expect due diligence timelines to Buyout capital backed exits by type Restruturin Sale to ri ate anaement laement erer Sale to Trade Sale €‚its ƒalue „R…S† 3500 1000 3000 900 800 2500 700 2000 600 500 1500 400 number of deals1000 300 USD billions 500 200 100 0 0 2012 2014 2016 2018 2020 2022 2013 2015 2017 2019 2021 YTD Source: Preqin, HSBC Global Private Banking as at 22 November 2022. 37
 HSBC Investment Outlook Q1 2023 Page 36 Page 38