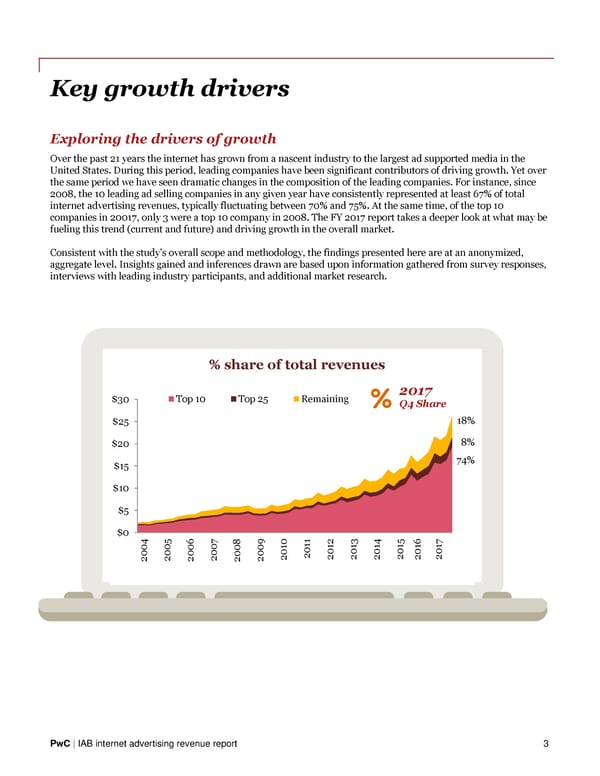
Key growth drivers Exploring the drivers of growth Over the past 21 years the internet has grown from a nascent industry to the largest ad supported media in the United States. During this period, leading companies have been significant contributors of driving growth. Yet over the same period we have seen dramatic changes in the composition of the leading companies. For instance, since 2008, the 10 leading ad selling companies in any given year have consistently represented at least 67% of total internet advertising revenues, typically fluctuating between 70% and 75%. At the same time, of the top 10 companies in 20017, only 3 were a top 10 company in 2008. The FY 2017 report takes a deeper look at what may be fueling this trend (current and future) and driving growth in the overall market. Consistent with the study’s overall scope and methodology, the findings presented here are at an anonymized, aggregate level. Insights gained and inferences drawn are based upon information gathered from survey responses, interviews with leading industry participants, and additional market research. % share of total revenues $30 Top 10 Top 25 Remaining 2017 Q4 Share $25 18% $20 8% $15 74% $10 $5 $0 4 11 0 05 06 07 08 09 10 12 13 14 1516 17 20 20 20 20 20 20 20 20 20 20 2020 20 1720 20 PwC | IAB internet advertising revenue report 3
 IAB Internet Advertising Revenue Report Page 4 Page 6