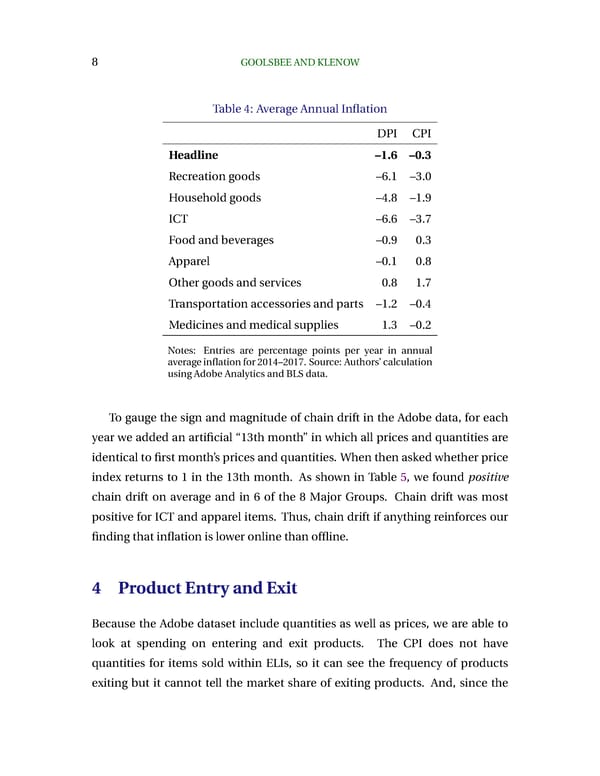
8 GOOLSBEEANDKLENOW Table4: AverageAnnualInflation DPI CPI Headline –1.6 –0.3 Recreationgoods –6.1 –3.0 Householdgoods –4.8 –1.9 ICT –6.6 –3.7 Foodandbeverages –0.9 0.3 Apparel –0.1 0.8 Othergoodsandservices 0.8 1.7 Transportationaccessoriesandparts –1.2 –0.4 Medicinesandmedicalsupplies 1.3 –0.2 Notes: Entries are percentage points per year in annual averageinflationfor2014–2017. Source: Authors’calculation usingAdobeAnalyticsandBLSdata. To gauge the sign and magnitude of chain drift in the Adobe data, for each year we added an artificial “13th month” in which all prices and quantities are identical to first month’s prices and quantities. When then asked whether price index returns to 1 in the 13th month. As shown in Table 5, we found positive chain drift on average and in 6 of the 8 Major Groups. Chain drift was most positive for ICT and apparel items. Thus, chain drift if anything reinforces our findingthatinflationisloweronlinethanoffline. 4 ProductEntryandExit Because the Adobe dataset include quantities as well as prices, we are able to look at spending on entering and exit products. The CPI does not have quantities for items sold within ELIs, so it can see the frequency of products exiting but it cannot tell the market share of exiting products. And, since the
 Internet Rising, Prices Falling Page 7 Page 9