JPMorgan Chase & Co ESG Report
2021 ENVIRONMENTAL SOCIAL & GOVERNANCE REPORT
Environmental 11 Advancing Climate and Sustainability Solutions 12 Operational Sustainability 17 Contents Introduction 1 Message from Our Chairman & CEO 2 Company at a Glance 3 Our Approach to ESG 5 Feature: Our $2.5 Trillion Sustainable Development Target 6 ESG Report Appendices 60 List of Acronyms 61 Resources 62 Global Reporting Initiative Index 63 Sustainability Accounting Standards Board Index 70 JPMorgan Chase Sustainable Bond Annual Report 7 3 Social 20 Feature: Our Commitment to Racial Equity 21 Diversity, Equity & Inclusion 25 Human Capital 30 Inclusive Growth 36 Governance 49 Corporate Governance and ESG Oversight 50 Stakeholder Engagement 52 Risk Management 54 Data Privacy and Cybersecurity 55 Business Ethics 57 Political Engagement and Public Policy 59

Introduction 1

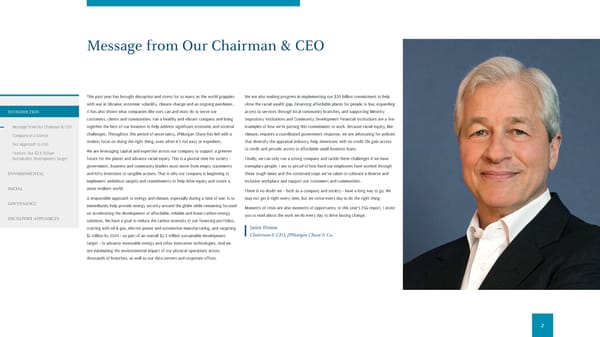
Message from Our Chairman & CEO This past year has brought disruption and stress for so many as the world grapples with war in Ukraine, economic volatility, climate change and an ongoing pandemic. It has also shown what companies like ours can and must do to serve our customers, clients and communities: run a healthy and vibrant company and bring together the best of our business to help address significant economic and societal challenges. Throughout this period of uncertainty, JPMorgan Chase has led with a tireless focus on doing the right thing, even when it’s not easy or expedient. We are leveraging capital and expertise across our company to support a greener future for the planet and advance racial equity. This is a pivotal time for society – government, business and community leaders must move from empty statements and lofty intentions to tangible actions. That is why our company is beginning to implement ambitious targets and commitments to help drive equity and create a more resilient world. A responsible approach to energy and climate, especially during a time of war, is to immediately help provide energy security around the globe while remaining focused on accelerating the development of affordable, reliable and lower-carbon energy solutions. We have a goal to reduce the carbon intensity of our financing portfolios, starting with oil & gas, electric power and automotive manufacturing, and targeting $1 trillion by 2030 – as part of an overall $2.5 trillion sustainable development target – to advance renewable energy and other innovative technologies. And we are minimizing the environmental impact of our physical operations across thousands of branches, as well as our data centers and corporate offices. We are also making progress in implementing our $30 billion commitment to help close the racial wealth gap. Financing affordable places for people to live, expanding access to services through local community branches, and supporting Minority Depository Institutions and Community Development Financial Institutions are a few examples of how we’re putting this commitment to work. Because racial equity, like climate, requires a coordinated government response, we are advocating for policies that diversify the appraisal industry, help Americans with no credit file gain access to credit and provide access to affordable small business loans. Finally, we can only run a strong company and tackle these challenges if we have exemplary people. I am so proud of how hard our employees have worked through these tough times and the continued steps we’ve taken to cultivate a diverse and inclusive workplace and support our customers and communities. There is no doubt we – both as a company and society – have a long way to go. We may not get it right every time, but we strive every day to do the right thing. Moments of crisis are also moments of opportunity. In this year’s ESG report, I invite you to read about the work we do every day to drive lasting change. Jamie Dimon Chairman & CEO, JPMorgan Chase & Co. 2 INTRODUCTION Message from Our Chairman & CEO Company at a Glance Our Approach to ESG Feature: Our $2.5 Trillion Sustainable Development Target ENVIRONMENTAL SOCIAL GOVERNANCE ESG REPORT APPENDICES
Company at a Glance JPMorgan Chase & Co. (“JPMorgan Chase”, the “Firm” or “we”) is a financial services company based in the United States of America ("U.S."), with branches in 48 states and Washington D.C., with 271,025 employees in 62 countries worldwide and $3.7 trillion in assets as of December 31, 2021. The Firm is a leader in investment banking, financial services for consumers and small businesses, commercial banking, financial transaction processing and asset management. Under the J.P. Morgan and Chase brands, the Firm serves millions of customers, predominantly in the U.S., and many of the world’s most prominent corporate, institutional and government clients globally. JPMorgan Chase’s activities are organized, for management reporting purposes, into four major reportable business segments, as well as a Corporate segment. The Firm’s consumer business is the Consumer & Community Banking ("CCB") segment. The Firm’s wholesale business segments are the Corporate & Investment Bank ("CIB"), Commercial Banking ("CB"), and Asset & Wealth Management ("AWM"). The business segments are referred to as “lines of business.” For further information, refer to Business Segment Results on pages 61–81 of our Form 10-K for the year ended December 31, 2021. CONSUMER & COMMUNITY BANKING CCB offers services to consumers and businesses through bank branches, ATMs, digital (including mobile and online) and telephone banking. CCB is organized into Consumer & Business Banking (including Consumer Banking, J.P. Morgan Wealth Management and Business Banking), Home Lending (including Home Lending Production, Home Lending Servicing and Real Estate Portfolios), Card & Auto. Consumer & Business Banking offers deposit, investment and lending products, payments and services to consumers, and lending, deposit, and cash management and payment solutions to small businesses. Home Lending includes mortgage origination and servicing activities, as well as portfolios consisting of residential mortgages and home equity loans. Card & Auto issues credit cards to consumers and small businesses and originates and services auto loans and leases. CORPORATE & INVESTMENT BANK CIB offers a broad suite of investment banking, market-making, prime brokerage, and treasury and securities products and services to a global client base of corporations, investors, financial institutions, merchants, and government and municipal entities. Banking offers a full range of investment banking products and services in all major capital markets, including advising on corporate strategy and structure, capital-raising in equity and debt markets, as well as loan origination and syndication. Banking also includes Payments, which provides payments services enabling clients to manage payments and receipts globally, and cross-border financing. Markets & Securities Services includes Markets, a global market-maker across products, including cash and derivative instruments, which also offers sophisticated risk management solutions, prime brokerage, and research. Markets & Securities Services also includes Securities Services, a leading global custodian which provides custody, fund accounting and administration, and securities lending products principally for asset managers, insurance companies and public and private investment funds. COMMERCIAL BANKING CB provides comprehensive financial solutions, including lending, payments, investment banking and asset management products across three primary client segments: Middle Market Banking, Corporate Client Banking and Commercial Real Estate Banking. Middle Market Banking covers small and midsized companies, local governments and nonprofit clients. Corporate Client Banking covers large corporations. Commercial Real Estate Banking covers investors, developers, and owners of multifamily, office, retail, industrial and affordable housing properties. ASSET & WEALTH MANAGEMENT Asset Management offers multi-asset investment management solutions across equities, fixed income, alternatives and money market funds to institutional and retail investors, providing for a broad range of clients’ investment needs. The Global Private Bank provides retirement products and services, brokerage, custody, trusts and estates, loans, mortgages, deposits and investment management to high net worth clients. The majority of AWM’s client assets are in actively managed portfolios. CORPORATE The Corporate segment consists of Treasury and Chief Investment Office ("CIO") and Other Corporate, which includes corporate staff functions and expense that is centrally managed. Treasury and CIO is predominantly responsible for measuring, monitoring, reporting and managing the Firm’s liquidity, funding, capital, structural interest rate and foreign exchange risks. The major Other Corporate functions include Real Estate, Technology, Legal, Corporate Finance, Human Resources, Internal Audit, Risk Management, Compliance, Control Management, Corporate Responsibility and various Other Corporate groups. Information about JPMorgan Chase’s financial performance is available in our quarterly earnings materials, as well as quarterly and annual reports on Form 10-Q and Form 10-K, respectively. 3 INTRODUCTION Message from Our Chairman & CEO Company at a Glance Our Approach to ESG Feature: Our $2.5 Trillion Sustainable Development Target ENVIRONMENTAL SOCIAL GOVERNANCE ESG REPORT APPENDICES
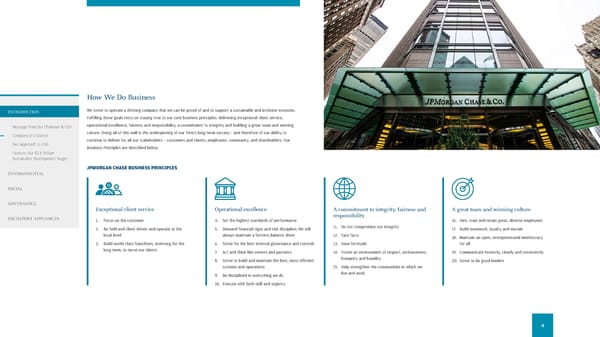
Exceptional client service 1. Focus on the customer 2. Be field and client driven and operate at the local level 3. Build world-class franchises, investing for the long term, to serve our clients Operational excellence 4. Set the highest standards of performance 5. Demand financial rigor and risk discipline; We will always maintain a fortress balance sheet 6. Strive for the best internal governance and controls 7. Act and think like owners and partners 8. Strive to build and maintain the best, most efficient systems and operations 9. Be disciplined in everything we do 10. Execute with both skill and urgency A commitment to integrity, fairness and responsibility 11. Do not compromise our integrity 12. Face facts 13. Have fortitude 14. Foster an environment of respect, inclusiveness, humanity and humility 15. Help strengthen the communities in which we live and work A great team and winning culture 16. Hire, train and retain great, diverse employees 17. Build teamwork, loyalty and morale 18. Maintain an open, entrepreneurial meritocracy for all 19. Communicate honestly, clearly and consistently 20. Strive to be good leaders How We Do Business We strive to operate a thriving company that we can be proud of and to support a sustainable and inclusive economy. Fulfilling these goals rests on staying true to our core business principles: delivering exceptional client service, operational excellence, fairness and responsibility, a commitment to integrity and building a great team and winning culture. Doing all of this well is the underpinning of our Firm’s long-term success – and therefore of our ability to continue to deliver for all our stakeholders – customers and clients, employees, community, and shareholders. Our Business Principles are described below. JPMORGAN CHASE BUSINESS PRINCIPLES 4 INTRODUCTION Message from Our Chairman & CEO Company at a Glance Our Approach to ESG Feature: Our $2.5 Trillion Sustainable Development Target ENVIRONMENTAL SOCIAL GOVERNANCE ESG REPORT APPENDICES
Our Approach to ESG The finance sector has an important role to play in helping to address some of the most pressing environmental and social challenges of our time; targeted capital is vital to seed, fund and scale solutions, whether helping address the racial wealth gap or advancing solutions and innovations needed for the low-carbon transition. We believe the scale and reach of our business and our approach to Environmental, Social and Governance ("ESG") matters helps drive this progress and contributes to a more sustainable and inclusive economy. Building off the foundation of our Business Principles, we are leveraging our expertise, capital, data and resources to advance inclusive growth and support the transition to a low- carbon economy. ESG matters are an important consideration in how we do business, including how we develop our products and services, serve our customers, support our employees and help lift our communities. Our Sustainable Development Target, which we set in 2021, puts these objectives into practice – financing and facilitating more than $2.5 trillion over 10 years to help address climate change and contribute to sustainable development (see page 6). As does our $30 billion Racial Equity Commitment, announced in 2020, which aims to advance racial equity and promote inclusive growth (see page 21). DRIVING AN INCLUSIVE AND SUSTAINABLE ECONOMY FOR ALL: OUR FIRMWIDE PILLARS Careers and Skills Financial Health and Wealth Creation Business Growth and Entrepreneurship Community Development Environmental Sustainability About This Report Our Firm communicates information about our ESG practices and performance through a number of channels — including our Annual Report and Proxy Statement, various other reports and presentations, regulatory filings, press releases and direct conversations with stakeholders. We maintain a dedicated ESG Information page on our website to facilitate access to information that we publish on these topics. This annual ESG Report is designed to consolidate and summarize our work on ESG topics that are important to our business and stakeholders, and guide readers to where they can access more detailed information about specific topics of interest. All data in this report are as of December 31, 2021, unless otherwise noted. This ESG Report has also been informed by the Global Reporting Initiative ("GRI"), including the GRI Universal Standards released in 2021 and relevant Sector Standards, and the Sustainability Accounting Standards Board ("SASB") reporting standards. Our ESG Report Appendices (see page 60) on GRI and SASB map our Firm’s disclosures related to these frameworks’ indicators and recommendations. In 2022, we intend to release a dedicated climate report, which will be informed by the recommendations of the Task Force on Climate-Related Financial Disclosures ("TCFD"). 5 INTRODUCTION Message from Our Chairman & CEO Company at a Glance Our Approach to ESG Feature: Our $2.5 Trillion Sustainable Development Target ENVIRONMENTAL SOCIAL GOVERNANCE ESG REPORT APPENDICES
Our $2.5 Trillion Sustainable Development Target We believe creating sustainable economic growth is important to the long-term strength and vibrancy of the global economy, and to the health and prosperity of people and communities around the world. As a global financial institution, we are leveraging our capabilities and expertise to provide capital and advice that supports economic growth while helping to address key global challenges. That is why we have set a target to finance and facilitate more than $2.5 trillion over 10 years – from 2021 through the end of 2030 – to advance long-term solutions that address climate change and contribute to sustainable development. Our Sustainable Development Target (the “Target”) aims to grow and strengthen our business activities across three important areas: Green Accelerating the deployment of solutions for cleaner sources of energy and facilitating the transition to a low-carbon economy. Our goal is to facilitate $1 trillion in this area alone, through a wide range of activities including underwriting green bonds, lending to support construction of sustainable infrastructure and raising capital for innovative clean technology companies. Development Finance Mobilizing capital to advance the United Nations Sustainable Development Goals ("SDGs") in emerging economies . The J.P. Morgan Development Finance Institution ("JPM DFI") works to assess the anticipated development impact of transactions with the goal of attracting institutional investors interested in environmental and socioeconomic impact in developing countries. Community Development Advancing economic inclusion in developed markets. We are working to bolster inclusive growth by supporting areas such as small business, homeownership, affordable housing, education and health care, with a focus on low-to- moderate income ("LMI") individuals and communities, as well as Black, Hispanic and Latino individuals and communities. This includes many of the actions we are taking as part of our five-year, $30 billion Racial Equity Commitment. The Target represents a key aspect of our Firmwide approach to ESG – supporting our clients and customers through financing act ivities that advance sustainable economic growth – and highlights the work of other key initiatives, including our efforts to support the low-carbon transition (see page 12), the work of the JPM DFI (see page 9) and the progress of our $30 billion Racial Equity Commitment (see page 21). This section explains why we developed the Target and how we are organizing to drive its implementation across our business. It also provides an update on our progress and examples of transactions completed in 2021, as well as links to additional information within and beyond this report. Why We Created the Target The Target reflects our recognition of the need for collective action to address the world’s most important challenges and the role that the financial sector can play in mobilizing the capital needed to drive progress. It expands on our prior one-year target – $200 billion to support climate action and sustainable development in 2020 – to a new, 10-year target that extends through the end of 2030, which corresponds with the timeframe we set to meet our initial emission intensity reduction targets within our financing portfolio (see page 12) as well as the current timeframe set by the United Nations for achieving the SDGs. By drawing awareness to the work happening across the Firm to advance sustainable development, the Target is designed to mobilize our efforts and sharpen our focus on key areas that contribute towards solutions for the world’s toughest challenges. EVOLUTION OF OUR SUSTAINABLE DEVELOPMENT TARGET The Target builds on our history of fulfilled commitments to support climate action and sustainability. 2017 Facilitate $200 billion in clean financing by 2025 1 2020 Finance and facilitate $200 billion for climate action and sustainable development in 2020 2 2021 Finance and facilitate more than $2.5 trillion for climate action and sustainable development over 10 years, by the end of 2030 FEATURE 1 Achieved in 2020. 2 Achieved in 2020, by financing over $220 billion in transactions, including more than $55 billion toward green initiatives. 6 INTRODUCTION Message from Our Chairman & CEO Company at a Glance Our Approach to ESG Feature: Our $2.5 Trillion Sustainable Development Target ENVIRONMENTAL SOCIAL GOVERNANCE ESG REPORT APPENDICES
How We Developed the Target In setting the Target, we took into account the Firm’s breadth, scope and geographic reach, spanning the globe and encompassing activities across both our retail and wholesale business segments. We prioritized areas that are important to global sustainability and inclusive growth and where we believe our capabilities and expertise can help drive progress. We also concentrated on topics that are important to our stakeholders, including customers and clients, employees, communities and shareholders. This led to the Target’s three areas of focus, each of which combines a clear need and business opportunity that we believe our Firm is well positioned to address. In the development of the Target's criteria and methodology, we also took into account international best practices and industry standards, such as the SDGs, the International Capital Market Association’s Green and Social Bond Principles and the International Finance Corporation’s Anticipated Impact Measurement and Monitoring framework. How We Are Driving Progress We are mobilizing resources and expertise throughout the Firm to drive progress toward our goals. This includes deploying both new and existing teams to enhance our capabilities and realize opportunities across our wholesale and consumer business segments, as well as across other corporate functions. For example, CCB’s Community and Affordable Home Lending business is helping expand our support for sustainable homeownership, and our growing network of Community Center branches is advancing a new model for how we support diverse entrepreneurs and their communities. Elsewhere, we are investing in resources such as CB’s Green Economy and Community Development Banking teams, CIB’s ESG Solutions team and Center for Carbon Transition ("CCT"), and the JPM DFI, each of which play a key role in collaborating with our global network of bankers and product specialists to deliver strategic services and facilitate financing at scale. For the Target, we have established a robust governance process designed to provide accountability for how we quantify and track our progress over time. This includes a cross-line-of-business and functional group responsible for approving the quantification approach, documentation and reporting associated with transactions that contribute toward the Target. Together, these actions support strategic decision-making within and across our businesses as we work to drive continued progress through 2030. Progress to Date In 2021, our Firm financed and facilitated approximately $285 billion towards the Target. Across our three objectives, 41% went towards development finance, 37% towards green, and 22% towards community development. In this section we discuss our progress in each objective through December 31, 2021. To learn more about our criteria for determining what business activity is eligible to count toward our Sustainable Development Target and how we account for the value of transactions, see Our Approach to Our Sustainable Development Target . 3 3 Our approach to measuring our progress for the Target builds off the criteria and methodology we developed for our $200 billion commitment in 2020. For the Target, we made methodological adjustments from the 2020 commitment in two main areas: 1) Development Finance, driven by refinements in the JPM DFI’s methodology as explained in its latest annual report; and 2) Community Development, with the inclusion of small business and housing-related loans and investments for Black, Hispanic and Latino individuals and communities, largely consistent with our Racial Equity Commitment. TOTAL $285B 11% $2.5T TARGET 2021 2030 TOTAL $285B Green $106B37%37% Community Development $61B22% Development Finance $117B41% Corporate & Investment Bank | Investment Banking $133B47% Including capital raising in debt and equity markets; underwriting of sustainable bonds (i.e., green, social and sustainability bonds); municipal and not-for-profit bonds; initial public o ff erings (IPOs); follow-on o ff erings (FPOs); private placements and advisory services, including mergers and acquisitions (M&A) Corporate & Investment Bank | Markets $101B36% Including certain emission contracts and investments in tax credit vehicles in alternative energy (e.g., solar and wind projects) Consumer & Community Banking $35B12% Including support for small businesses, home ownership and consumer adoption of electric vehicles Commercial Banking $15B5% Including a ff ordable housing, retrofitting, rehabilitating or constructing accredited energy-e ff icient buildings (e.g., LEED, Energy Star) SUSTAINABLE DEVELOPMENT TARGET 7 INTRODUCTION Message from Our Chairman & CEO Company at a Glance Our Approach to ESG Feature: Our $2.5 Trillion Sustainable Development Target ENVIRONMENTAL SOCIAL GOVERNANCE ESG REPORT APPENDICES
TOTAL $285B Green $106B Community Development $61B Development Finance $117B Eligibility Criteria $B % Sustainab le Transportation $22 4 21% Renewable En ergy & Energy Efficiency $14 14% Water & Waste Management $6 6% Green Buildings $2 2% Mixed Use 5 $60 57% Courtesy of Vineyard Wind LLC GREEN By the end of 2030, we aim to finance and facilitate $1 trillion in support of the deployment of solutions for cleaner sources of energy and facilitating the transition to a low-carbon economy. Our eligible business activities include renewable energy, clean technology, water, waste management, conservation, sustainable transportation, green buildings and energy efficiency. In 2021, we financed and facilitated approximately $106 billion in support of our green objective, particularly towards sustainable transportation and renewable energy. We supported these areas through a variety of businesses around our Firm, such as underwriting green bonds for corporate and sovereign issuers, capital raising and advisory services for electric vehicles ("EV") companies and lending to emerging renewable energy companies. 2021, in particular, was a year characterized by strong market factors, including record-breaking global M&A activity and significant growth of the sustainable bond market. Our Target in Action: Powering America’s Largest Offshore Wind Farm JPMorgan Chase served as Joint Lead Arranger for more than $2 billion in financing for the 800 megawatt Vineyard Wind project, the first offshore wind farm in the United States capable of generating power at utility scale and the country’s largest source of offshore wind power. Situated off the coast of Martha’s Vineyard, the project is expected to supply enough energy to serve the needs of 400,000 Massachusetts households and businesses and avoid 1.68 million metric tons of carbon emissions annually, while contributing to efforts to transition the U.S. power grid to cleaner sources of energy. JPMorgan Chase provided services across our diversified business to support the development of Vineyard Wind. We provided Investment Banking services, acting as Joint Lead Arranger and Syndication Agent for a senior secured loan. We also provided Markets products (providing hedges to mitigate risk) and Treasury products (cash management as the depository account bank). 6 4 Totals may not sum due to rounding. 5 Mixed Use is comprised of transactions where the use of proceeds may facilitate activities across more than one eligibility criteria, such as green bonds and emissions contracts. 6 Of the various products and services JPMorgan Chase provided to support the project, only the senior secured loan was counted towards the Target. For the senior secured loan which had multiple book runners, only JPMorgan Chase's participation is counted toward the Target. Select Eligibility Criteria by Dollar Amount 8 INTRODUCTION Message from Our Chairman & CEO Company at a Glance Our Approach to ESG Feature: Our $2.5 Trillion Sustainable Development Target ENVIRONMENTAL SOCIAL GOVERNANCE ESG REPORT APPENDICES
Courtesy of Liquid Telecommunications Financing Plc TOTAL $285B Green $106B Development Finance $117B Community Development $61B Region % Latin America & the Caribbean 27% East ern Europe & Central Asia 26% Global Development Institutions 22% East Asia & the Pacific 12% Sub-Saharan Africa 9% South Asia 5% Middle East & North Africa 1% DEVELOPMENT FINANCE The development finance objective of the Target highlights the work of the JPM DFI, which was established to spur capital towards sustainable development projects – such as expanded access to education, financial services, telecommunications and health care – in developing countries. By assessing transactions based on their anticipated environmental and socioeconomic impacts, the JPM DFI seeks to expand the market for development finance and grow the pool of investors interested in transactions that offer financial returns and advance the SDGs. For more information, see page 45, as well as the JPM DFI’s 2021 Annual Report . In 2021, approximately $117 billion of development finance activity – nearly 600 transactions – was qualified towards the Target. 7 Our Target in Action: Expanding Access to Telecommunications in Sub-Saharan Africa In February 2021, JPM DFI acted as the Development Finance Structuring Agent for a $620 million corporate bond issued by Liquid Telecom, one of the largest multi-country, open access fiber network operators in Africa. The company operates its largely owned fiber optic and wireless network across more than 20 countries, including Botswana, Democratic Republic of Congo, Kenya, Rwanda, South Africa, South Sudan, Tanzania, Uganda, Zambia and Zimbabwe. These countries have a combined population of around 500 million people, but only 23 million mobile broadband users and three million fixed broadband users, indicating limited access to telecommunication services, particularly for those living in rural areas. The bond issuance is expected to enable Liquid Telecom to help address key development gaps in the region and improve delivery of education, healthcare and key services to both urban and rural populations in Sub-Saharan Africa. Through the use of proceeds from the bond, Liquid Telecom is anticipating to improve access to information and communication technology and foster financial inclusion by: • Connecting approximately 800 buildings and 5,000 homes to the Fiber to the Home ("FTTH") network in the DRC, Rwanda and Zambia; • Doubling the capacity of the Company’s FTTH network to approximately 100,000 existing homes in Kenya, Rwanda, Uganda and Zambia; • Increasing coverage in Zambia and Zimbabwe by adding more than 100 additional LTE sites; • Expanding its fiber network in the DRC to reach, via service providers, approximately 75% of the population; and • Creating employment opportunities specifically in the DRC and South Sudan. The JPM DFI assessed the transaction and determined it advances United Nations SDGs #8 and #9, which are associated with promoting decent work and building resilient infrastructure, promoting sustainable industrialization and fostering innovation. 7 Numbers may differ from the JPM DFI's 2021 Annual Report primarily due to overlap with some transactions advancing both the green objective and development finance objective. For the Target, these transactions are counted only once, toward the green objective. Select Geographies by Number of Transactions 9 INTRODUCTION Message from Our Chairman & CEO Company at a Glance Our Approach to ESG Feature: Our $2.5 Trillion Sustainable Development Target ENVIRONMENTAL SOCIAL GOVERNANCE ESG REPORT APPENDICES
Courtesy of Riverton Square LLC TOTAL $285B Green $106B Development Finance $117B Community Development $61B Eligibility Criteria $B 8 % Home Ownership $31 50% Affordable Housing $17 29% Small Business $2 4% Mixed Use 9 $10 17% COMMUNITY DEVELOPMENT Our work in the Community Development area of our Target supports areas such as homeownership and affordable housing, small business, education and health care, with a focus on LMI and Black, Hispanic and Latino individuals and communities. In 2021, we reflected approximately $61 billion of financing and facilitation towards this objective. The Community Development objective also highlights our commitment to racial equity, and includes many of the activities we are engaging in as part of our five-year $30 billion Racial Equity Commitment. By the end of 2021, we had deployed or committed more than $18 billion toward our $30 billion goal. Of this $18 billion, more than $16 billion is also reflected here within the Community Development objective of our Sustainable Development Target. For more details on our Racial Equity Commitment, see page 21. Our Target in Action: Refinancing Affordable Housing Units in New York In June 2021, JPMorgan Chase, through the Corporate & Investment Bank, provided $600 million of financing to A&E Real Estate to facilitate the refinancing and preservation of a portfolio of 53 rent-regulated residential buildings comprising 3,531 rental units located in high-cost areas throughout the Manhattan, Brooklyn, Queens and Bronx boroughs of New York City. The largest single property in the portfolio is the 1,229-unit Riverton Square complex in East Harlem. Originally constructed in the 1940s, the development provided an alternative to the many housing projects that discriminated against non-White residents that were built in the same period. As such, it provided housing opportunities to predominantly Black families and represents the storied history of the Black community in New York. Riverton Square is subject to a regulatory agreement to maintain 975 affordable units (79% of the property), which ensures long term affordability at the complex. The agreement establishes that as leases expire on the units, they remain affordable to various income brackets (60%, 80% and 125% of area median income). As of October 2021, 96.5% of the property was classified as affordable. 8 Totals may not sum due to rounding. 9 Mixed Use is comprised of transactions where the use of proceeds may facilitate activities across more than one eligibility criteria, such as social bonds. Select Eligibility Criteria by Dollar Amount 10 INTRODUCTION Message from Our Chairman & CEO Company at a Glance Our Approach to ESG Feature: Our $2.5 Trillion Sustainable Development Target ENVIRONMENTAL SOCIAL GOVERNANCE ESG REPORT APPENDICES
Environmental A healthy environment is crucial to the long-term success of the economy and of communities around the world, but climate change and other environmental challenges pose increasing threats to our collective future. As a global financial institution working with clients in nearly every sector of the economy, we have an important role to play in tackling environmental challenges. Our strategy includes financing and investment solutions to help accelerate the transition to a low-carbon, sustainable economy, supporting our clients with strategic advice and continuing to minimize the environmental impact of our own operations. 2021 Highlights • Set our first portfolio-level emissions intensity reduction targets for three sectors – Oil & Gas, Electric Power and Auto Manufacturing – and published our Carbon Compass SM methodology • Joined the Industry-led, United Nations-convened Net Zero Banking Alliance ("NZBA") and the Net Zero Asset Management ("NZAM") initiative • Issued a $1.25 billion green bond in August 2021 • Financed and facilitated $106 billion in support of the green objective of our Sustainable Development Target • Reduced Scope 1 and 2 greenhouse gas (“GHG”) emissions in our global operations by approximately 15% • Met our goal to maintain carbon neutral operations for the second year in a row 11
Advancing Climate and Sustainability Solutions Developing solutions to environmental challenges such as climate change is important to protecting our planet and creating long-term, sustainable economic growth. The financial sector has a unique role to play, particularly in mobilizing the capital necessary to develop new technologies and build sustainable infrastructure. At JPMorgan Chase, we are using our capabilities to promote sustainable business practices and help our clients respond to and drive new solutions to the challenges the world faces. This includes working with clients to support the transition to a low-carbon economy and providing sustainable investing and financing solutions. Supporting the Transition to a Low-Carbon Economy Climate change is one of the most critical challenges facing our planet and society. We are responding by minimizing the carbon footprint of our own physical operations (see page 17), and by leveraging our business to support and accelerate the global transition to a low-carbon economy. In recent years, many governments, businesses and NGOs have aligned around the collective ambition to reduce global emissions to net zero by 2050. However, the world is not on track to achieve this goal. Achieving net zero by 2050 requires transforming the global energy system, as well as making significant changes in how key goods and services are produced and delivered. The financial sector will play a key role in facilitating the substantial investment of this transition. As a global financial institution, our strategy is focused on providing financing, strategic advice and investment services to help clients adapt to and thrive in a low-carbon economy. OUR PATH TO NET-ZERO FINANCED EMISSIONS A key aspect of our low-carbon strategy is how we engage with our clients in carbon-intensive industries on their transition. In 2020, we pledged to align key sectors of our financing portfolio with the goals of the Paris Agreement. In May 2021, we became the first large U.S. bank to set 2030 targets – which we set as portfolio-level emissions intensity reduction targets for the Oil & Gas, Electric Power and Auto Manufacturing sectors – and published our Carbon Compass Methodology detailing our approach. We also announced our plans to expand our targets to new sectors of our financing portfolio over time. In October 2021, we joined the NZBA, a group convened by the United Nations Environment Programme Finance Initiative which brings together a global network of banks committed to aligning their lending and investment portfolios with net zero emissions by 2050. While thoughtful policy, technology and behavioral advancements are all prerequisites in realizing our common goals around net zero emissions by 2050, we joined the NZBA because we support the ambition for greater climate action, the sharing of best practices and a collaborative approach between the public and private sectors to reach this goal. We may further address important details of these efforts as they develop over time, including where we believe practical considerations may constrain our work against the ambitions of the NZBA – such as the necessity of technological advancements, the evolution of consumer behavior, the need for thoughtful climate policies around the world, the challenge of balancing short-term targets with the need to facilitate an orderly and just transition, and other critical considerations such as legal and regulatory obligations. Participating in industry initiatives will also support our efforts to develop targets for other sectors and engage with a growing number of clients who are aligning their strategies with widely-recognized and science-based emission reduction pathways. How We Are Implementing Our Targets Since setting our first portfolio-level emissions intensity reduction targets, we have focused on implementing them in the management of our Oil & Gas, Electric Power and Auto Manufacturing financing portfolios. As part of this, an assessment of our client's emissions and decarbonization plans is now factored into our decision-making while considering new transactions for in-scope clients in these sectors – for both lending and debt capital markets transactions. This assessment allows us to: 1) build in a view of our client's decarbonization trajectories during the decision-making process on a potential new transaction, as a factor in our usual approval processes, and 2) assess both our client's progress and in turn, our own progress towards our targets on an ongoing basis. 12 INTRODUCTION ENVIRONMENTAL Advancing Climate and Sustainability Solutions Operational Sustainability SOCIAL GOVERNANCE ESG REPORT APPENDICES
Our assessment framework uses a variety of quantitative and qualitative measures to evaluate clients’ current emissions performance, their track record and future plans. Quantitatively, we collect and assess historical emissions reductions, current carbon intensity and forecasted intensity based on publicly announced emissions targets. Qualitatively, we assess actions the client has taken to drive progress, such as formulating detailed decarbonization plans, establishing clear governance and oversight of climate strategies and polices, and more. The development and implementation of our assessment framework was led by the CCT, along with partners such as key Banking and Risk Management groups. We will continue to build on our efforts in key portfolios over time, particularly as we expand to additional targets and sectors. SUPPORTING OUR CLIENTS WITH CAPITAL AND EXPERTISE The low carbon transition is a focus for our banking teams, and we continue to build our ability to provide tailored advice and solutions to our clients as they adapt and grow their businesses in a changing world. Whether a client is working to transition their business model and operations to reduce emissions, or to develop and grow new technologies or solutions to help address the climate challenge, our objective is to use our capital and expertise to help them succeed. As we expand our capabilities, we are able to provide clients with increasingly diverse and innovative solutions, while helping to grow the market for green and sustainable financing. For example, in October 2021, we acted as Joint Placement Agent on a $1 billion equity placement to capitalize a new passenger EV subsidiary for Tata Motors. Recognizing the potential and capital needs of the passenger EV business, the transaction was designed to attract investors seeking exposure to this segment and enable Tata Motors to accelerate its plans. As another example, in June 2021 we acted as Active Bookrunner on a $1.5 billion green bond offering by NextEra Energy. NextEra owns and operates two businesses – Florida Power & Light, the largest utility in the U.S., and NextEra Energy Resources, the world’s largest generator of renewable energy from wind and solar – which are working together toward a goal of reducing NextEra’s emissions 67% by 2025 from a 2005 baseline. The bond, proceeds of which will be used to support a portfolio of renewable energy generation and storage projects, uses a mechanism to encourage transparency and accountability, by providing a coupon step-up if the company fails to produce certification of allocation and impact within two years and 60 days of issuance. This work is further highlighted by the green objective of our Sustainable Development Target, which aims to finance and facilitate $1 trillion through the end of 2030 towards the deployment of solutions for cleaner sources of energy and supporting the transition to a low-carbon, sustainable economy. This includes transactions supporting renewable energy, clean technology, water and waste management, conservation, sustainable transportation, green buildings and energy efficiency. For more information on our progress toward our Sustainable Development Target and examples of qualifying green transactions, see page 8. ENHANCING OUR COVERAGE As we further implement our low-carbon transition strategy, we continue to enhance our abilities to meet client needs through both deepening expertise in our existing teams and establishing new teams specializing in green and other transition-related areas. For example: • Our CIB CCT plays a key role in driving implementation of our emissions intensity reduction targets and engaging with cli - ents on sustainability-focused financing, research and advisory solutions to help guide their long-term business strategies. This includes providing strategic advice on clients’ long-term business strategies and related carbon disclosures, as well as partnering with industry and product teams to structure unique financing products across public and private capital mar - kets. The CCT has accountability to senior leadership in the CIB and CB and works in close partnership with teams across our Firm to drive achievement of our targets. • Formally launched in 2021, our CB Green Economy Banking team is a specialized industry coverage team established to drive the Green Economy client franchise by providing subject matter expertise, connectivity to bank products and solutions and specialized credit underwriting efforts to the growing number of companies primarily focused on sustainable technologies, products and services. Over the past year, the team has grown in the U.S., while also laying the groundwork to expand inter - nationally. Green Economy Banking is currently aligned with five sectors – renewable energy & carbon, efficiency technol - ogy, sustainable finance, sustainable agriculture & food technology, clean energy mobility – and senior Green Economy bankers have assigned sub-industry coverage within these sectors. The team’s mission is to identify and support emerging and established growth companies in these key sectors. In the following section, we highlight additional teams around our Firm which are providing sustainability-focused solutions for our clients and customers. Next Steps In 2022, we intend to release a dedicated climate report, informed by the recommendations of the TCFD, which will include progress updates on our emissions intensity reduction targets and our next steps in expanding to additional sectors. 13 INTRODUCTION ENVIRONMENTAL Advancing Climate and Sustainability Solutions Operational Sustainability SOCIAL GOVERNANCE ESG REPORT APPENDICES
Providing Sustainable Solutions In combination with our low-carbon transition strategy, we also continue to grow a range of sustainability-focused financing and investing solutions across the Firm. ASSET AND WEALTH MANAGEMENT J.P. Morgan AWM is a global leader in asset and wealth management services, which serves institutional, ultra-high net worth, high net worth and individual clients through its AWM businesses. With combined overall client assets of $4.3 trillion and assets under management ("AUM") of $3.1 trillion as of December 31, 2021, we are one of the largest asset and wealth managers in the world. Asset Management J.P. Morgan Asset Management believes that consideration of financially material ESG factors can be an important part of the investment process. We define ESG integration as the systematic inclusion of ESG issues in investment analysis and investment decisions. In actively managed assets deemed by J.P. Morgan Asset Management to be ESG integrated under our governance process, we systematically assess financially material ESG factors in our investment decisions with the goals of reducing risk and improving long-term returns. ESG integration does not change a strategy’s investment objective, exclude specific types of companies or constrain a strategy’s investable universe. In addition, we offer sustainable investment solutions to clients seeking to generate long-term returns and contribute to sustainable outcomes. For example, in 2021, we launched 20 new sustainable funds, including a range of regional sustainable equity and climate-focused funds that expand clients’ opportunities to support and capitalize on the transition to a low-carbon, sustainable economy, including areas such as renewable energy, recycling, and sustainable transport. Our Asset Management Global Sustainable Investing team is a dedicated group that focuses on sustainable investing topics in partnership with our investment professionals globally. They provide global sustainable investing research and insights on thematic ESG issues including climate change that can be applied across asset classes – they work with clients to build and implement sustainable investing solutions and they oversee our stewardship activities. In 2021, we added individuals with dedicated expertise in climate science to our Sustainable Investing team and are working to leverage new tools, including enhanced research and scenario analysis, to enable us to further consider climate risks and potential opportunities in our engagement, stewardship and investment processes. We directly engage with selected investee companies on ESG topics. In 2021 we engaged over 1,300 companies on ESG issues. We also express our views through our proxy voting activity. In March 2022, we published our 2021 Investment Stewardship Report outlining our global engagement, voting and stewardship activities including climate-related engagement activities. In 2021, to further support our clients' climate-aware investing, we became a signatory to the NZAM initiative, an international group of asset managers committed to supporting investing aligned with the goal of net zero greenhouse gas emissions by 2050 or sooner, in line with global efforts to limit warming to 1.5 degrees Celsius. This commitment includes: engaging with clients to accelerate the global low-carbon transition to net zero within their portfolios, setting interim targets within the next 12 months for assets that we determine could be appropriately managed in line with net zero pathways, continuing to accelerate our corporate engagement and stewardship, and policy advocacy consistent with net zero ambitions. Thoughtful governmental policy, investments in low-carbon technologies and collaboration between the public and private sectors are all prerequisites for transitioning to a low-carbon world, J.P. Morgan Asset Management is pleased to play its part in identifying solutions by working with clients to develop products and solutions consistent with a net zero ambition. Global Private Bank We also continue to expand our sustainable investment offerings through J.P. Morgan Global Private Bank, which provides clients with access to multiple sustainable investment strategies across equities, fixed income, alternatives and multi-asset portfolios. In 2021, we saw record inflows in sustainable investment portfolios and strategies and grew total sustainable AUM 60% from the prior year. In March 2021, we closed our new Global Impact Fund with over $150 million in commitments. The Fund offers a diversified portfolio of impact private investment funds constructed with the intent to advance progress toward specific United Nations SDGs. Launched in 2019, our Sustainable Equity Strategy invests in equity funds with a preference toward funds that consider ESG factors in their investment process and focus on sustainable themes, based on our internally defined criteria. In 2021, the strategy grew to more than $1.5 billion in AUM. We also continue to see enhanced client interest in thematic investing, particularly in relation to climate change. In response, we are further expanding our range of available strategies and funds. For example, we have added new fund options focused on companies leading the clean energy transition, based on the expectation that they will deliver returns as decarbonization trends accelerate across key industries and markets. We continue to invest in tools and solutions to help clients achieve their sustainable investing goals and to further raise their awareness and understanding of sustainable investment trends and opportunities. For example, in June 2021 we acquired OpenInvest, a values-based investing financial technology company. In the future, using proprietary technology and insights, OpenInvest’s platform will unlock a personalized and engaging end-to-end client experience including the ability to personalize portfolios to align with clients’ values and preferences, and sophisticated sustainability reporting to help clients understand how their investments are supporting their goals and impacting the world. 14 INTRODUCTION ENVIRONMENTAL Advancing Climate and Sustainability Solutions Operational Sustainability SOCIAL GOVERNANCE ESG REPORT APPENDICES
ADVANCING SUSTAINABILITY THROUGH INVESTMENT RESEARCH We produce robust ESG-focused investment research to meet investors’ needs for timely insights and analysis that support their sustainability and ESG investment strategies. In 2021, our Firm published over 900 ESG-related reports across key regions to address investors’ needs for strategic and thought-leading ESG analyses. Our published ESG content has included regular thematic thought pieces on key developments in ESG & Sustainability, collaborative pieces between ESG and Sector analysts that assessed ESG issues with industry context, and our ESGQ methodology, a proprietary scoring which combines data designed to capture the long-term corporate responsibility profiles of companies and their evolution over time with more frequently updated data points. In addition, in the “J.P. Morgan Perspectives” series, we published several departmental ESG collaborations, most notably focusing on the challenges posed by the energy crunch, the Net Zero transition, the cost of decarbonization and how climate innovation can accelerate the clean energy transition. Our Firm also facilitated dialogue between investors, companies and regulators on key ESG issues by hosting our 6th Global ESG Conference in 2021, which was attended by over 1,500 participants globally. To respond to the growing client need for ESG research, we expanded our capabilities in 2021, adding ESG specialists in both our Equity Research and Global Index Research groups across various geographies. JPMorgan’s ESG Indices First launched in April 2018, the J.P. Morgan ESG ("JESG") suite of fixed income indices consider ESG factors in the creation of a composite benchmark. The suite had more than $40 billion in assets across active and passively managed funds by 2021 year-end benchmarked against them. J.P. Morgan Index Research provides daily ESG scoring coverage for over 6,000 global corporate and quasi-sovereign issuers and over 170 sovereigns. The J.P. Morgan Index Research team expanded its JESG index suite in the fourth quarter of 2021 with the launch of the J.P. Morgan ESG Global Corporate Index ("JESG GCI") – an ESG benchmark covering investment grade and high yield markets across USD, EUR, and GBP currencies, as well as the launch of the J.P. Morgan Green Bond Index (GENIE) – an ESG-aligned benchmark tracking the $1 trillion green bond market, covering green bonds across hard currency (USD, EUR, and GBP) sovereign, quasi-sovereign, supranational, corporate and local currency green government bonds across 31 eligible currencies. In addition, the team launched carbon analytics for J.P. Morgan sovereign and corporate fixed income indices, and published inaugural carbon footprint reports for flagship benchmarks incorporating greenhouse gas emissions da ta. PROVIDING ESG-RELATED FINANCING SOLUTIONS The CIB's ESG Solutions team supports clients across our major industry verticals on their responses to ESG trends. In 2021, the ESG Solutions team helped enable clients’ access to ESG-focused capital across equity, debt and private markets and had a key role in several initial public offerings ("IPOs") leading the ESG work stream and assisting issuers during pre-IPO ESG ratings assessments. UNDERWRITING GREEN, SOCIAL AND SUSTAINABILITY BONDS Through our business, we are a lead underwriter of sustainable bonds (green, social and sustainability bonds) and sustainability-linked bond issuances. In 2021, JPMorgan Chase was the number one underwriter of sustainable bonds, and the Firm’s broker-dealer subsidiaries underwrote approximately $60 billion in green, social, sustainability and sustainability-linked bonds. Our 2021 Green Bond Issuance JPMorgan Chase issued a $1.25 billion green bond in August 2021. We allocated an amount equal to the net proceeds of that offering to support nine renewable energy investments in wind, solar and geothermal projects across the U.S. These projects are expected to produce approximately 7,000 gigawatt-hours of electricity annually, enough to supply approximately 650,000 homes with clean electricity each year. For more information, see page 73 in our ESG Report Appendices. SUPPORTING OUR MARKETS CLIENTS WITH SUSTAINABILITY SOLUTIONS Within CIB Markets, we created the Global Markets Sustainability Center ("GMSC") in October 2021 to further drive the Firm's efforts in providing sustainability solutions to institutional investors. 15 INTRODUCTION ENVIRONMENTAL Advancing Climate and Sustainability Solutions Operational Sustainability SOCIAL GOVERNANCE ESG REPORT APPENDICES
Courtesy of Rivian Automotive, Inc. SUPPORTING CONSUMER ADOPTION OF ELECTRIC VEHICLES Heightened awareness of climate change has accelerated the automotive industry’s transition to EVs and there has been a corresponding increase in interest for many consumers. JPMorgan Chase is responding by helping consumers understand and navigate this new segment and access financing to support their purchases. The EV landscape is complex and evolving quickly, and information and guidance can be scattered and hard to find or understand for consumers. In response, Chase Auto is making investments in a new digital resource center to deliver guidance, insights and education information for first-time EV buyers. We are also working to increase financing to support EV adoption, including entering into private label relationships with EV manufacturers to provide flexible financing options to consumers. For example, in 2021 we launched a partnership with the EV company Rivian to offer private label financing as part of its effort to reimagine the vehicle purchase process. Beginning with the credit application on Rivian's website, customers can self-select a retail financing structure that best fits their needs. BUILDING COMMUNITY RESILIENCE TO CLIMATE CHANGE Climate change is having a disproportionate impact on many vulnerable communities, leaving them with diminished resources and a weakened ability to cope, respond and adapt. JPMorgan Chase has deployed philanthropic capital to communities around the world to support initiatives that help communities advance their resilience to climate change. Since 2019, we have committed over $13 million in grants to advance resilience to climate change, including over $5 million in 2021. We supported initiatives with local organizations around the world. Examples of programs we have supported include: • Training and Placing Underserved Individuals in Green Jobs. We are supporting Louisiana Green Corps in provid - ing workforce training and enhanced certifications to 80 unemployed and low-income individuals, to help them secure immediate opportunities in the water management and green infrastructure industries, from young adults to individuals in mid-career experiencing economic repercussions of the COVID-19 pandemic. The program includes intensive training in basic construction skills and resilience-enhancing technologies. • Mobilizing Communities to Protect Biodiversity and Combat Drought. Through a grant to The Nature Conser - vancy, we are supporting the Greater Cape Town Water Fund’s efforts to train local community members to remove invasive plants in priority source water areas in South Africa. The project aims to provide a green workforce devel - opment pipeline to combat unemployment, protect biodiversity and safeguard water. 16 INTRODUCTION ENVIRONMENTAL Advancing Climate and Sustainability Solutions Operational Sustainability SOCIAL GOVERNANCE ESG REPORT APPENDICES
Operational Sustainability Reducing the environmental impact of our physical operations is an important part of becoming a more sustainable organization. Our direct environmental impacts stem primarily from the operation of our more than 6,000 corporate offices, bank branches and data centers. Our approach to operational sustainability consists of two key components: managing our carbon footprint by reducing our direct and indirect GHG emissions; and enhancing resource management and efficiency, which includes responsible stewardship of water, waste and other key resources across our operations. Managing Our GHG Footprint Creating actionable strategies for reducing our GHG footprint depends on having clear and comprehensive insight into our emissions sources and performance. Since 2005, we have been measuring and publishing our operational GHG emissions and using that data to inform our strategies for reducing both our direct and indirect emissions, as well as offsetting the impact of the emissions we are not yet able to eliminate. Our 2021 Operational GHG Footprint JPMorgan Chase’s 2021 operational GHG emissions were driven by two primary activities: powering our buildings (e.g., electricity, heating and cooling) and business travel. Scope 1 GHG emissions include those from building operations and company-owned aircraft and vehicles. Scope 2 emissions, from purchased electricity, are the largest driver of our building-related emissions and overall operational GHG footprint. The majority of our business travel-related emissions are Scope 3 emissions from commercially operated air and rail; reimbursed personal vehicle and rental car travel; and hotel stays. A small portion of our business travel emissions are Scope 1 emissions from company-owned aircraft and vehicles. In 2020, we committed to achieve carbon neutrality across our operations annually. This commitment includes Scope 1 (direct) GHG emissions from building operations and company-owned aircraft and vehicles; Scope 2 (indirect) GHG emissions from purchased electricity; and Scope 3 (indirect) GHG emissions associated with business travel. In 2021, we met our carbon-neutral goal for the second year in a row, using carbon offsets to help us achieve neutrality. We are committed to maintaining carbon neutral operations each year going forward. Our strategy to maintain carbon neutral operations is focused on the following: • Improving efficiency. Reducing energy use is our first priority. We continue to undertake a variety of energy efficiency measures – for example, optimizing the use of heating and cooling in our buildings – and to expand their implementation across our operations. • Sourcing renewables. Next, we are focused on installing on-site solar systems at JPMorgan Chase properties and establishing long-term renewable energy procurement agreements (e.g., Power Purchase Agreements and green power supply contracts). We are working to increase the proportion being met with on-site renewable energy and off-site long-term renewable energy contracts to 70% or more by 2025. In 2021, over 20% of our renewable procurement came from these solutions. • Purchasing Energy Attribute Certificates ("EACs") and carbon offsets. To continue to meet our commitment to source renewable energy for 100% of our global power needs annually and address the remainder of our direct and indirect emis - sions, we purchase applicable EACs (e.g., Green-E certified Renewable Energy Certificates ("RECs"), International-RECs) and verified carbon offsets. OUR EMISSIONS REDUCTION PATHWAY To build on our commitment to carbon neutral operations, in 2021 we announced a new target to reduce our Scope 1 and Scope 2 (location-based) emissions by 40% by 2030 versus a 2017 baseline. As of the end of 2021, we had reduced Scope 1 and Scope 2 emissions by approximately 15%. Moving forward, we intend to make further progress by increasing our direct use of renewable energy, upgrading existing heating and cooling systems and optimizing building space. Over time, as we strive to reduce our operational emissions through these measures, we anticipate needing to buy fewer offsets to neutralize our emissions. On our website, you can find more information related to our environmental data . 17 INTRODUCTION ENVIRONMENTAL Advancing Climate and Sustainability Solutions Operational Sustainability SOCIAL GOVERNANCE ESG REPORT APPENDICES
Our Approach to Carbon Offsets Carbon offsets are an important tool that enable companies to support projects that reduce GHG emissions and, in many cases, create valuable social and community co-benefits. At JPMorgan Chase, we purchase offset credits to address emissions that we are unable to abate through efficiency improvements or other measures. We purchase offset credits that have been certified by accredited third parties, which means they are real, additional and independently verified. We also strive to source offset credits that are generated from projects located in areas where JPMorgan Chase has a presence, and that have additional co-benefits. Building Sustainability into Our New Headquarters JPMorgan Chase is currently constructing a new headquarters building to meet the needs of our workforce decades into the future. Reflecting the growing need for healthy and sustainable buildings, the 1,388- foot, 60-story skyscraper is expected to be Manhattan’s first all-electric tower with net zero operational emissions. The design also considers indoor air quality and aims to exceed the highest industry standards in sustainability, health and wellness. In order to strengthen and guide the design and construction process, we have aligned and plan to seek final certification to the Leadership in Energy and Environmental Design ("LEED") Platinum v4. During demolition, we recycled, reused or upcycled 97% of the materials from our previous building, exceeding the LEED Platinum requirement by over 20%. We also utilized flexible and adaptable design strategies to drive embodied carbon reductions by using innovative materials with lower carbon content, planning for circularity at end of life and placing an increased emphasis on minimizing waste. In addition to achieving net zero operational emissions, the new building plans to use several state-of-the-art technologies and systems to boost efficiencies, including: • Intelligent building technology that uses sensors, artificial intelligence ("AI") and machine learning systems to predict, respond and adapt to energy needs. • Advanced water storage and reuse systems to reduce water usage by more than 40% as compared to industry standard. • Triple pane glazing on the facade and automatic solar shades connected to heating, ventilation and air conditioning ("HVAC") systems for greater energy efficiency. The building is expected to contain many occupant health and well-being features, including: 10 • Doubling the amount of outside, fresh air and continuously monitoring air quality to improve the overall health and well- being of employees. • Bringing nature indoors through biophilic design, including wide use of natural plants and healthier furniture and building materials. • Bringing in 30% more daylight and using circadian lighting to minimize the effects of electric light and support a healthier indoor environment, as compared to industry standard. Hig h lights of our emissions reduction efforts in 2021 included the following: • Data center efficiency . Th e Firm continues to drive improvements across its data centers by shifting information technology load to newer, more efficient data centers. We also endeavor to share what we have learned with others. For instance, in October 2021, we joined the Low Carbon Patent Pledge, through which we will share several key patents related to how we efficiently cool and ventilate our data centers, with the aim of helping to speed the transition to low-carbon technology and energy sources. The Firm has long led the industry in terms of patenting intellectual property and works to deepen a culture of innovation across tech, business and operations Firmwide. • Solar expansion. We continue to expand on-site solar power at our corporate office buildings and retail branches across the U.S. As of December 31, 2021, we have added solar installations at nearly 300 retail branches in nine states including Arizona, California, Ohio and New York, among others. Our goal is to complete solar installations at approximately 400 additional branches plus 125 car - ports, totaling over 25 megawatts (MW) of solar capacity. We are also expanding solar installations at our corporate office buildings and expect to deploy approximately 90 MW of additional solar capacity. • 24/7 renewable energy. In 2021, we collaborated with energy provider EDF to power our buildings in the U.K. with renewable energy around the clock. As part of this effort, our electricity consumption in the U.K. will be matched to renewable generation every minute of the day, providing us with approxi - mately 120,000 MWh of renewable electricity each year – enough to power our three million square feet of offices in the U.K., or the equivalent of about 33,000 homes. Promoting Health and Wellness in the Workplace In addition to more traditional environmental considerations, such as energy and water efficiency, health and wellness are important aspects of our sustainable building strategy. When looking at how our buildings can affect the health and well-being of our employees, we prioritize factors such as cleaning and sanitization, air- and water-quality, emergency preparedness and health service resources. As a result of our efforts, in 2021, we maintained the WELL Health-Safety Rating for Facility Operations and Management from the International WELL Building Institute™ for our approximately 6,200 corporate office and retail bank branch locations globally. The WELL Health-Safety Rating is an evidence-based, third-party verified rating focused on operational policies, maintenance protocols, emergency plans and stakeholder engagement strategies to help organizations prioritize the health and safety of their staff, customers, visitors and stakeholders. JPMorgan Chase was the first global financial institution to receive the WELL Health-Safety Rating in 2020. 10 Data points are compared to a typical developer-led, speculative office building. 18 INTRODUCTION ENVIRONMENTAL Advancing Climate and Sustainability Solutions Operational Sustainability SOCIAL GOVERNANCE ESG REPORT APPENDICES
Enhancing Resource Management and Efficiency Responsible resource management is an important part of our sustainability strategy, helping us reduce our impacts while improving efficiency and reducing costs. We are focused on reducing our water and waste footprint, along with appropriately managing the waste we generate. On our website, you can find more information related to our environmental data . We are focused on driving progress in the following areas: • Conserving water. Our target is to reduce water use 20% by 2030, compared to a 2017 baseline. As of the end of 2021, we had reduced water use by over 5%. Across many of our corporate offices and branches, we have already deployed a number of water efficiency measures, including low-flow fixtures, aerators and touch-free faucets. To build on these efforts, we are working to install smart meters across our portfolio that will allow us to collect more accurate and timely water use data. This will help us better monitor and control our water use, and to identify and prioritize further efficiency opportunities. • Reducing office materials and waste. In 2021, we made progress toward our commitment to reduce office paper use b y 90% by 2025, achieving a reduction of over 50% versus our 2017 baseline. We also work to recycle paper, as well as non-paper waste, throughout our buildings and branches where recycling services are available and eco - nomically feasible. In addition, we are working to optimize existing recycling services, expand such services to new locations and explore opportunities to bring composting services to more of our corporate locations with cafete - rias. To further our target of diverting 100% of electronic waste ("e-waste") from landfills, we carefully select ven - dors to dispose of our e-waste responsibly. In 2021 alone, our e-waste program diverted more than 490 metric tons of solid waste, avoiding approximately 3,000 mtCO2e of GHG emissions. • Sourcing responsibly. We recognize that the environmental and social impact of our operations extends to our suppliers’ practices. As such, we seek to do business with suppliers that share our values and commitment to mak - ing a positive impact in the communities where we operate. We partner with our suppliers to assess their sustain - ability programs, develop new internal programs and targets and to foster a culture of sustainability. In 2021, we began to formalize our engagement efforts with key suppliers on their sustainability efforts, including their emis - sions management programs. Through these engagements, we plan to work with key suppliers to disclose their GHG emissions, understand their climate actions and help them build capacity to achieve further carbon reduc - tions. For more information on responsible sourcing, see page 58. Enhancing Our Communities Through Beekeeping Bees are important for a strong food system, economic security and environmental resiliency, yet pollinator health continues to decline. JPMorgan Chase is committed to doing its part to help. Inspired by employee-managed beehives in several of our locations, we established a corporate beekeeping program to expand our reach and impact. In 2021, we installed 20 beehives across six of our corporate offices in New York, New Jersey, Delaware and other locations. These hives helped bring over 750,000 bees into these communities and helped pollinate over 450 different plant species across more than 300 square miles. In 2022, we intend to expand the program to additional locations across the U.S. 19 INTRODUCTION ENVIRONMENTAL Advancing Climate and Sustainability Solutions Operational Sustainability SOCIAL GOVERNANCE ESG REPORT APPENDICES
Social Our Firm’s success is linked to the talent of our employees and the strength of our communities. JPMorgan Chase is investing in our people through all phases of the employee lifecycle, and leveraging our resources and expertise to advance inclusive growth. At the core of these efforts is our commitment to advancing diversity, equity and inclusion ("DEI") and our $30 billion Racial Equity Commitment. We utilize the power of our businesses, combined with philanthropic capital, data-driven insights and policy expertise to work toward a more inclusive, sustainable economy. 2021 Highlights Select Awards and Recognition in 2021 DIVERSITY EQUITY AND INCLUSION • 2021 Top Corporations for Women's Business Enter - prises, Women's Business Enterprise National Council • Best employer list for people with disabilities, CAREERS & the disABLED magazine • JPMorgan Chase recognized as top LGBT+ workplace, Out & Equal Outie Award • Best Companies for Latinos to Work 2021, Latino Leaders HUMAN CAPITAL • World's Most Admired Companies, Fortune • Top Companies 2021, LinkedIn • Deploye d o r committed more than $18 billion toward our five-year $30 billion Racial Equity Commitment • Deployed or committed over $450 million in philanthropic capital globally, of which over $345 million was in grant capital and over $105 million in loan and equity capital • Opened 10 new Community Center Branches, which offer resources for communities that have lacked access to traditional banking, and hired more than 100 Community Managers • Launched Morgan Health, a new business unit focused on improving the quality, efficiency and equity of employer-sponsored healthcare • Launched three new Diversity, Equity and Inclusion Centers of Excellence: Advancing Hispanics and Latinos, the Office of Asian and Pacific Islander Affairs and the Office of LGBT+ Affairs 20
Our Commitment to Racial Equity • Increasing homeownership • Expanding affordable rental housing and support for vit al community institutions • Growing small businesses • Spending more with Black, Hispanic and Latino suppliers • Improving financial health and access to banking • Investing in Minority Depository Institutions and Community Development Financial Institutions • Accelerating investment in employees and building a more diverse and inclusive Workforce By the end of 2021, we had committed or deployed more than $18 billion toward our $30 billion goal. This was largely driven by affordable rental housing preservation and homeownership refinance – areas where we had existing products and processes and could take prompt action to further our efforts. The Firm is building the infrastructure and foundation to make progress on its commitment – and we are taking a thoughtful approach to building long-term, sustainable infrastructure to enable our Firm to accelerate progress and reach more people going forward. There is work still to do – and we know that our dedication to racial equity will extend well beyond the five-year milestone in 2025. We are committed to updating our stakeholders on our progress. FEATURE Structural barriers in the U.S. have created profound racial inequities, which have contributed to a marked and persistent racial wealth gap. These and other inequities are the motivation behind JPMorgan Chase’s $30 billion commitment to help close the racial wealth gap among Black, Hispanic and Latino communities. Informed by data and insights that highlight the challenges and point the way to effective solutions, we are leveraging our resources as a financial institution to direct capital and expand opportunities for Black, Hispanic and Latino communities to build, sustain and pass on wealth. Our five-year commitment, announced in October 2020, brings together our business, policy, data and philanthropic expertise to advance racial equity and promote inclusive growth. It includes lending, equity and philanthropic capital, targeted in key areas: 21 INTRODUCTION ENVIRONMENTAL SOCIAL Feature: Our Commitment to Racial Equity Diversity, Equity & Inclusion Human Capital Inclusive Growth GOVERNANCE ESG REPORT APPENDICES
What We Accomplished So Far 11 11 A note on terminology: All updates related to the Racial Equity Commitment noted below are focused on Black, Hispanic and Latino households, customers, clients and/or communities and that is not restated for each metric. The homeownership and small business goals are incremental units and dollars above an annual baseline that is benchmarked to 2019 business results. Our 2025 Commitment Progress through December 31, 2021 INCREASE HOMEOWNERSHIP • Originate an incremental 40,000 home purchase loans ($8 billion) and refinance an additional 20,000 mortgages ($4 billion) for Black, Hispanic and Latino households. • Home Lending continues to make progress in its lending commitment to Black, Hispanic and Latino communities. • Refinanced 19,000 of the 20,000 incremental loans goal, nearly $5 billion. • Originated nearly 12,000 home purchase loans for Black, Hispanic and Latino households in 2021, totaling more than $4 billion. While the number of units was slightly below 2019 production volume, the firm continues to pace towards originating an incremental 40,000 purchase loans by 2025. • Hired more than 150 Community Home Lending Advisors as part of our newly-established Community and Affordable Home Lending business. EXPAND AFFORDABLE RENTAL HOUSING AND SUPPORT FOR VITAL COMMUNITY INSTITUTIONS • Finance the creation and preservation of 100,000 affordable rental units through $14 billion in new loans, equity investment and other efforts. • Approved funding of approximately $13 billion in loans to help preserve more than 100,000 affordable housing and rental housing units across the U.S. • Created the Community Development Banking Capital Solutions team to offer innovative financing options for affordable housing and community facilities by working with a broad range of capital sources. • Increased Low-Income Housing Tax Credit ("LIHTC") investments by $400 million. • Closed on $76 million of the $500 million commitment to affordable housing preservation funds. • Provide more than $300 million in additional financing to Community Development Financial Institutions ("CDFIs") to support communities that lack access to traditional financing. • Target an additional $100 million in New Markets Tax Credit ("NMTC") investments with a focus on Black-owned or -led projects primarily serving Black populations. • Invest in Vital Community Institutions and Services. • Provided more than $190 million in incremental financing to CDFIs. • Established a new Racial Equity Initiative, which uses NMTC investments to spur growth and inclusion. Since 2020, the Firm has funded $221 million in new projects related to that effort. INVEST IN MINORITY DEPOSITORY INSTITUTIONS AND COMMUNITY DEVELOPMENT FINANCIAL INSTITUTIONS • Invest up to $50 million (later increased to $100 million) –in the form of capital and deposits to Black, Hispanic and Latino-owned or -led Minority Depository Institutions ("MDIs") and CDFIs. • Invested more than $100 million of equity in 15 diverse-owned or -led MDIs and CDFIs that collectively serve more than 89 communities in 19 states and the District of Columbia. 22 INTRODUCTION ENVIRONMENTAL SOCIAL Feature: Our Commitment to Racial Equity Diversity, Equity & Inclusion Human Capital Inclusive Growth GOVERNANCE ESG REPORT APPENDICES
Our 2025 Commitment Progress through December 31, 2021 GROW SMALL BUSINESSES • Provide an additional $2 billion for 15,000 small business loans to Black, Hispanic and Latino communities. • Building the infrastructure and f oundation to help small businesses grow through new programs, products and hiring, including: • Hired 25 diverse senior business consultants to provide free one-on-one coaching for business owners in 14 U.S. cities. • Mentored more than 1,000 small businesses. • Hosted educational events, community workshops and business training sessions with more than 28,000 participants. • Through government relief programs, business owners sought relief and liquidity from the U.S. Small Business Administration ("SBA"), including the Paycheck Protection Program ("PPP") and Economic Injury Disaster Loans ("EIDLs"). While PPP loans are not part of the Firm’s Racial Equity Commitment, JPMorgan Chase was the #1 PPP lender on a dollar basis – over the life of the program, we funded more than 400,000 loans for more than $40 billion. More than 30% of those loans went to businesses in majority-minority census tracts. • While small business lending volume through 2021 is below 2019 levels, the Firm expects to make progress against the $2 billion small business lending commitment in the years ahead. SPEND MORE WITH DIVERSE SUPPLIERS • Spend an additional $750 million with Black, Hispanic and Latino suppliers. • Spent an additional $155 million with 140 Black, Hispanic and Latino suppliers. IMPROVE FINANCIAL HEALTH AND ACCESS TO BANKING • Help one million consumers open low-cost checking or savings accounts by opening branches in underserved communities and increasing marketing to reach more underserved, unbanked or underbanked consumers. • Hire 150 community managers and open new Community Center branches in underserved communities. • Continue to invest in our real estate presence in low-to-moderate income neighborhoods around the country. • Helped customers open more than 200,000 low-cost checking accounts with no overdraft fees. • Opened an additional 10 Community Center branches in low-to-moderate communities, often in urban areas with larger Black, Hispanic and Latino populations. • Opened 47 out of 100 new branches in low-to-moderate income communities, many with larger Black, Hispanic and Latino populations. • Hired more than 100 Community Managers in underserved communities who serve as local ambassadors to build and nurture relationships with community leaders, nonprofit partners and small businesses. BUILD A MORE DIVERSE AND INCLUSIVE WORKFORCE • Build a more equitable and representative workforce and hold executives accountable by incorporating priorities and progress into year-end performance evaluations and compensation decisions for members of the Operating Committee and their direct reports. • Expanded our Accountability Framework to include additional select senior leaders. • Expanded the Diversity, Equity and Inclusion program to create three new employee programs supporting Hispanic and Latino employees, LGBT+ employees and Asian and Pacific Islander employees. • The Firm pledged to hire 4,000 Black students by 2024, and exceeded the total goal this year by hiring 4,192 Black students as interns, fellows and entry-level analysts. PROVIDE PHILANTHROPIC CAPITAL TO ADVANCE INCLUSIVE RECOVERY • Provide $2 billion in philanthropic capital to advance an inclusive economic recovery and support Black, Hispanic and Latino and other underserved communities. • Committed $396 million toward our philanthropic target, which includes grants, low-cost loans and direct equity. 23 INTRODUCTION ENVIRONMENTAL SOCIAL Feature: Our Commitment to Racial Equity Diversity, Equity & Inclusion Human Capital Inclusive Growth GOVERNANCE ESG REPORT APPENDICES
Accountability and Transparency in Meeting Our Commitment We are holding ourselves accountable to achieving our Racial Equity Commitment. We have established a robust reporting and governance process for tracking our commitment and plan to publicly share our progress in future ESG reports. We also announced we intend to retain a third-party to perform an audit of this effort and plan to prepare and publish a report based on the results of the audit by the end of 2022. The Firm’s Community Impact organization serves as the cross- line-of-business group responsible for reviewing and reporting on the activities that align to the Racial Equity Commitment. The governance team consists of: executive owners from each line of business with accountability to both the Chief Executive Officer ("CEO") and the Community Impact team; community teams that are responsible for on-the-ground implementation in partnership with local market leadership teams; and the executive leadership team with CEOs from each line of business. The Public Responsibility Committee of the JPMorgan Chase Board of Directors provides oversight of this work and is briefed periodically on the Firm’s progress. The Firm's Public Engagement team is dedicated to connecting with external stakeholders, including civil rights organizations, consumer policy groups, non-profit organizations, civic leaders, trade associations and diverse chambers of commerce. In addition to ongoing relationship building, the Public Engagement team facilitates the Chase Advisory Panel ("CAP") program, a series of regular conversations between stakeholders and JPMorgan Chase senior executives. The CAP program is grounded in the Firm's commitment to including diverse voices in the development of products, services and approaches, including accountability for racial equity. In 2021, Public Engagement connected with over 200 stakeholders around the Racial Equity Commitment. What’s Next INCREASE HOMEOWNERSHIP Continue our efforts to help expand homeownership for Black, Hispanic and Latino households and, in doing so, help to stabilize and revitalize communities across the country. We will continue to execute and enhance our six-pillar community and affordable strategy focused on enhancing products; increasing our people; expanding our presence, partnerships and promotion; and supporting housing policy reform. The Firm plans to continue prudently expanding Federal Housing Administration ("FHA") lending and supporting policy reforms to the FHA program, including servicing standards. EXPAND AFFORDABLE RENTAL HOUSING Explore innovative financing solutions and work with new public resources to support the development of vital community facilities and new housing for individuals and families earning a wider range of incomes than conventional projects serve. Additionally, the Firm will continue to make data-driven policy recommendations aimed to preserve and increase the availability of and equitable access to affordable housing for renters. GROW SMALL BUSINESSES Plan to further expand access to credit through targeted adjustments to how the Firm evaluates credit applications and introduces new product offerings. The Firm plans to also hire additional senior business consultants and expand the free one-on-one coaching program to additional cities. The Firm plans to also expand the digital lending product more broadly and continue to promote policies that would improve access to capital. IMPROVE FINANCIAL HEALTH AND ACCESS TO BANKING Continue efforts to improve the financial health and resiliency of our customers and communities. The Firm plans to continue to open more branches, including Community Center branches in low-to-moderate income communities, hire additional Community Managers and host more financial health workshops and community events to reach more people across the country. INVEST IN MDIS AND CDFIS Each MDI and CDFI is onboarded as a client and connected to the Firm’s expertise, network and advisory support – including the Firm’s Advancing Black Pathways Fellows and Service Corps volunteers. 24 INTRODUCTION ENVIRONMENTAL SOCIAL Feature: Our Commitment to Racial Equity Diversity, Equity & Inclusion Human Capital Inclusive Growth GOVERNANCE ESG REPORT APPENDICES
Diversity, Equity & Inclusion At JPMorgan Chase, we believe that a talent-driven company is a diverse one. That starts, first and foremost, with fostering an inclusive work environment where our employees are respected, trusted and encouraged to bring their whole selves to work. It also means actively working to incorporate DEI considerations into how we hire and develop our employees, design and deliver our products and services, leverage our purchasing power, invest in our communities, engage on public policy issues and more. We have taken a number of steps to build the infrastructure for our Firm to deliver on our commitment to DEI. This includes developing and implementing a global DEI strategic framework with clear objectives, metrics, controls and accountabilities. We have strengthened and expanded our DEI function, and formalized the ways in which it works to drive progress on DEI matters within our lines of business and into how we serve customers, clients and communities. In short, we are managing and executing on our DEI priorities with rigor and intent, because we know that DEI is an important part of our Firm’s ability to deliver the best solutions for our clients and customers and to be successful in the long term. In addition to making progress toward our Racial Equity Commitment in 2021, we launched three new DEI Centers of Excellence during the year: Advancing Hispanics & Latinos, the Office of Asian & Pacific Islander Affairs and the Office of LGBT+ Affairs. We know there is more work to do, and we are committed to both continuing that work and to being transparent with our stakeholders about our progress. Driving Progress Within our Own Workplace We recognize that our commitment to advance a diverse, equitable and inclusive world starts with how we put that vision into practice inside our own company. We continue to deepen how we incorporate diversity into recruiting, training, developing and retaining our employees, and we are intentional about creating inclusive career pathways within our Firm (read more on page 30). Underpinning all these efforts, we remain focused on fostering an inclusive culture that respects and champions diverse perspectives. 25 INTRODUCTION ENVIRONMENTAL SOCIAL Feature: Our Commitment to Racial Equity Diversity, Equity & Inclusion Human Capital Inclusive Growth GOVERNANCE ESG REPORT APPENDICES
Promotional Data Global Gender Data U.S. Race/Ethnicity Data Men 51% Women 49% White 46% Hispanic 20% Asian 17% Black 14% Other 14 3% TOTAL EMPLOYEES 13 TOTAL EMPLOYEES 15 60% Men 40% Women BOARD OF DIRECTORS 15 BOARD OF DIRECTORS 13 0% 10% Black Other 14 0% Asian 0% Hispanic 90% White OPERATING COMMITTEE 13 0% 0% 5% 11% Black Other 14 Asian Hispanic White 84% SENIOR LEVEL EMPLOYEES , 13 12 5% 1% 11% 6% 77% Black Other 14 Asian Hispanic White 63% Men 37% Women OPERATING COMMITTEE 15 74% Men 26% Women SENIOR LEVEL EMPLOYEES , 15 12 Men Women CAMPUS & INTERNSHIP CLASS 19 52% 48% CAMPUS & INTERNSHIP CLASS 17 37% 63% White Ethnic 18 Additional Data TOTAL EMPLOYEES LGBT+ 16 4% 2% People with disabilities 16 4% 2% Military veterans 16 3% 2% SENIOR LEVEL EMPLOYEES 12 Women 39% Men 61% GLOBAL PROMOTIONS , 20 19 Ethnic 18 47% White 53% U.S. PROMOTIONS , 20 17 12 Senior level employees represents employees with the titles of Managing Director and above. 13 Based on EEO metrics. Presented as a percentage of the respective populations who self-identified race/ethnicity: 96% and 95% of the Firm’s total U.S.-based employees and U.S.-based senior level employees, respectively, and all members of the Operating Committee and the Board of Directors. Information for the Operating Committee includes two members who are based outside of the U.S. 14 Other includes American Indian or Alaskan Native, Native Hawaiian or Other Pacific Islander, and two or more races/ethnicities. 15 Presented as a percentage of the respective populations who self-identified gender: 99% of each of the Firm’s total global employees and global senior level employees, and all members of the Operating Committee and the Board of Directors. 2021 Workforce Composition In connection with its diversity initiatives, the Firm periodically requests that its employees and Board members self-identify based on specified diversity categories. The following presents information on self-identifications as of December 31, 2021. The information according to Equal Employment Opportunity (“EEO”) race/ethnicity categories and gender is based on U.S. and global employees (including campus and internship class) respectively, who self-identified. Race/ethnicity and gender information reflects all members of the Operating Committee and the Board of Directors. Information on LGBT+, veteran, and disability statuses is based on U.S. employees. 16 Presented as a percentage of total U.S.-based employees and total U.S.-based senior level employees, respectively. 17 Based on EEO metrics. Presented as a percentage of the respective U.S.-based populations who self-identified race/ethnicity. 18 Ethnic is defined as all EEO classifications other than White. 19 Presented as a percentage of the respective global populations who self-identified gender. 20 Represents employees with the titles of Vice President and above. 26 INTRODUCTION ENVIRONMENTAL SOCIAL Feature: Our Commitment to Racial Equity Diversity, Equity & Inclusion Human Capital Inclusive Growth GOVERNANCE ESG REPORT APPENDICES
ACCOUNTABILITY FRAMEWORK Executing on our DEI commitments requires promoting accountability across our Firm. Our Accountability Framework, which was launched in 2020 and enhanced in 2021, is used to evaluate senior leaders, including Operating Committee members, on behaviors, practices and progress toward goals related to the Firm’s diversity, equity and inclusion priorities, and to incorporate that into year-end performance and compensation assessments. The framework includes a scorecard for tracking progress toward representation goals. CULTURE OF RESPECT, EQUITY AND INCLUSION Across our Firm, we continually work to create and reinforce a culture of respect, equity and inclusion, in which our employees are empowered to be their true selves. We do so by creating forums for employee engagement, initiatives to advance inclusion and elevate diverse perspectives, and education and training programs designed to identify ways that all of our people can contribute to an inclusive culture. Our Business Resource Groups ("BRGs") are an important part of how we do this. Our BRGs are inclusive groups that enable employees to share ideas, grow professionally and connect to colleagues who have similar interests. Recognizing the intersectionality of the different groups represented by our BRGs, we are taking steps to promote and facilitate cross-BRG collaboration. Our Firm currently has ten global BRGs and, at the end of 2021, approximately 48% of our employees across 54 countries were a member of at least one. See page 33 for the list of JPMorgan Chase BRGs. Our Asian, Black, Hispanic and LGBT+ Executive Forums, which bring together the senior leaders of these communities to act as ambassadors and thought leaders for Firmwide initiatives, are another way we support and foster diversity, equity and inclusion within our Firm. We continually work to promote a culture of respect that allows every employee to feel safe and empowered at work. Our Equal Opportunity, Anti-Discrimination and Anti-Harassment Statement sets forth our policies and expectations for our employees, and all employees (including both full-time and part-time employees) are required to take anti-harassment awareness training. In addition, in 2021, our employees completed mandatory, Firmwide diversity and inclusion training programs, including You Belong Here, Culture of Respect and Journey to Inclusive Teams for managers. DEI Centers of Excellence Our Firm has established DEI Centers of Excellence to take a unified and intersectional approach to delivering impact for employees, clients, customers and the communities we serve. The Centers of Excellence play an important role in supporting the Firm’s commitments to advance equity and create lasting impact both internally and externally, leading our global strategies related to target populations and contributes to progress toward our Racial Equity Commitment. The Centers of Excellence also collaborate across their respective efforts to reflect the intersectionality of the different communities they represent. In addition to coordinating programs and initiatives to strengthen our internal culture of inclusion and raise the visibility of their communities, the Centers of Excellence amplify our lines of business’ work to deliver inclusive products, services and advice for clients and customers. They also work with a wide array of local and national organizations in the communities we serve, leveraging our Firm’s business expertise and philanthropic resources to help advance racial equity and economic empowerment. Our seven Centers of Excellence are: ADVANCING BLACK PATHWAYS Launched in 2019, Advancing Black Pathways ("ABP") is working to help the Black community chart stronger paths towards economic success and empowerment. It is focused on advancing career opportunities for Black talent, expanding and supporting Black-owned businesses, and improving financial health in Black communities. The ABP Fellowship program is aimed at helping Black college undergraduates get on a path to internships and entry-level roles with the Firm after graduation. In 2021, we grew the program to 169 students, up from 74 in 2020. Nearly 90% of the 2021 Fellows went on to accept internship offers with our Firm. During the year, the Firm also expanded our Historically Black Colleges and Universities ("HBCU") partnerships to 14 HBCUs across the country. These relationships include recruitment activities to expand career pathways for students (see page 30), as well as programs that support long-term student development and financial health. In 2021, these programs reached more than 6,000 HBCU students. Also in 2021, ABP launched a mentoring circles program, in collaboration with our Black Executive Forum and BOLD BRG. Through the program, Managing Directors provide career coaching and mentorship to more junior employees. Over 600 mentees enrolled in 2021. ABP’s goal is to drive diversity, equity and inclusion within the Firm and beyond, including an effort to diversify board rooms at public companies. As part of this effort, ABP referred 75 board-ready candidates to JPMorgan’s Director Advisory Services program, which offers a curated, referral-based platform of independent director candidates to our corporate clients. 27 INTRODUCTION ENVIRONMENTAL SOCIAL Feature: Our Commitment to Racial Equity Diversity, Equity & Inclusion Human Capital Inclusive Growth GOVERNANCE ESG REPORT APPENDICES
ADVANCING HISPANICS AND LATINOS Advancing Hispanics & Latinos ("AHL") was established in 2021 to advance the growth and success of Hispanic and Latino communities across the globe. Our efforts are focused on advancing career opportunities, financial health and community development for Hispanics and Latinos globally. In 2021, AHL prepared to launch the 2022 Fellowship Program, expanding fellowship opportunities offered by the Firm to Hispanic and Latino students. In November 2021, AHL aligned with the Latin GRAMMY Cultural Foundation with a plan to deliver financial health education to 200 students in select Racial Equity Commitment cities and made a contribution to support fellowship opportunities in the U.S. for music students across Latin America. The Firm has also committed up to $20 million to L’ATTITUDE Ventures, a venture fund that invests exclusively in early-stage Latino-led and -owned technology- oriented businesses with high-growth potential. Additionally, AHL and ABP partnered to develop an internal, searchable database of Black-, Hispanic- and Latino-owned suppliers to facilitate increased spend with diverse-owned businesses. MILITARY AND VETERANS AFFAIRS Even before JPMorgan Chase established The Office of Military and Veterans Affairs in 2011, our Firm has consistently worked to honor those who have served and support their long-term success. Our efforts are focused on attracting, retaining and developing diverse veteran talent; supporting veteran-owned businesses and entrepreneurs; increasing the financial health of veterans and military families; and supporting top veteran service organizations. JPMorgan Chase hired more than 1,200 U.S. veterans into our company in 2021, bringing the total number of veterans we have hired since 2011 to more than 17,000. The Military Pathways Development Program works across all lines of business to offer two specialized pathways for recently transitioned veterans, which provide entry to the Firm, a defined network of veteran peers and programmatic support to promote career success. In 2021, we also created “CEOcircle,” in collaboration with Bunker Labs, which provides veterans, active-duty service members and military family members who are founders or executives the opportunity to advance their businesses. The no-fee, year-long program includes peer-to- peer networking, in-person sessions and a ten-week mentorship program with JPMorgan Chase. The inaugural cohort included 43 entrepreneurs from a range of industries. During the year, we also began building a pilot financial health education program tailored to the unique needs of military families. OFFICE OF ASIAN & PACIFIC ISLANDER AFFAIRS Established in late 2021, the Office of Asian & Pacific Islander ("API") Affairs leads the execution of global programs and initiatives for the Asian and Pacific Islander community. The Asian Executive Forum serves as a collective voice for the API community within the Firm, and works in partnership with the AsPIRE business resource group to drive equity and inclusion for API employees across the Firm. Following a series of attacks against the API community in the U.S. and U.K. in 2021, the Firm committed $1 million to raise awareness of the urgent need to support the API community. API has also partnered with Women on the Move around career advancement programs. OFFICE OF DISABILITY INCLUSION Office of Disability Inclusion ("ODI"), created in 2016, leads strategy and initiatives worldwide aimed at advancing careers and an inclusive workplace, providing a supportive environment for people with disabilities, and helps the Firm strive to be a bank of choice for customers with disabilities. In 2021, ODI launched a global, 24/7 help desk for employees with disabilities, dedicated solely to delivering assistive technology to employees with disabilities. Automated Zoom closed captioning on demand was also introduced to make the Firm’s daily Zoom meetings more accessible for employees. ODI expanded the Firm's centralized process for requesting reasonable accommodations, My Accessibility Hub, to employees in India, after first rolling out to employees in the U.S. and the Philippines in 2018. In addition, the Firm worked with the National Disability Institute ("NDI") to secure and service a $2.5 million grant from the U.S. Small Business Administration for a Community Navigator Pilot Program in Washington, D.C. As a preferred SBA lender, JPMorgan Chase plans to work with NDI and the SBA to improve access to SBA-funded and other resources for small business owners and entrepreneurs with disabilities. 28 INTRODUCTION ENVIRONMENTAL SOCIAL Feature: Our Commitment to Racial Equity Diversity, Equity & Inclusion Human Capital Inclusive Growth GOVERNANCE ESG REPORT APPENDICES
OFFICE OF LGBT+ AFFAIRS Building on the Firm’s long-standing support for the LGBT+ community, in 2021 we created the Office of LGBT+ Affairs focused on advancing careers and a culture of inclusion, supporting LGBT+ owned businesses, providing financial health awareness and education and driving progress on equity and inclusion for the LGBT+ community globally. For our LGBT+ employees, we are focused on full-cycle talent management, accountability and best-in- class policies, practices and benefits, with an equal focus on allyship and intersectionality. In 2021, we greatly advanced representation, increasing LGBT+ self-identification by 50% year-over-year globally and expanding membership and engagement in the LGBT+ Executive Forum, a consortium of senior leaders who self-identify as LGBT+ and serve as advocates for the LGBT+ community, by 85% to over 370 LGBT+ Managing Directors and Executive Directors. LGBT+ Affairs made a $5 million philanthropic commitment, $1 million to each of five U.S. nonprofits, to support their efforts to drive economic inclusion for LGBT+ youth, workforce and elder communities. We also made a $500,000 commitment to StartOut for the expansion of their Pride U.S. Economic Inclusion Index, providing insights for LGBT+ and other diverse entrepreneurs, as well as $250,000 of additional LGBT+ focused grants and sponsorships globally, including in the U.K., Philippines, Argentina and India. WOMEN ON THE MOVE JPMorgan Chase has long focused on the empowerment and advancement of our women employees. Launched as a grassroots employee effort in 2013, Women on the Move ("WOTM") became a formal team in 2018 dedicated to helping women inside and outside of the Firm. WOTM focuses on three strategic pillars: expand women-run businesses, improve women's financial health and empower women's career growth. In 2021, WOTM launched Curated Coaching for Entrepreneurs, which provides free, one-on-one coaching for women small business owners. Through the program, we connect entrepreneurs – whether or not they are a Chase customer – with business experts from a woman-founded, woman-led business advisory firm. We served more than 700 women small business owners through the program in 2021. We also launched a collaboration with the Techstars to create the Founder Catalyst Program, which provides pre-accelerator startup education and mentorship to women entrepreneurs. We trained one cohort of women founders in Atlanta in 2021 and will continue with another cohort of 20 women in the Washington, DC area in 2022. Through our Careers and Skills programming, we engaged more than 7,000 female employees across all levels and geographies through our Women on the Move Fast Forward career development program, and another 1,200 employees through a newly-launched career development program targeting Vice President and Associate level employees. 29 INTRODUCTION ENVIRONMENTAL SOCIAL Feature: Our Commitment to Racial Equity Diversity, Equity & Inclusion Human Capital Inclusive Growth GOVERNANCE ESG REPORT APPENDICES
Human Capital At JPMorgan Chase, our people drive our success in serving our customers, clients and communities. Our human capital strategy is focused on attracting, developing and retaining the diverse talent we need to advance our business today and into the future. We invest across the employee life cycle – from recruiting and employee development to engagement, compensation and benefits – to build a diverse team and inclusive culture where our employees across the globe are welcomed, valued and able to bring their full selves and best work forward. Attracting the Best People We strive to attract and recruit the best talent for all roles across the Firm. Our goal is to maintain a diverse and inclusive workforce reflective of the communities we serve, and we are focused on hiring talent with a wide range of characteristics – including diversity related to gender, ethnicity, military service, LGBT+ status and disabilities, as well as diverse perspectives and skill sets. To find and select a diverse pool of talented candidates, we are committed to sourcing from underrepresented communities and establishing strategic partnerships and programs to create new pathways for candidates with less traditional backgrounds. Diverse slates are an important consideration in our comprehensive recruiting efforts and are tracked and monitored by the Firm. In hiring new employees, managers and recruiters are expected to consider a diverse slate of candidates. Diverse slates are defined – in the U.S. – as no less than one woman and one ethnically diverse candidate (defined as Equal Employment Opportunity Commission classifications other than White) and – outside the U.S. – as including no less than one woman. EARLY CAREER TALENT A robust pipeline of diverse talent at entry levels is essential to creating a representative workforce – and ensuring our Firm has access to a broad pool of talent to meet our long-term needs. We have a competitive recruiting program which includes summer internships, apprenticeships and full-time hiring. We focus on expanding diversity in our traditional internship programs and operate more than 70 Emerging Talent Programs globally that specifically focus on recruiting people who are often underrepresented in typical talent channels. 2021 Early Career Recruitment Program Highlights 21 21 Information on EEO race/ethnicity categories, gender, LGBT+, veteran status and disability status is based on self-identification and self-disclosure. Unless otherwise indicated, information on EEO race/ethnicity is presented as a percentage of the respective U.S.-based population who self-identified race/ethnicity and information on gender is presented as a percentage of the respective global population who self-identified gender; information on LGBT+, veteran status and disability status is presented as a percentage of the respective total U.S.-based population. 30 INTRODUCTION ENVIRONMENTAL SOCIAL Feature: Our Commitment to Racial Equity Diversity, Equity & Inclusion Human Capital Inclusive Growth GOVERNANCE ESG REPORT APPENDICES Nearly 3,000 summer interns 50% of 2021 intern class were women, globally 62% of 2021 intern class in the U.S. identified as Black, Hispanic or Asian 1,000 hires through 43 Emerging Talent programs that focus on diverse candidates More than 270 early career software engineer hires recruited from educational pipelines outside of a traditional degree path 4,192 Black students hired as apprentices, interns and full-time analysts since establishing our goal in 2019 to hire 4,000 Black students by 2024, putting us ahead of our goal three years into our five-year target 111 apprentices hired through our degree apprenticeship program in the U.K, which provides an entryway into the Firm for candidates from high school and an opportunity to study for a college degree at no cost them while working and earning a salary. The program attracts students from economically disadvantaged backgrounds Nearly 200 hires through Emerging Talent Apprenticeship programs, up 50% from 2020
Partnering with Historically Black Colleges and Universities In 2021, we expanded our partnerships with HBCUs across the U.S., with a focus on deepening our campus and hiring pipeline relationships, as well as supporting student development and financial health programs for long-term student success (see page 37). As one part of this, we launched the J.P. Morgan Wealth Management HBCU Scholarship Program for students interested in the financial planning profession. Students receiving the scholarship will gain access to two summer internship experiences: the Advancing Black Pathways Fellowship Program (see page 37) and the J.P. Morgan Wealth Management Service Center Internship. Upon completion, students will also be eligible for an additional scholarship to be applied to their senior year. Through this program, J.P. Morgan Wealth Management plans to award 75 scholarships annually over the next five years, as well as provide training and licensing support. Additionally, in 2021, J.P. Morgan Wealth Management set a target to hire 300 additional Black and Latino advisors by 2025 through a combination of scholarships, internships, mentoring experiences and internal mobility efforts. EXPERIENCED TALENT Our Firm also continues to focus on broadening the experienced applicant pool for opportunities within our Firm. For example, where appropriate, we are expanding the number of jobs we post for experienced hires in the U.S. that focus on skills rather than educational degrees. We also actively reduce barriers to employment at our Firm for individuals with criminal backgrounds through our Second Chance program (see page 39). 22 Information on EEO race/ethnicity categories, gender, LGBT+, veteran status and disability status is based on self-identification and self-disclosure. Unless otherwise indicated, information on EEO race/ethnicity is presented as a percentage of the respective U.S.-based population who self-identified race/ethnicity and information on gender is presented as a percentage of the respective global population who self-identified gender; information on LGBT+, veteran status and disability status is presented as a percentage of the respective total U.S.-based population. Future Talent Pipeline Programs Our pipeline programs are focused not just on who we might hire today, but also on helping young people develop the skills and experience that will enable them to compete for jobs at our Firm – and others – when they enter the workforce in the future. In 2021, we engaged approximately 7,400 participants through these Future Pipeline programs. These programs offer young people exposure to professions and skills relevant to our Firm, provide broad opportunities for skills development and help students be better prepared for recruiting processes at our Firm and similar ones. In May 2021, we launched a “Girls Who Code Work Prep” program to introduce participants to careers at JPMorgan Chase. Of 50 young women who participated, more than half went on to apply to a 2022 internship at our Firm. We also launched the Think Ahead program in 2021, which offers high school students a chance to experience financial career options at our London office, with a particular focus on recruiting students from a low-income background into the program. 2021 Experienced Talent Hiring Highlights 22 31 INTRODUCTION ENVIRONMENTAL SOCIAL Feature: Our Commitment to Racial Equity Diversity, Equity & Inclusion Human Capital Inclusive Growth GOVERNANCE ESG REPORT APPENDICES Approximately 75% of jobs posted for experienced hires did not require a bachelor’s degree, focusing on skills over educational degrees Over 17,000 U.S. veteran hires since 2011, including more than 1,200 in 2021, 58% of whom self-identified as being ethnically diverse Approximately 10% of our new hires in the U.S. have criminal histories 16% of external hires for technology-focused positions were women, an increase of 5% from 2020 More than 350 participants in our ReEntry program since 2013, which focuses on accomplished career professionals who have taken a voluntary career break for two or more years
Investing in Employee Development Helping our employees advance their skills and professional development is important to our human capital strategy. We invest in our employees’ development through a robust suite of training, leadership development, upskilling and reskilling programs, mentorship initiatives and performance evaluations. TRAINING We train our employees with the skills needed for today and tomorrow. In 2021, employees completed over 10 million courses and over eight million hours of training. Training efforts include mandatory curricula for new hires and existing employees, along with a range of programs focused on topics from leadership development and technology to risk and compliance and business processes. All employees are required to take annual training on our Code of Conduct (see page 57), as well as courses related to DEI, anti-money laundering, privacy and data protection, cybersecurity and anti-corruption. LEADERSHIP DEVELOPMENT Our global leadership development Center of Excellence, Leadership Edge, is focused on creating one leadership culture and helping managers become better leaders every day. More than 100,000 leaders and managers have participated since the program launched in 2015, including 14,000 in 2021. We also continued to expand the Manager Excellence framework, which defines effective and inclusive leadership. This includes designing learning specifically tailored to manager capabilities, such as driving performance, prioritizing diversity, equity & inclusion and guiding careers. UPSKILLING AND RESKILLING Upskilling and reskilling our existing employees – who already know our culture and are committed to our company – is an effective and efficient way to have the talent we need to compete and thrive now and into the future. Just as importantly, it is one of the best ways we can advance our commitment to diversity, equity and inclusion. For example, our Firm’s front-line and entry-level employees, whose roles are most likely to be affected by technological disruption, disproportionately identify as women and diverse employees. By taking proactive steps to create meaningful and accessible opportunities for career mobility, we can mitigate the risk of losing legacy talent, and continue our efforts towards a more diverse and representative workforce. In 2021, approximately one-third of all positions were filled with internal candidates, including nearly 30% of senior- level positions. In order to help employees understand the skills they need to advance their careers at the Firm, and identify relevant training opportunities, we expanded communication of skill requirements for over 350 Technology, Operations and Branch job profiles covering over half of our employees. We also offer programs to help employees develop tailored learning journeys based on aspirational roles in their career development plans. In 2021, these learning journeys were made available for approximately 42,000 employees. We further support employee development with education benefits. In 2021, JPMorgan Chase expanded these offerings in North America with access to over 400 bachelors, masters and certification programs, as well as partnering with our education providers to deliver programs that are designed to prepare employees for new jobs in growing roles at the Firm. Of the nearly 6,000 employees in North America who enrolled in our education benefits in 2021, 76% are associate level or below, 51% are women, 58% identify as ethnically diverse and 23% of participants had already experienced upward career growth during the year. In 2021, we also continued to maintain a focus on our talent management and succession planning process. The human resources team actively engages with senior leaders to discuss key talent, internal succession and the development of our leadership pipeline. PERFORMANCE EVALUATIONS We use an annual Firmwide performance review process to help employees grow and to evaluate how they support our culture, business success and employee engagement and development. Employees are assessed across four core dimensions: business results; client, customer and stakeholder; teamwork and leadership; and risks, controls and conduct. 32 INTRODUCTION ENVIRONMENTAL SOCIAL Feature: Our Commitment to Racial Equity Diversity, Equity & Inclusion Human Capital Inclusive Growth GOVERNANCE ESG REPORT APPENDICES
FOSTERING EMPLOYEE ENGAGEMENT AND SATISFACTION Providing a first-class employee experience is important to our human capital strategy. This includes engaging our employees in strengthening our culture and business, and listening and responding to their experiences and ideas. We also support employees’ drive to help strengthen their communities by facilitating skills-based volunteering opportunities. Our annual employee engagement survey, the results of which are reviewed by senior leadership for potential program improvements, was expanded to have a deeper focus on inclusion. In 2021, 87% of employees participated in this survey. Support and Allyship for Diverse Employee Populations BRGs are one way we engage and support our employees in helping us build a diverse and equitable culture in which everyone feels welcome (see page 27). We have 10 BRGs with employee members across 54 countries, and approximately 48% of our employees are a member of at least one BRG. They include: Skills-Based Volunteerism Through skills-based volunteering programs, we support our employees’ desire to help their communities and further our philanthropic mission, while providing opportunities for them to apply and expand their skills. Service Corps engaged more than 275 employees globally in 2021 to address specific organizational challenges and opportunities for nonprofits. A similar program deploys employees to support minority-led small businesses through the Founders Forward program. In 2021, 332 JPMorgan Chase employees used their skills to help small business owners grow their businesses and networks. In addition, our career mentorship programs have allowed us to connect more than 1,200 employees with youth, helping to set them on a path toward future career endeavors. Finally, serving on a nonprofit board is one of the most significant commitments our employees make. Our Board Service program has trained and placed more than 110 employees on nonprofit boards across the U.S. in the last year. In addition, our Board Match program has provided financial support to nonprofits with qualifying employees serving on the board. Another of our social innovation and skill-based volunteerism programs is Force for Good which connects team of JPMorgan Chase technology and data employees to build scalable and sustainable tech-based solutions for nonprofits around the world. Through this program, we empower our employees to use their technology skills to make a positive impact on communities and help build the next generation of technology talent. In 2021, almost 1,300 JPMorgan Chase employees built tech-based solutions for approximately 200 nonprofits across five global regions, impacting more than one million constituents and addressing issues including hunger, access to education, lack of shelter, animal welfare, climate change and gender rights. In addition to BRGs, we have seven dedicated Centers of Excellence that drive programs and initiatives to strengthen our internal culture of inclusion and raise the visibility of our communities. The Centers of Excellence include Advancing Black Pathways, Advancing Hispanics and Latinos, Military and Veterans Affairs, Office of Asian & Pacific Islander Affairs, Office of Disability Inclusion, Office of LGBT+ Affairs, and Women on the Move (see page 27). • Access Ability : Maximizing the contributions of employees affected by disabilities, long- term illness or care giving responsibilities. • Adelante: Empowering Hispanic and Latino employees to identify and pursue opportu - nities for career development and commu - nity involvement. • Aspire: Enhancing the professional develop - ment and leadership opportunities of employ - ees of Asian and Pacific Islander heritage. • BOLD: Providing employees, specifically those of African descent, with an empower - ing environment that focuses on profes - sional and personal development. • NEXTGEN: Engaging early career profes - sionals to network, build relationships across all business levels and groups, and promote career development. • PRIDE: Engaging and supporting Lesbian, Gay, Bisexual and Transgender employees, and Allies and management, in promoting an inclusive environment. • Sage: Encouraging and remaining committed to personal and professional development, while sharing valuable information. • VETS: Identifying and advocating for opportunities that will keep the Firm as an industry leader while deepening its commitment to veteran families. • WOTM: Providing a collaborative forum and access to tools that support the successful reten - tion, development and advancement of women at all levels of the Firm. • Working Families Network: Promoting knowledge sharing and providing networking opportunities to support employees with work and family inte - gration; open to all employees in EMEA and APAC. 33 INTRODUCTION ENVIRONMENTAL SOCIAL Feature: Our Commitment to Racial Equity Diversity, Equity & Inclusion Human Capital Inclusive Growth GOVERNANCE ESG REPORT APPENDICES
Supporting and Rewarding Our People Our compensation and benefits programs focus on supporting the needs of our employees and their families, promoting employee well-being and engagement and building our culture of inclusion and equity. Our compensation philosophy provides the guiding principles that drive compensation-related decisions across all levels of the Firm. We believe our compensation philosophy promotes an equitable and well-governed approach to compensation, which includes pay-for-performance practices that attract and retain top talent in a competitive market, is responsive to and aligned with shareholders, reinforces our culture and Business Principles and integrates risk, controls and conduct considerations. We offer extensive benefits and wellness packages to our employees and their families, including health care coverage, retirement benefits, life and disability insurance, on-site health and wellness centers, employee assistance programs, competitive vacation and leave policies, backup childcare arrangements, tuition reimbursement programs, mental health counseling and support, financial coaching, and more. We direct our benefits spend toward lower-wage earners, including providing higher insurance subsidies and lower deductibles in the medical plan and a $750 special award in 2021 to employees earning less than $60,000. PAY EQUIT Y We are committed to equitable compensation for our employees. We conduct periodic pay equity reviews covering employees at all levels within the Firm. In 2021, taking into account factors such as an employee's role, tenure, seniority and geography, in aggregate, those who self identified as women globally were paid 99% of what men were paid. In the U.S., ethnically diverse employees who self-identified as other than White under EEO Commission classifications, were paid as a group comparably to what White employees were paid, taking into account factors such as an employee’s role, tenure, seniority and geography. Pay equity reviews give us important insights, but they are just a starting point. If we identify individuals with compensation that is less than expected, we dig deeper. Where appropriate, we take action to address it. We are proud of the overall diversity of our workforce. However, we also know that women and ethnically diverse employees still are not represented in as many senior management positions as are men and White employees. We are taking a variety of actions focused on hiring, retaining, developing and advancing women and ethnically diverse employees, especially at more senior levels. FINANCIAL HEALTH PROGRAMS We believe that financial health is an important part of people’s overall well-being, and we offer a wide range of benefits and programs to help employees build a financially secure future. For example, in 2021, we implemented a new program for U.S. employees that includes a financial wellness assessment, educational resources and unlimited access to financial coaching with certified financial planners paid for by the Firm. We also continue to increase wages for our full- and part-time U.S. hourly paid employees. As of September 2021, we raised minimum base pay for U.S. overtime-eligible employees to between $18 and $22 per hour, depending on the local cost of living. This is in addition to the benefits package the Firm offers that is valued, on average, at approximately $14,500 per employee for this population. We also offer retirement benefits including 401(k) matches in the U.S. and other types of retirement plans in other countries. Well-Being and Work Life Balance At JPMorgan Chase, we support employees’ well-being and work life balance through a range of programs and benefits. HEALTH PROGRAMS We offer healthcare benefits for employees and their families. In 2021, we covered approximately $1.5 billion in medical costs for employees and their families. We also encourage our employees to focus on their well-being and make healthy choices a priority. For example, we offer biometric wellness screening and online wellness assessments for employees and their covered spouses/domestic partners. In 2021, over 80% of enrolled employees and over 70% of enrolled spouses/domestic partners completed both of these assessments in 2021. Additionally, we have onsite Health and Wellness Centers in 25 U.S. locations and 37 onsite health clinics across our other global locations. In 2021, these centers played a central role in our COVID-19 response efforts. We are also focused on supporting our employees’ mental health. We are committed to building a workplace that increases awareness of mental health, educates employees and provides support when people need it. All employees have access to confidential counseling and support through our Employee Assistance Program. In 2021, we continued expanding mental health support related to the COVID-19 pandemic. 34 INTRODUCTION ENVIRONMENTAL SOCIAL Feature: Our Commitment to Racial Equity Diversity, Equity & Inclusion Human Capital Inclusive Growth GOVERNANCE ESG REPORT APPENDICES
IMPROVING EMPLOYER-SPONSORED HEALTHCARE In 2021, we launched Morgan Health, a new business unit, to help innovate and improve employer-sponsored healthcare. The U.S. health care system continues to fall short of meeting expectations. Health care costs continue to rise -average premiums for family coverage have increased 22% since 2016- for both employers and employees, with no evidence that outcomes are improving. Only 46% of adults with private insurance have their blood pressure controlled, and that number has declined in the last 10 years. Morgan Health has an opportunity to deliver and scale new healthcare models that improve the quality, equity and affordability of employer-sponsored healthcare and is focused on connecting health care to improved health outcomes for our employees. To do so, Morgan Health is investing $250 million to accelerate the development and delivery of accountable care, completing in 2021 its first $50 million investment in Vera Whole Health (which subsequently merged with Castlight) with plans to deploy these services to our employees in Columbus, Ohio, in 2022. Morgan Health completed another investment in health care analytics company Embold Health in March 2022, which will help facilitate how consumers access the highest-quality care available. We are also working toward providing equal access to equal healthcare, regardless of race, income or other personal characteristics for our employees and in the communities we serve. Addressing inequities in health care is fundamental to Morgan Health’s strategy, and through our work with Kaiser Permanente in California, we are moving forward quickly on a collaborative effort focused on the collection and reporting of health equity performance metrics. SUPPORTING FAMILIES Supporting working families is an important element of how we support our employees, including providing time away from work for when people need it. The Firm provides all U.S.-based employees with paid sick leave each year, up to 96 hours per year depending on local laws. We also provide most full- time and part-time employees three to five weeks of paid vacation annually. We continue to offer employees eight hours of paid time annually to volunteer in their communities. We offer paid parental and adoption leave. In the U.S., this includes 16 weeks of fully paid parental leave for employees who are primary parental caregivers and six fully paid weeks for non-primary parental caregivers following the child’s birth, adoption placement or foster placement with intent to adopt. We also provide family-building assistance to help employees with the high costs of adoption, surrogacy and fertility expenses, including up to $10,000 per child in eligible adoption expenses and up to a $30,000 lifetime maximum for surrogacy and fertility expenses. In addition, we provide backup childcare in many markets and other assistance to working parents. We significantly expanded child care support in response to the pandemic. We also provide resources to help employees navigate decisions about elder care and education choices. SUPPORTING EMPLOYEES DURING THE COVID-19 PANDEMIC In 2021, we continued to update and enhance safety protocols and support based on evolving best practices and employee needs. A key area of focus was supporting employees in getting vaccinated. Since 2021, we have facilitated the delivery of over 70,000 vaccine and/or booster doses to employees and their families globally. To further support employees in getting vaccinated, we provided eight additional hours of paid time off for employees to get initial vaccines and four hours of additional paid time off for vaccine booster shots. We also ran an educational campaign featuring 15 events with over 30 medical doctors and industry experts who discussed the importance of vaccines and addressed employee questions. These events, developed in partnership with our Business Resource Groups, brought in diverse speakers to help address vaccine hesitancy in various communities and populations. Throughout the pandemic, we made COVID-19 diagnostic tests more accessible and available at no cost to U.S. employees and their eligible dependents by offering at-home self-administered tests, plus onsite and near-site testing options in select locations. We continued to adapt and expand mental health and well-being support for employees in response to the increased stresses caused by the pandemic including hosting virtual forums with mental health clinicians. 35 INTRODUCTION ENVIRONMENTAL SOCIAL Feature: Our Commitment to Racial Equity Diversity, Equity & Inclusion Human Capital Inclusive Growth GOVERNANCE ESG REPORT APPENDICES
Inclusive Growth Our Firm believes that business, in partnership with government and community leaders, has a role to play in helping everyone have the chance to participate and share in the rewards of economic growth. We are only as strong as the communities we serve, and the economies they support. Our efforts to help build a more inclusive economy are focused where we can leverage our business and expertise to create meaningful impact: • Building careers and skills • Fueling business growth and entrepreneurship • Catalyzing community development • Strengthening financial health and wealth creation We are bringing the reach and expertise of our Firm to tackle these challenges, using the power of our businesses, combined with philanthropic capital, data-driven insights and policy expertise. Underpinning and informing all these efforts is our Firm’s commitment to DEI. How our Firm is Making an Impact Lending and investment capital Philanthropic capital Policy expertise Data insights and analytics Innovative Finance Solutions Through a dedicated pool of proprietary capital, our Firm is helping fill the gap between philanthropic and market-rate capital to lend to and invest in organizations and projects that advance inclusive growth. These efforts include support for diverse-led organizations and those that serve communities of color. This approach helps our Firm to reinvest returned capital in communities to attract additional capital. Through this effort, JPMorgan Chase provides long-term, low-cost loans to mission-driven financial intermediaries, such as CDFIs. In addition, we are making equity investments in funds and early-stage, mission-driven companies that advance the Firm’s impact objectives. In 2021, we closed 13 such transactions totaling over $100 million, which supported efforts ranging from affordable housing and small business development to platforms to upskill workers and help college students graduate. Skills and talents of our employees Research and Policy Solutions Our Firm’s expertise, data and research capabilities make us well positioned to provide insight into consumer behavior and the economy – and we put that insight to work to advance policy solutions that drive inclusive growth and help advance racial and economic equity. The JPMorgan Chase Institute is a think tank dedicated to leveraging the Firm’s data to produce insights on the inner workings of the economy and important policy questions. The JPMorgan Chase Policy Center develops and advances sustainable, evidence-based policy solutions to expand inclusive economic opportunity. The Policy Center works with policy, business and community leaders to advance effective solutions at all levels of government. In early 2021, for example, as decision-makers continued to assess policies and programs to support households and small businesses facing economic hardship due to the pandemic, our Firm released T he First 100 Days and Beyond . The report highlighted research from the JPMorgan Chase Institute and the work of the JPMorgan Chase Policy Center to inform data-driven recovery policies to provide immediate support to those most impacted by the pandemic in the U.S., as well as longer-term policies to increase the financial health and stability of households and small businesses. In addition, as the Firm advances the objectives of our Racial Equity Commitment, we are drawing on the work of the Institute and Policy Center to develop and promote data-driven public policies that bolster an inclusive recovery and advance racial equity. 36 INTRODUCTION ENVIRONMENTAL SOCIAL Feature: Our Commitment to Racial Equity Diversity, Equity & Inclusion Human Capital Inclusive Growth GOVERNANCE ESG REPORT APPENDICES
Building Careers and Skills Technological developments have dramatically changed career pathways, and the pandemic has shined a light on structural barriers that exist in the labor market. In a rapidly evolving economy, our Firm is focused on supporting and developing education, skills training and policy solutions that connect job seekers to well-paying and stable jobs at our Firm and in communities around the world. Building on our efforts to equip workers with in-demand skills, in 2019 we made a $350 million, five-year philanthropic commitment focused on creating economic mobility and career pathways for underserved populations. We are also applying insights from our work in the community to our own hiring, DEI and employee development programs to create more pathways into and across our Firm. This includes identifying certifications, credentials and other training that will prepare employees for changes in technology and business and allow them to compete for new and in-demand roles in our Firm. We are also leveraging local educational institutions to offer employees access to low- or no-cost upskilling and reskilling opportunities that align with those roles and with long-term career goals (learn more on page 32). MENTORING AND WORK EXPERIENCE FOR YOUNG PEOPLE Through The Fellowship Initiative ("TFI"), we provide extensive and hands-on academic, social and emotional support to young men of color in high school. Since launching TFI in 2010 in Chicago and New York and through the end of 2021, we have matched more than 350 high school Fellows with JPMorgan Chase employees, who serve as mentors for about three years. The mentors engage the Fellows in academic and project-based learning activities, college and career planning and leadership development opportunities, all with the goal of helping the Fellows successfully complete high school and prepare for post-secondary pathways. The program has contributed to a 100% admission rate to college among graduating Fellows. In 2020, we committed to grow the program to 1,000 Fellows nationally over the next 10 years – and in 2021, we made progress toward that goal by expanding the initiative to Houston, Oakland, and Washington, D.C. In these cities, we are working with local nonprofits – DiscoverU, Kingmakers of Oakland and Youth Guidance – to deliver the program. In the U.K., our Firm’s Aspiring Professionals Program, run in co llaboration with the Social Mobility Foundation, supports talented young people from low income backgrounds with work experience, mentoring and skills sessions to equip them with skills to succeed in their future careers. Since launching in 2012, 800 young people from 426 different schools have been supported, and 70% of participants have secured a place at a university. Approximately 450 volunteers from the Firm have acted as mentors to the young people since the start of the program, and our Firm has committed to continue to run the program for a further three years and reach an additional 500 young people. HBCU CAREER PATHWAYS INITIATIVE Taking what we have learned from our investments in college- to-career pathway programs that help underserved students succeed, in 2021 we launched a HBCU Career Pathways Initiative. As part of our broader strategy to invest in the success of HBCU students and the institutional capacity of HBCUs, we are collaborating with the United Negro College Fund and individual HBCUs to assess current career pathways and requirements and to develop education and training programs aligned with local industry demand. We are also working to deepen employer engagement with these institutions to better align education and training programs with in-demand skills and credentials, as well as to expand access to work-based experiences for students. The HBCUs in our 2021–2022 Career Pathways cohort include Paul Quinn College, Johnson C. Smith University, Delaware State University, Simmons College and Texas Southern University. In addition, our ABP program has expanded programs and activities that support HBCU student development, employability and access to career pathways at Morehouse College, Spelman College, North Carolina A&T, Florida A&M and Morgan State. The aim of our HBCU collaboration, is to provide career guidance and professional development to 4,000 HBCU students annually. 37 INTRODUCTION ENVIRONMENTAL SOCIAL Feature: Our Commitment to Racial Equity Diversity, Equity & Inclusion Human Capital Inclusive Growth GOVERNANCE ESG REPORT APPENDICES
SUPPORT FOR COMMUNITY COLLEGES AND NONTRADITIONAL STUDENTS A key part of our strategy for helping equip people with the skills to compete for well-paying and stable jobs is bolstering community colleges and making stronger connections between community college programs and employer needs. With open admissions policies and lower costs relative to other institutions, community colleges play an important role in creating pathways to economic mobility by providing economically and demographically diverse communities with access to career opportunities. In 2019, JPMorgan Chase committed $125 million in philanthropic capital to strengthen the capacity of community colleges across the U.S. In 2021, we also made an equity investment in Upswing, which is a virtual assistant and student services platform aimed at using technology to eliminate the gap in academic and nonacademic resources available to students. CAREER READINESS PROGRAMS Our Firm supports a range of programs aimed at expanding access to education, credentials and experiences that prepare young people, particularly those from underserved communities, for career success. Our Firm made a five-year, $17 million commitment in 2017 to help U.S. cities increase the number of young people with access to quality summer work experiences, equipping them with skills and helping put them on a path to greater economic mobility. As part of this, in 2021 we provided $3 million to summer youth employment programs in 20 U.S. cities to boost access to summer employment opportunities for young people. We are investing in career readiness efforts outside the U.S. as well. For example, in collaboration with the Sutton Trust, in 2021 our Firm launched a more than £4.8 million endowment fund to improve access to employment opportunities for underserved, low-income and Black and Minority Ethnic university students in the U.K., starting with 350 students in the next 10 years. Managed at no cost by J.P. Morgan Private Bank, the endowment will provide students with scholarships to help them access enrichment opportunities, such as internships, study abroad programs, volunteering experiences and additional courses and training, that contribute to positive employability outcomes. Alongside our financial support, a key focus of our employee volunteerism efforts around the world is supporting youth to prepare for future careers. 38 INTRODUCTION ENVIRONMENTAL SOCIAL Feature: Our Commitment to Racial Equity Diversity, Equity & Inclusion Human Capital Inclusive Growth GOVERNANCE ESG REPORT APPENDICES
Fostering Collaboration Across the Business Community In April 2021, our Firm helped launch the Second Chance Business Coalition ("SCBC"), a cross-sector coalition of large, private-sector Firms committed to expanding second chance hiring and advancement practices within their companies. Co-chaired by JPMorgan Chase’s Chairman and CEO, Jamie Dimon, and Craig Arnold, Chairman and CEO of Eaton, the SCBC promotes the benefits of second chance employment and provides employers with a set of tools, relationships and expertise to allow them to hire and provide career advancement and greater economic opportunities to people with criminal records. In addition to the co-chairs, five partner organizations lead the coalition: Business Roundtable, the Society for Human Resource Management, Dave’s Killer Bread Foundation, Stand Together and the Georgetown University McDonough School of Business Pivot Program. By the end of 2021, nearly 40 large companies had joined SCBC. PROVIDING A SECOND CHANCE Approximately one in three working age adults in the U.S. has a criminal record, and as a result face economic barriers including hiring discrimination and lost job opportunities. This affects individuals and their families and also has broader economic consequences that contribute to inequality. Black adults are nearly six times more likely to be incarcerated than White adults, and Latino adults are more than three times more likely, meaning the Black and Latino communities disproportionately bear the consequences. 24 23 JPMorgan Chase is giving people with criminal records a second chance by supporting their participation in the workforce, communities and local economies. We are making changes in our own hiring and recruitment practices, along with advancing a policy agenda that reduces barriers to employment for people with criminal backgrounds. In addition, we are supporting community organizations that equip people with criminal backgrounds with the skills, resources and connections to get on a career pathway. For example, in 2021 we committed $12.5 million to help community organizations in cities like Los Angeles, New York, Seattle, Chicago, Nashville and Wilmington connect people with criminal backgrounds with in-demand, well-paying jobs and other tools to achieve their financial goals. Hiring Programs We have taken a number of steps to broaden our potential talent pool and create more inclusive inroads to careers at our Firm by actively working to reduce barriers to employment for individuals with criminal backgrounds. We started in 2018 with the decision to “ban the box” by removing all questions about criminal backgrounds from our job applications in the U.S. Next, we developed a program to work with community and legal aid organizations to proactively develop a pipeline of potential employees with criminal backgrounds, whose histories fit within industry guidelines, to fill open roles. In 2019, we piloted this Second Chance community-based hiring program in Chicago and, in 2021, we expanded the model to Columbus, Ohio, with plans to bring it to additional cities. Through the program, we collaborate with local nonprofit organizations, which provide job seekers with mentorship and training to prepare them for employment opportunities. Our recruiters coordinate directly with the nonprofit to identify open roles and potential candidates, who are then connected with hiring managers within our Firm. Through these and other efforts, we hired approximately 4,000 individuals with criminal backgrounds in 2021, approximately 10% of our new hires in the U.S. Policy Agenda Through the JPMorgan Chase Policy Center , our Firm is developing and advancing sustainable, evidence-based policy solutions to help remove barriers to employment for people with criminal backgrounds. Our efforts are focused on supporting: • Reforms to industry hiring rules by working with the Federal Deposit Insurance Corpora - tion ("FDIC") and Congress to support efforts to modify Section 19 of the Federal Deposit Insurance Act rules for people with convictions for certain low-risk crimes to qualify for jobs in the banking industry. • Clean Slate automatic record clearing measures in states across the country and the Clean Slate Act of 2021, which would allow certain federal records to be sealed. The Firm has supported Clean Slate legislation to help clear or seal eligible criminal records and open access to jobs in places such as Michigan, Delaware, Connecticut and Virginia – and continues to push for measures in New York and Colorado. • The Fair Chance Act, which was signed into federal law in December 2019 and helps qualified workers with arrest or conviction records compete for employment in federal agencies and with federal contractors. • Restoration of access to Pell Grants for incarcerated individuals. Signed into federal law in 2020, the Restoring Education and Learning Act allows incarcerated individuals to pursue post-secondary education in prison, increasing employment opportunities after their release. • The federal Driving for Opportunity Act and state measures which seek to limit driver’s license suspensions for unpaid fines and fees unrelated to driving infractions. 23 Source: https://www.ncsl.org/research/labor-and-employment/barriers-to-work-individuals-with-criminal-records.aspx 24 Source: https://secondchancebusinesscoalition.org/why-it-matters 39 INTRODUCTION ENVIRONMENTAL SOCIAL Feature: Our Commitment to Racial Equity Diversity, Equity & Inclusion Human Capital Inclusive Growth GOVERNANCE ESG REPORT APPENDICES
Our supplier diversity mission is comprised of three pillars: (1) increasing diversity within the JPMorgan Chase supply chain, (2) creating a supply chain that mirrors our customers’ demographics; and (3) driving economic growth in the communities in which we do business. Supplier development is also a key component of our mission. We invest in building diverse suppliers’ capacity and expertise, positioning them to successfully do business with our Firm and also with other corporations. In 2021, our Firm spent approximately $2.4 billion on Tier 1 and Tier 2 diverse suppliers, including $1.2 billion with minority-owned businesses and $902 million with women-owned businesses. 26 25 In addition, we have a dedicated effort to mobilize our Gold Suppliers – a network of over 100 of our most strategic suppliers that have achieved our top supplier designation – to promote supplier diversity programs, with an emphasis on Black, Hispanic and Latino-owned businesses. As of the end of 2021, nearly 40% of our Gold Suppliers had agreed to increase aggregate spend with diverse companies globally by more than $6 billion collectively over the next three years. In 2021, our Firm also committed up to $200 million to be co-invested alongside Ariel Alternatives in Project Black to forge a new class of Black, Hispanic and Latino entrepreneurs, as well as to nurture and grow minority-owned businesses in the Fortune 500 supply chain. 25 Tier 1: The amount of spend, or procurement dollars, that the Firm spends directly with third parties that provide goods and services that support its business operations. Tier 2: The amount of spend, or procurement dollars, that the Firm's suppliers spend with their tier 1 suppliers. 26 Businesses that are at least 51% owned operated and controlled by members of an ethnic minority including Black, Hispanic, Asian and Native American. Business, particularly small- and medium-size enterprises, serves as a key engine of economic growth and mobility, especially in low- and moderate-income communities. However, minority- and women-owned businesses face systemic barriers – including lack of access to capital, networks and tools – when it comes to establishing, growing and scaling their companies. Additionally, as JPMorgan Chase Institute research has shown, the typical White-owned business has an additional week of cash liquidity compared to Black-owned businesses – critical days of buffer during stress periods like the pandemic. JPMorgan Chase is working to level the playing field for diverse entrepreneurs through products, programs, investments and policy recommendations aimed at expanding access to resources. SUPPLIER DIVERSITY JPMorgan Chase supports the development and utilization of qualified diverse businesses from historically underrepresented groups including companies owned and operated by minorities, women, military veterans, disabled veterans, service- disabled veterans, people with disabilities and members of the LGBT+ community. We have been committed to diverse entrepreneurs for decades. In 2020, as part of the Firm's $30 billion Racial Equity Commitment, we deepened our dedication to supplier diversity by pledging to spend an additional $750 million in Tier 1 spend with Black, Hispanic and Latino suppliers over five years. SUPPORT FOR SMALL BUSINESS Our Firm is proud to serve small business. During 2021, JPMorgan Chase provided $22 billion of credit to small businesses. As part of our Racial Equity Commitment in 2020, we pledged to provide an additional 15,000 or $2 billion in loans to small businesses in majority Black, Hispanic and Latino communities over the next five years. In 2021, we began building the infrastructure and foundation to deliver our goal. We expanded a national program to help support minority entrepreneurs in historically underserved neighborhoods. Launched in late 2020, the initiative matches business owners – regardless of whether they are Chase customers – with a Chase senior business consultant who provides one-on-one coaching. By the end of 2021, we have hired 25 diverse senior business consultants to support this effort. Collectively, they mentored more than 1,000 Black, Hispanic and Latino small businesses and hosted educational events, community workshops and business training seminars with over 28,000 participants across 14 U.S. cities. Over the past two years, our Firm also deployed substantial small business lending through pandemic-related government relief programs, including the PPP. While PPP loans are not part of the Firm’s Racial Equity Commitment, JPMorgan Chase was the #1 PPP lender on a dollar basis — over the life of the program, we funded more than 400,000 loans for more than $40 billion. Fueling Business Growth and Entrepreneurship 40 INTRODUCTION ENVIRONMENTAL SOCIAL Feature: Our Commitment to Racial Equity Diversity, Equity & Inclusion Human Capital Inclusive Growth GOVERNANCE ESG REPORT APPENDICES
ENTREPRENEURS OF COLOR FUND In early 2021, our Firm committed $350 million over five years to grow Black, Hispanic, Latino, women-owned and other underserved small businesses. More than 40% of the commitment is expected to be low-cost loans and equity investments, supporting underserved entrepreneurs by providing access to capital. This includes contributing $42.5 million in capital in 2021 to expand the Entrepreneurs of Color Fund. In collaboration with Local Initiatives Support Corporation and a network of CDFIs, our goal is to help create a nationwide program providing low-cost loans and technical assistance to minority-owned small businesses through CDFI partners. In 2021, the expanded Entrepreneurs of Color Fund closed 382 loans totaling $46.1 million to Black, Hispanic, Latino and other underserved entrepreneurs. By the end of 2021, the program had expanded to include Atlanta, Detroit, the Bay Area, New York City, Chicago, Greater Washington, D.C. and Los Angeles. Supporting Black Entrepreneurs in South Africa J.P. Morgan South Africa launched the J.P.Morgan Abadali Equity Equivalent Investment Program in 2021 with the intent to create a positive socioeconomic impact in South Africa by addressing a critical funding gap for Black entrepreneurs. These businesses have historically found it challenging to access capital to finance growth. The Abadali Program consists of two initiatives – the Abadali Fund, a Black Business Growth Fund, and the Abadali Grant. The Abadali Fund is extending debt financing of 300 million rand ($20 million equivalent) over the next eight years to selected, eligible Black enterprises that do not fit the traditional underwriting criteria of “general commercial banking requirements.” The Fund will focus on supporting enterprises operating in mainly the industrial and green economy sectors of the South African economy. Beneficiaries will also be able to participate in the “Business Development Support Model” process which will provide training, skills development, mentorship for entrepreneurs and access to legal and business planning assistance, to support job creation and economic growth. J.P. Morgan South Africa aims to support over 500 early-stage businesses and to stimulate the creation of at least 1,000 net permanent jobs over the next eight years. Over the program's eight-year period, the Abadali Grant will also extend grants of 40 million rand ($2.64 million equivalent) towards support programs developing Black entrepreneurs into sustainable businesses. SMALL BUSINESS POLICY AGENDA We are advancing policy reforms that promote access to capital and other support for underserved entrepreneurs. Informed by the JPMorgan Chase Institute’s data- driven insights and the expertise of the JPMorgan Chase Policy Center, we support increased resources for the SBA Microloan program and modifying restrictions on SBA program participation for justice-involved individuals. Additional items on our policy agenda include maintaining support for the Department of Treasury’s CDFI Fund and improving procurement programs and policies to provide greater opportunity for underserved small business owners. 41 INTRODUCTION ENVIRONMENTAL SOCIAL Feature: Our Commitment to Racial Equity Diversity, Equity & Inclusion Human Capital Inclusive Growth GOVERNANCE ESG REPORT APPENDICES
2 4 8 10 12 11 9 1 5 13 6 3 3 7 2 4 3 1 5 Carver Bancorp Carver State Bank and Citizens Trust Bank CityFirstBroadway 29 First Independence Bank Harbor Bank of Maryland 6 8 7 10 9 Industrial Bank Liberty Bank M&F Bank Optus Bank Rio Bank and Unity National Bank 12 11 13 State-based City-based Southern Bancorp Sunstate Bank Unity National Bank DOUBLING DOWN ON OUR COMMITMENT TO CDFIS AND MDIS MDIs and CDFIs provide vital financial services in communities that are often underserved. Through small business loans, commercial financing, mortgages and more, these institutions supply capital to fuel economic growth and, in the process, play an essential role in helping individuals in these communities build wealth. In order to do so, however, many MDIs and CDFIs need additional capital themselves. Through our Racial Equity Commitment, our Firm is working to strengthen minority-owned and diverse-led MDIs and CDFIs by providing additional access to capital, connections to institutional investors, policy advocacy, support for diverse- led commercial projects and mentorship and training opportunities. When we announced our Racial Equity Commitment in 2020, we pledged to invest up to $50 million over five years in the form of capital and deposits in Black, Hispanic and Latino-owned MDIs and diverse-led CDFIs. By the end of 2021, we had invested more than $100 million of equity in 15 diverse-owned and -led MDIs and CDFIs that serve more than 89 communities across 19 states and the District of Columbia. This additional capital will help these institutions hire staff, invest in technology enhancement and expand into new markets. According to the FDIC, every dollar of equity capital invested in MDIs can increase MDI lending by eight to ten times – meaning our Firm’s $100+ million investment could generate access to as much as $1 billion in community lending across the nation, helping to create wealth, grow local businesses and improve customers’ experiences in those communities. 27 JPMor gan Chase provides holistic support for CDFIs, mobilizing different parts of the Firm to supply financing ranging from philanthropic and flexible capital to debt. The Firm also provides resources and technical assistance, which includes direct pro bono consulting support through its Service Corps program. In 2021, the Firm provided over $500 million in financing to CDFIs to support over 100 loan funds specializing in community development. We look for ways to build on our partnerships with CDFIs. JPMorgan Chase invested in over $550 million of New Market Tax Credit project financing in 2021, the majority of which was in partnership with CDFIs. Lending our Expertise to Help Liberty Bank Expand its Reach In 2021, a team of JPMorgan Chase employees spent four months putting their skills and expertise to work to help Liberty Bank strengthen its capacity to serve more customers. Founded in 1972 and based in New Orleans, Louisiana, Liberty Bank has grown to be one of the largest Black-owned banks in the U.S., with a presence in nine states. Through the JPMorgan Chase Service Corps – our skills-based volunteer program – the team helped develop a comprehensive customer acquisition strategy, along with enhancements to digital tools. This is just the latest in our Firm’s relationship with Liberty, which began in 2019 through the U.S. Department of the Treasury’s Bank Mentor Protégé Program. As a protégé bank, Liberty was provided with support to address gaps that impeded its ability to further financial inclusion within underserved communities. In early 2021, we made a multi-million dollar investment in Liberty as part of our over $100 million investment to diverse financial institutions through the Racial Equity Commitment. Empowering Change In 2021, J.P. Morgan Asset Management launched Empowering Change, which supports minority- and diverse-led financial institutions with the ability to develop new and reoccurring revenue opportunities by offering an exclusive money market share class to their institutional clients. At the same time, corporate investors gain access to these institutions to support their ESG-related investment goals. In addition, J.P. Morgan Asset Management has committed to an annual 12.5% donation of gross revenue received from the management fees on the Empower share class to support community development. 28 In 2021 , J.P. Morgan Asset Management’s garnered over $5 billion within the Empower Share Class’s assets under management. In its inaugural year, the Empowering Change initiative expanded its reach and impact across more communities by doubling the number of MDI banks it partners with, from four to eight. Investing in MDIs and CDFIs across the U.S. 27 Source: https://www.fdic.gov/regulations/resources/minority/mission-driven/guide.html 28 The annual donation will be made for the life of the Empower share class to the Empower and Community Development Fund, a Donor-Advised Fund administered by the Chicago Community Trust, that is committed to supporting community development to expand opportunities within underserved communities. 29 Formerly Broadway Federal Bank and City First Bank, which merged in 2021; Washington, D.C. and Los Angeles-based. 42 INTRODUCTION ENVIRONMENTAL SOCIAL Feature: Our Commitment to Racial Equity Diversity, Equity & Inclusion Human Capital Inclusive Growth GOVERNANCE ESG REPORT APPENDICES
Catalyzing Community Development Investing in communities is a route to expanding economic opportunity. Housing, in particular, is a central pillar of community development because access to a stable, affordable home is a leading determinant of income and wealth, health and overall quality of life. Yet for many U.S. households, especially Black, Hispanic and Latino households, an affordable housing crisis has put this access increasingly out of reach. For example, 43% of Black and 40% of Hispanic households spent more than 30% of their incomes on housing as of 2019, compared with 25% of White households. 30 Throug h lending, equity investments and philanthropic capital; community partnerships, and data and policy insights, JPMorgan Chase is helping to build stronger communities, with a concerted focus on housing. Financing the creation and preservation of affordable rental housing, and expanding access to homeownership, is also a core focus of our $30 billion Racial Equity Commitment (see page 21), because we know that the lack of affordable housing and rising costs of homeownership have been leading drivers of the racial wealth gap across the U.S. AFFORDABLE RENTAL HOUSING The Firm works to advance affordable housing solutions, bringing our industry expertise, a comprehensive set of financial tools and a strategy of combining our business and philanthropic efforts to create greater impact. As part our Racial Equity Commitment announced in October 2020, we pledged to expand on these efforts by financing the creation and preservation of 100,000 affordable rental units over five years through $14 billion in new loans, equity investments and other efforts. To help drive progress toward this goal, we created the Affordable Housing Preservation Program, which incentivizes landlords to keep rental units in their buildings at an affordable level. Thanks to these and other efforts, between October 2020 and December 2021, our Firm approved funding for approximately $13 billion in loans to help preserve more than 100,000 affordable housing and rental housing units across the U.S., and increased our Low-Income Housing Tax Credit investments by $400 million. HOMEOWNERSHIP Owning a home is critical to building wealth and ensuring financial stability over time. Yet, at the end of 2021, the homeownership gap between Black and White households was 31 percentage points – and was 26 percentage points between Hispanic and White households. 31 To help ad dress this gap, our Firm is expanding access to affordable homeownership through our home lending products and services, as well as through innovative homebuyer readiness programs and financial education services. As part of our Racial Equity Commitment (see page 21), we committed to originate an incremental 40,000 home purchase loans, or $8 billion in mortgages, for Black, Hispanic and Latino families over five years. We also committed to refinance an additional 20,000 mortgages, up to $4 billion in loans, to reduce mortgage payments for Black, Hispanic and Latino homeowners. To build the foundation to increase homeownership, we established a Community and Affordable Home Lending business. As part of this, we expanded our traditional home lending advisor network to include a new role called “Community Home Lending Advisor,” which is designed to be located in minority and low- to moderate- income communities. These individuals are experts in local housing and down payment assistance programs. By the end of 2021, we had hired more than 150 Community Home Lending Advisors nationwide. We also continue to enhance our home lending products to be more accessible to customers across the full economic spectrum. For example, to address two of the biggest barriers to homeownership, we expanded our Homebuyer Grant program to $5,000 to help more customers with closing costs and down payment assistance when buying a home in more than 6,700 majority minority communities nationwide. Home Lending continues to make progress in its lending commitments to Black, Hispanic and Latino communities: • During 2021, helped homeowners by refinancing 19,000 of the 20,000 incre - mental loans, nearly $5 billion. • Originated nearly 12,000 home purchase loans for Black, Hispanic and Latino households in 2021, totaling more than $4 billion. While the number of units was slightly below 2019 production volume, the Firm continues to pace towards originating an incremental 40,000 by 2025. 30 Source: https://www.jchs.harvard.edu/sites/default/files/reports/files/Harvard_JCHS_The_State_of_the_Nations_Housing_2020_Report_Revised_120720.pdf 31 Source: https://www.census.gov/housing/hvs/files/currenthvspress.pdf 43 INTRODUCTION ENVIRONMENTAL SOCIAL Feature: Our Commitment to Racial Equity Diversity, Equity & Inclusion Human Capital Inclusive Growth GOVERNANCE ESG REPORT APPENDICES
$1 Billion Inaugural Social Bond Issuance In 2021, JPMorgan Chase issued its $1 billion inaugural social bond and allocated an amount equal to the net proceeds of that issuance to finance or refinance the creation, rehabilitation or preservation of 223 affordable housing projects across the United States. The affordable housing projects span 36 states and represent 22,911 affordable housing units. This inaugural social bond issuance builds on our Firm’s leadership in the sustainable bond market as well as our engagement with diverse suppliers, with the co-managers for the bond offering consisting solely of Minority and Women- Owned Business Enterprise and Service-Disabled Veteran-Owned Business firms. More information on the use of proceeds and expected impact metrics can be found in our Social Bond Annual Report . PHILANTHROPIC AND FLEXIBLE CAPITAL FOR INNOVATIVE HOUSING SOLUTIONS In 2021, we made a five-year, $400 million commitment that includes low-cost loans, equity and grants targeted to nonprofits and other organizations working to improve housing affordability and stability for Black, Hispanic and Latino households. This includes launching a new initiative with the Urban Institute to identify, test and scale affordable housing solutions to better serve Black, Hispanic and Latino households. We are also collaborating with the Center for Community Investment to drive local systems change and promote equitable housing in Chicago, Washington D.C., Los Angeles, Miami, New Orleans and Seattle. As part of the $400 million commitment, we approved funding for $20.4 million to eleven nonprofits working to test and scale models to improve household stability and housing affordability. To help stabilize households, the organizations are providing eviction prevention support, rental assistance, access to legal services and resources for small landlords. To help increase the supply of affordable housing and homeownership, the organizations are advancing single-family housing production, launching specialized mortgage products, and increasing the capacity of community land trusts and other shared financial equity programs. HOUSING REFORMS POLICY AGENDA Regulatory and policy changes are needed to both address systemic discrimination in housing and encourage more effective models for boosting access to and supply of affordable homes. In 2021, the JPMorgan Chase Policy Center released data- driven policy recommendations to improve household stability weakened by the COVID-19 pandemic, including: • Reduce preventable evictions by establishing eviction diversion programs, enhancing eviction protections, such as right to counsel, that protect tenants from unlawful eviction and helping develop a balanced and predictable evic - tion process; • Increase housing availability by removing barriers to affordable rental housing production and expanding funding to boost the supply of affordable homes for purchase; • Protect economically vulnerable families from losing their homes in heirs' prop - erty partition sales and tax lien sales with due process protections in state property laws; and • Standardize the collection and tracking of state- and local-level eviction data to better inform policy decisions. Another key policy focus area is working to reform the residential appraisal process to advance fair housing and address housing discrimination. JPMorgan Chase is actively engaging with industry partners and regulators to find ways to address gaps in the residential appraisal process, including establishing new anti-bias training requirements for appraisers, allowing equal access to valuation data and techniques, and promoting national standards that will allow for responsible expanded use of Alternative Valuation Methods. In addition, in 2021 our Firm donated $3 million to the Appraiser Diversity Initiative, a collaboration between the Appraisal Institute, National Urban League, Fannie Mae and Freddie Mac aimed at attracting diverse entrants into the residential appraisal field. Our Firm is also providing mentors for trainees in the Appraiser Diversity Pipeline Initiative. This initiative, led by the Appraisal Institute and Fannie Mae, is designed to attract new people in the field, help trainees overcome common barriers to entry and foster diversity. AdvancingCities AdvancingCities is JPMorgan Chase’s $500 million, five-year initiative to invest in solutions that bolster the long-term vitality of the world’s cities and the communities within them that have not benefited from economic growth. As part of the initiative, launched in 2018, our Firm is making large-scale investments in “signature cities”, including; Greater Paris, Chicago, Detroit, Greater Washington Region and the San Francisco Bay Area. Through the AdvancingCities Challenge our Firm holds an annual competition to identify and seed innovative ideas for tackling community development challenges. In 2021, we invited community organizations to apply for up to $5 million to support collaborative, sustainable solutions focused on wealth creation and economic success for Black and Latina women, which is foundational to building more equitable communities. One of the winners was The Advancing Early Education Collaborative in Washington, D.C., a partnership to increase access to education, skills, and training opportunities, as well as wealth building and capacity building for early childhood educators and the centers that employ them. Another was the Prioritizing Black and Latina Women’s Economic Rise in Baltimore, Maryland, a collaboration working to create a continuum of wealth building for Black and Latina women real estate developers in West Baltimore. 44 INTRODUCTION ENVIRONMENTAL SOCIAL Feature: Our Commitment to Racial Equity Diversity, Equity & Inclusion Human Capital Inclusive Growth GOVERNANCE ESG REPORT APPENDICES
SPURRING COMMUNITY AND ECONOMIC DEVELOPMENT IN EMERGING MARKETS The United Nations SDGs provide goals for all countries – developed and developing – to alleviate poverty and inequality, improve health and education and spur economic growth and employment, all while tackling climate change and working to preserve natural ecosystems. Achieving these goals will require unprecedented levels of investment in community and economic development, particularly in emerging economies. Our Firm launched the JPM DFI in 2020 to mobilize capital towards sustainable development in emerging markets. By assessing transactions with anticipated development impact, the JPM DFI seeks to expand the market for development finance and attract capital to transactions that offer both potential financial returns and advance the SDGs. In 2021, the JPM DFI assessed transactions to have anticipated development impact for a total combined amount of $117 billion. JPM DFI also acts as development finance structuring agent for a diverse set of corporate and sovereign transactions, which involves assisting clients to measure, manage and communicate the development impact of their transaction with investors and other stakeholders. 32 32 Excludes transactions that overlap with Green, representing a total combined amount of $7 billion Fostering Mongolia’s Healthcare, Transport Infrastructure and Technology Sectors In June 2021, the Government of Mongolia issued a $1 billion sovereign bond, where JPM DFI acted as joint bookrunner and development finance structuring agent. The Government of Mongolia plans to use the proceeds from the issuance of the bond to improve the country’s healthcare, transport infrastructure and technology sectors, addressing key development gaps in the region. In particular, the proceeds of the bond are expected to address these challenges by: • Building a second branch of the National Cancer Center to improve early detection and improve diagnostic and treatment capacity; • Promoting sustainable public transportation in Ulaanbaatar, increasing the capacity of the public transport system by procuring 1,500 electric buses, which are also expected to reduce fuel costs by 65% and improve access for people with disabilities; • Issuing citizens and registered organizations digital signatures; and • Introducing platforms that incorporate and advance new technologies for government services, including a nationwide unified and integrated address information system. The JPM DFI mapped the transaction to SDGs #3, #11 and #16, associated with ensuring healthy lives, fostering sustainable cities and communities and promoting inclusive societies for sustainable development. For more information on the JPM DFI, see the 2021 Annual Report . Ulan Bator, Mongolia 45 INTRODUCTION ENVIRONMENTAL SOCIAL Feature: Our Commitment to Racial Equity Diversity, Equity & Inclusion Human Capital Inclusive Growth GOVERNANCE ESG REPORT APPENDICES
Strengthening Financial Health and Wealth Creation Access to relevant, useful and affordable financial services is a critical foundation for achieving financial stability. However, nearly 7.1 million households in the U.S. are “unbanked” – meaning no one in the household has a checking or savings account – according to the FDIC. The FDIC found that not having sufficient money to meet minimum balance requirements was the most common reason households cited for being unbanked. Additionally, access to financial services is not equally distributed: Black, Hispanic and Latino households represent 64% of the country’s unbanked, despite the fact that they make up only 32% of the U.S. population. 34 33 JPMo rgan Chase is leveraging our reach and expertise to expand access to banking, develop products that meet the needs of low- and moderate-income consumers and provide financial health education and other resources and tools that help people become financially resilient and, ultimately, build wealth. We are also supporting a federal wealth and savings agenda to pilot portable benefits, incentivizing savings policies to help families build emergency savings, and seeding baby bonds to build wealth. ACCESS TO BANKING SERVICES As part of our Racial Equity Commitment (see page 21), we pledged to help one million consumers open low-cost checking or savings accounts over five years through expanded awareness of our Chase Secure Banking SM product. Chase Secure Banking SM accounts have no overdraft fees and provide users with the benefits of being a Chase customer, like access to thousands of fee-free ATMs, free money orders and cashier’s checks, Chase’s mobile app and support from bankers in person or by phone. Chase Secure Banking SM has been certified by Bank On for meeting the National Account Standards as a low-cost, low-fee account. In the 12 months following our announcement of our Racial Equity Commitment in October 2020, we helped customers open more than 200,000 low-cost checking accounts with no overdraft fees. All told, since its launch in 2019, Chase Secure Banking SM has been made available to 1.3 million accounts to help people access mainstream banking. We continue to invest in our digital channels – including online and mobile banking – which are an important way for us to reach our customers and provide them access to our products and services, particularly during the COVID-19 pandemic. At the same time, our bank branches are a key part of our strategy to expand access to banking services. The Firm has opened bank branches in all of the lower 48 states. And, since January 2021, we have opened 47 out of 100 planned new branches in LMI communities, many within Black, Hispanic and Latino populations. As of December 2021, approximately 27% of Chase branches in new markets are in LMI communities. We have also committed to open 17 Community Center Branches, which offer additional resources for communities that have lacked access to traditional banking, and to hire more than 150 Community Managers (see page 48). In addition, we are increasing marketing to reach more customers who are currently underserved, underbanked or unbanked. TOOLS TO HELP OUR CUSTOMERS ACHIEVE THEIR FINANCIAL GOALS Our Firm provides affordable and scalable products and services that help our customers strengthen their financial health. Our aim is to not only offer tools that help customers manage their daily lives, but also provide access to products and services that enable them to meet long-term goals and make wealth-building investments in areas like retirement savings, education, homeownership and growing a small business. One tool we offer is Autosave, which allows customers to identify their savings goals and set up automatic transfers to fund them. Autosave helps build a saving habit by automating transfers from customers’ checking to their savings accounts and allowing them to monitor their progress through a savings dashboard. The number of customers enrolled in Autosave grew by 39% in 2021 to nearly 3.3 million. On average, customers saved 47% more per month using Autosave in 2021 compared with the prior year. Another tool we provide is Budget, which gives customers a simple way to create a monthly budget based on their income, recurring expenses and flexible spending. Budget then tracks all of their Chase credit and debit card spending so that they can stay on track and identify additional ways to save. In addition, with Chase Credit Journey SM we help consumers – regardless of whether they are Chase customers – build, manage and repair their credit. This free resource enables consumers to check their credit score and view their full credit report online, and also offers automatic alerts and a score simulator that demonstrates how certain actions can impact credit scores. We provide information about these tools, as well as other information and tips to manage a budget, grow savings and build credit, on our online Financial Goals resource center. 33 Source: https://www.fdic.gov/analysis/household-survey/index.html (Note: 2019 is latest data available as FDIC only does this survey biennially) 34 Source: https://www.bcg.com/publications/2021/unbanked-and-underbanked-households-breaking-down-the-myths-towards-racial-equity-in-banking 46 INTRODUCTION ENVIRONMENTAL SOCIAL Feature: Our Commitment to Racial Equity Diversity, Equity & Inclusion Human Capital Inclusive Growth GOVERNANCE ESG REPORT APPENDICES
FINANCIAL HEALTH RESOURCES FOR HBCU STUDENTS In 2021, we launched a program to deliver financial health resources to HBCU students across the U.S. The program – called #BackToTheYard presented by Chase – is one part of our broader Firmwide strategy to help close the racial wealth gap by investing in the success of HBCU students and the institutional capacity of HBCUs. Delivered through our Advancing Black Pathways initiative and initially launched at seven partner HBCUs, the program is designed to empower HBCU students to take charge of their financial health through education on topics such as budgeting, credit use and managing student expenses. We are also making available for all HBCUs a curated set of web-based resources on financial health and other topics. Our aim is to deliver financial health education to 10,000 HBCU students annually. In addition, our Firm has committed $1 million annually over five years to the Student Financial Hardship Fund. The money will be distributed by the United Negro College Fund and the Thurgood Marshall College Fund to students at HBCUs that need aid to stay in school. We know that supporting students with emergency funds – to buy books, pay a security deposit or medical bill, address short-term food insecurity or meet other needs – helps them to continue their studies and graduate, which makes a profound impact on their long-term economic success. INVESTMENTS IN COMMUNITY ORGANIZATIONS As part of a five-year, $125 million commitment to improving financial health in underserved communities, JPMorgan Chase is working closely with community organizations to address the unique financial needs of people who too often get left behind, including low-income women, immigrants, people of color and the aging. In 2021, for example, our Firm provided a $3 million low-cost loan to Capital Good Fund, a non-profit CDFI with a mission to create pathways out of poverty and advance a green economy through inclusive financial services. Capital Good Fund offers consumer loans as well as personalized financial and health coaching to families across multiple states. Capital Good Fund issues loans for emergencies, immigration expenses, energy efficiency upgrades, residential solar installations and other personal expenses. Our loan will support Capital Good Fund's origination of consumer loans to low-to-moderate income households. POLICY SOLUTIONS JPMorgan Chase is working to advance policy that expands access to banking, improves cash flow management, develops and strengthens access to credit and builds savings and wealth. For example, we are engaging with regulators about ways to minimize the disproportionate impacts of overdraft fees on low- and moderate-income communities, advocating for flexibility in innovation around credit and liquidity solutions that are designed to protect consumers, and supporting policies around structural changes to public assistance programs. Our belief in structural solutions to wealth-building informs our support and advocacy of baby bonds and other wealth-building policies that address the racial wealth gap. Across all these areas, we are sharing our Firm’s insights, data and experience about the unique challenges, and solutions that meet the needs of low- and moderate-income communities. Helping Customers Avoid Overdraft Fees In 2021, we announced enhancements to Chase checking accounts that will help millions of customers save on overdraft fees. This included expanding the overdraft cushion; up from $5 to $50, which means customers pay no overdraft fees when their account is overdrawn by $50 or less at the end of the business day. We also eliminated the returned item fee so that customers pay no fee if Chase doesn’t pay a check or electronic payment because the customer does not have enough money in their account. Beginning in June 2022, we are expecting to provide customers an extra day to catch up and customers will have until the end of the next business day to bring their balances back to $50 or less to avoid overdraft fees from the previous day. In addition, Chase plans to enable customers to access direct-deposited payroll up to two business days early. These and other enhancement build on Chase’s ongoing commitment to improve customers’ financial health. 47 INTRODUCTION ENVIRONMENTAL SOCIAL Feature: Our Commitment to Racial Equity Diversity, Equity & Inclusion Human Capital Inclusive Growth GOVERNANCE ESG REPORT APPENDICES
Akron, Ohio Corktown in Detroit Crenshaw in Los Angeles Fifth Ward in Houston Gentilly Woods in New Orleans Harlem in New York City 36 Mattapan in Boston Oak Cli ff in Dallas Oakland, California South Shore in Chicago Ventura Village in Minneapolis 37 Wards 7 and 8 in Washington, D.C. 2 4 3 1 6 8 7 5 10 12 11 9 2 4 3 1 6 8 7 5 10 12 11 9 FROM COMMUNITY BANKING TO COMMUNITY BUILDING Helping individuals strengthen their financial health and build long-term wealth begins with trust and access – which includes being able to walk down the street to the bank to deposit a paycheck or knowing where to get trusted financial advice or how and when to apply for a loan. In underserved communities, this kind of access is too often missing. That’s where our Community Center branches come in. Since October 2020, we have opened an additional 10 Community Center branches in LMI communities – bringing our total number to 12 – many of which are located in urban areas with Black, Hispanic and Latino populations. The majority were built with minority contractors as part of our effort to engage more diverse vendors (learn more on page 40). At these branches, we are offering not only all our traditional banking services, but also collaborating with local organizations to offer free resources including homebuyer workshops, career and mentoring sessions and financial health seminars. The branches also have space to host grassroots community events, small business pop-ups and more. Since October 2020, we hired more than 100 Community Managers in underserved communities who serve as local ambassadors to build and nurture relationships with community leaders, nonprofit partners and small businesses. Community Managers are dedicated to building trust with the community to offer guidance, expertise and provide accessible tools, resources and information related to financial health. By the end of 2021, Community Managers hosted more than 1,300 Financial Health events with more than 36,000 people in attendance, and participated in more than 600 Community Service events. Neighborhoods Served by Chase Community Center Branches 35 The Role of a Chase Community Manager To help expand access to banking in Black, Hispanic and Latino communities and improve financial health, we pledged to hire 150 Chase Community Managers in branches in under - represented communities across the country. These individu - als serve as local ambassadors to build relationships with community members, and work together with local organiza - tions to offer financial health workshops, events and advice that is tailored to the need of local residents. They also work closely with Chase Community Home Lending Advisors and Senior Business Consultants to help local residents and entre - preneurs set their financial goals and identify the right prod - ucts and services to support those goals. “It’s an honor to play a part in helping individuals and businesses achieve their financial goals, no matter what those goals may be,” said Jordan King, Los Angeles Community Manager. “We’re here to provide education and support to help break down barriers that drive lasting change, and discuss important topics like budgeting, saving and building credit. It starts with meeting residents right where they are, and that’s exactly what we’re doing.” 35 As of December 31, 2021. 36 Opened prior to October 2020 announcement of our Racial Equity Commitment. 37 Opened prior to October 2020 announcement of our Racial Equity Commitment. 48 INTRODUCTION ENVIRONMENTAL SOCIAL Feature: Our Commitment to Racial Equity Diversity, Equity & Inclusion Hu man Capital Inclusive Growth GOVERNANCE ESG REPORT APPENDICES
Governance We are committed to setting high standards in our business activities and with our stakeholders. Our governance structures are designed to promote accountability, transparency and ethical behavior, consistent with our corporate standards and Business Principles. We regularly evaluate and enhance our governance structures, processes and controls to make sure we are operating at the highest level of performance. 49
Corporate Governance and ESG Oversight Our strong corporate governance practices help us protect the interests of stakeholders, including customers, clients, employ - ees, shareholders and communities. The Firm believes that continued success rests on adherence to its Business Princi - ples, which focus on how we strengthen, safeguard and grow our company over time. These principles apply consistently across lines of business and geographies where we operate. Board of Directors The Board is responsible for oversight of the business and affairs of the Firm. It is also responsible for setting the “tone at the top” to promote a culture of accountability, ethical conduct and strong corporate values across the Firm. Its core areas of oversight include strategy, executive performance and talent management, financial performance and condition, risk management and internal control framework and ESG matters. Our Board is guided by the Firm's Governance Principles. Our sound governance practices include: annual election of all directors by majority vote, 100% principal standing committee independence, Board oversight of corporate responsibility and ESG matters, stock ownership for directors and ongoing director education. In 2021, directors were provided with education on subjects including DEI, the Firm's climate risk management framework and cybersecurity and technology. Except for our CEO, all of our directors are independent under the standards set forth by the New York Stock Exchange and the Firm’s Corporate Governance Principles . In addition, we hav e a Lead Independent Director who is appointed annually by the independent directors and facilitates independent Board oversight of management. JPMorgan Chase seeks director candidates who uphold the highest standards, are committed to the Firm’s values and are strong independent stewards of the long-term interests of shareholders, employees, customers, suppliers and communities in which we work. The Board, including the Corporate Governance & Nominating Committee, considers Board composition holistically, with a focus on recruiting directors who have the qualities required to effectively oversee the Firm, including its present and future strategy. The Board seeks directors with expertise in executive fields who will bring experienced and fresh perspectives and insight, and come together to effectively challenge and provide independent oversight of management. The Board looks for candidates with a diversity of experience, perspectives and viewpoints, including diversity with respect to gender, race, ethnicity and nationality. As of April 2022, there are 10 directors on our Board, including four directors who identify as women and one director who identifies as Black. The Board oversees management directly and through its five standing committees: • Public Responsibility Committee • Compensation & Management Development Committee • Risk Committee • Audit Committee • Corporate Governance & Nominating Committee Each committee operates pursuant to a written charter. These charters , and the Firm’s Corporate Governance Principles guide the Board’s governance and oversight functions. Our annual Proxy Statement includes information about the membership and responsibilities of these committees. Senior Management Our management structure is designed to encourage effective leadership that is consistent with our corporate standards and promotes a strong corporate culture. We manage our Firm on a line-of-business basis, while also maintaining strong corporate functions and appropriate governance of our subsidiaries. Our Firm’s most senior management body is the Operating Committee, which is responsible for developing and implementing corporate strategy and managing operations. As of December 31, 2021, 37% of seats on the Operating Committee were held by women. Our Board reviews succession planning for the CEO and the members of the Operating Committee at least annually. In accordance with our compensation philosophy, the Compensation & Management Development Committee uses a balanced and disciplined approach to assess the performance of members of the Operating Committee throughout the year against four broad dimensions; business results; risk, controls and conduct; client/customer/stakeholder, including our engagement in communities and commitment to provide economic opportunity to underserved communities, and address environmental and social issues such as climate change and racial equity; and teamwork and leadership, including creating a diverse, inclusive, respectful and accountable environment and developing employees, managers and leaders as key drivers of our human capital management strategy. 50 INTRODUCTION ENVIRONMENTAL SOCIAL GOVERNANCE Corporate Governance and ESG Oversight Stakeholder Engagement Risk Management Data Privacy and Cybersecurity Business Ethics Political Engagement and Public Policy ESG REPORT APPENDICES
Oversight and Management of ESG Responsibility for oversight and management of ESG is defined at multiple levels within the organization. Oversight of ESG matters is an important part of the Board's work in setting the policies and principles that govern our business, including the Firm's governance-related policies and practices, our systems of risk management and controls, our investment in our employees and how we advance sustainability in our business and operations. In the past year, in addition to the work of the committees, all directors participated in full Board discussion regarding the Firm's approach to COVID-19, racial equity and climate change. Additionally, our director education program includes ESG issues. Each of the Board’s standing committees oversees reputational and conduct risks, within its scope of responsibility, and assists the Board in its oversight of various ESG issues. For example: • The Public Responsibility Committee oversees the Firm’s significant policies and practices regarding political contributions, major lobbying priorities and principal trade association memberships that relate to the Firm's public policy objectives. • The Compensation & Management Development Com - mittee, among other things, reviews and approves the Firm’s compensation and qualified benefit pro - grams. It also oversees the Firm’s culture, including reviewing diversity programs, which includes the Accountability Framework as it applies to members of the Operating Committee (see page 27). • The Risk Committee assists the Board in its oversight of management’s responsibility to implement a global risk management framework reasonably designed to identify, assess and manage the Firm’s risks, includ - ing ESG risks. • The Audit Committee helps oversee management’s compliance with the Firm’s ethical standards, policies, plans and procedures, and with laws and regulations. It also reviews the program established by manage- ment that monitors compliance with the Code of Con- duct, and reviews the record of such compliance. • The Corporate Governance & Nominating Committee exercises general oversight with respect to the gov - ernance of the Board, including its composition, nominees and framework for self-assessment. Senior management – including the Operating Committee and leaders within each of our lines of business – is responsible for driving strategy and execution on ESG matters across the Firm. The Chief Risk Officer, the Head of Human Resources, the Global Head of Diversity and Inclusion, the Global Head of Corporate Responsibility, the Global Head of Sustainability and other senior leaders provide periodic updates on ESG initiatives to the Operating Committee and Board of Directors. ESG efforts are spearheaded by several specialist teams across the Firm, with some examples including: • The Office of the Secretary partners with senior man - agement, control groups, lines of business and corpo - rate units to promote effective governance of the Firm. It also works closely with the Board of Directors on ESG matters, including responding to shareholder proposals. • The Office of Diversity, Equity and Inclusion leads the development and implementation of the Firm’s strategy to enhance DEI within our organization and support underserved communities. This includes continuing to advance programs and initiatives that incorporate a diversity lens into how the Firm develops products and services, serves clients, helps communities and sup - ports employees. • Our Corporate Responsibility team works to design, implement and evaluate community and philanthropic programs that open new pathways to economic oppor - tunity for individuals, provide actionable insight to civic and community leaders and protect the environment. It is composed of Government Relations, Public Engage - ment, Sustainability, Global Philanthropy and Research and Policy teams. • Our Corporate Sustainability team, which reports to the Global Head of Corporate Responsibility, provides advice on the Firm’s approach to managing ESG matters, sup - porting the development of sustainability- and climate-fo - cused business strategies and financing opportunities, engaging with stakeholders and facilitating external reporting on these matters. • Our Operational Sustainability team coordinates groups across our Chief Administrative Office – which includes Global Real Estate, Global Supplier Services and Firmwide Business Resiliency – to develop and execute the Firm’s strategy to minimize the environmental impact of our operations and supply chain. This team is responsible for achieving our operational sustainability targets, including our commitment to maintain carbon neutral operations and source renewable energy for 100% of our global power needs annually. • Our Climate Risk and Global Environmental and Social Risk Management ("GESRM") teams are responsible for estab - lishing our internal approach to managing climate risk as well as the Firm’s environmental and social risk standards. 51 INTRODUCTION ENVIRONMENTAL SOCIAL GOVERNANCE Corporate Governance and ESG Oversight Stakeholder Engagement Risk Management Data Privacy and Cybersecurity Business Ethics Political Engagement and Public Policy ESG REPORT APPENDICES
Stakeholder Engagement Our Firm has a range of stakeholders, including customers and clients, employees, communities, shareholders, regulators and policymakers, ESG raters, research analysts and suppliers. We engage with these stakeholders throughout the year to obtain insight into their needs and perspectives, as well as to share information about our Firm’s strategy, practices and performance. Responsibility for engaging with stakeholder groups is widely shared across our Firm’s lines of business and corporate functions, and we engage through numerous channels. The insight we gain from our engagement with key stakeholders feeds into the Firm’s business strategies, products and services and policies and procedures. Stakeholder Group How We Engage CUSTOMERS AND CLIENTS We are helping support our small business and consumer finance customers meet their financial needs, as well as our corporate and institutional clients. We regularly solicit and respond to customer and client feedback about our products, services and organization as a whole, and endeavor to build long-lasting relationships based on trust and mutual respect. • We engage regularly with our customers in our branches and through our website and social media platforms. We take pride in providing inclusive interaction. For example, we have multi- lingual staff in many of our branches and are investing in sign language interpreters at key locations – e.g., near Gallaudet University in Washington, D.C. We also seek customer feedback via online and in-branch surveys, with the aim of improving customer interaction and experience, and have a conduct hotline through which our customers can anonymously raise concerns and report misconduct. • We also engage with our clients through one-on-one meetings, roundtables and conferences – for example, the Firm’s Annual Health Care Conference, which aims to connect global industry leaders, emerging fast-growth companies and innovative technology creators. • We listen and respond to the needs of our customers and clients by offering products and services that emphasize social and environmental responsibility, including lending for affordable housing and electric vehicles and supporting minority-owned businesses through financial literacy coaching. EMPLOYEES Our people are at the heart of JPMorgan Chase and are vital to our success. We work to understand our employees’ evolving needs and perspectives. • We engage with our employees through surveys, including our global Employee Opinion Survey and Exit Surveys; town hall and small group meetings; focus groups; blogs, articles and newsletters; online feedback tools; and other forums. • Engagement surveys are conducted periodically and allow us to identify areas of strength and opportunities for improvement to promote continued employee satisfaction and retention. • Our CEO-led Town Halls cover topics such as business strategy and outlook, emerging industry trends and our progress on key Firm initiatives such as the $30 billion Racial Equity Commitment and $2.5 trillion Sustainable Development Target, and provide opportunities for employees to ask questions of our senior management. COMMUNITIES We are committed to ensuring the Firm's decisions are informed by diverse perspectives, particularly those of the communities we serve. • We are engaging with external stakeholders in a variety of forums. Through our longstanding Chase Advisory Panel program, we facilitate regular conversations among senior JPMorgan Chase executives and consumer policy groups, non-profit organizations, civic leaders, trade associations and diverse chambers of commerce, many of which are sources of information and ideas about how the Firm can promote racial equity through our products, services and approaches. In addition, in 2021 we created Community Engagement and National Stakeholder and Policy Engagement teams to further local engagement and two-way dialogue with stakeholders. 52 INTRODUCTION ENVIRONMENTAL SOCIAL GOVERNANCE Corporate Governance and ESG Oversight Stakeholder Engagement Risk Management Data Privacy and Cybersecurity Business Ethics Political Engagement and Public Policy ESG REPORT APPENDICES
Stakeholder Group How We Engage SHAREHOLDERS We engage shareholders on important topics including corporate governance, shareholder rights, executive compensation and sustainability. • We communicate to shareholders through our Annual Report and Proxy Statement, Securities and Exchange Commission filings, press releases and the Firm’s website. In addition, we engage with shareholders through quarterly earnings calls, investor meetings and conferences, annual shareholder meetings and other forums. We conduct a formal shareholder outreach program focused on topics including corporate governance, shareholder rights, executive compensation and sustainability. In these meetings, management shares information and provides updates on these topics, addresses questions and solicits shareholders’ perspectives and feedback. Directors participate in these meetings as appropriate. Following each shareholder outreach program, shareholders’ areas of focus and feedback are shared with the Board. • In 2021, we had approximately 90 engagements with nearly 70 shareholders, representing approximately 46% of the Firm’s outstanding common stock. • We also engage in dialogue with shareholders outside these more formal channels. These engagements provide us with useful feedback, which we consider when developing the Firm’s processes, practices and strategic direction. REGULATORS AND POLICYMAKERS We strive to maintain an open, ongoing dialogue with our global supervisory regulators and other policymakers. We believe that responsible corporate citizenship demands a strong commitment to a healthy and informed democracy through civic and community involvement. • We engage with policymakers on a range of issues, including banking, financial services, cybersecurity, workforce development, small business, tax, trade and inclusive economic growth, among others. We engage with regulators as necessary to conduct business and provide commentary on proposed changes to relevant regulations affecting our business. ESG RATERS We recognize that our clients, shareholders and other stakeholders are interested in our performance on a range of ESG matters. We regularly engage with ESG raters to provide them with information relevant to the Firm. • We engage in open, transparent dialogue with rating agencies in order to better understand their methodologies and scoring, correct discrepancies and provide feedback. Our Corporate Sustainability and Investor Relations teams manage our relationships with ESG rating agencies and lead our efforts to identify and implement enhancements to policies, procedures and practices that can improve our ESG performance and address any known issues. • We also spend time and resources to educate relevant internal stakeholders about ESG ratings so they are prepared to respond to questions from clients about the subject. RESEARCH ANALYSTS We strive to meet the information needs of members of the investment community, including both financial and ESG analysts and researchers. • We provide extensive information to members of the investment community, including both financial and ESG analysts and researchers, through reports, presentations, quarterly earnings, regulatory filings, conferences and publications on our website. In addition, we respond to surveys and specific information requests, and engage with analysts and researchers through calls and meetings. SUPPLIERS We engage in dialogue with our key suppliers on topics including our ability to operate efficiently and effectively, deliver products and services that meet our clients’ and customers’ needs, manage risk and controls and drive our diversity, equity and inclusion agenda. • We interact with our key suppliers on a frequent basis through various channels, including regular business reviews, ad hoc meetings, phone, town halls and email. We are committed to holding our suppliers to high standards of business conduct and integrity, and we work together to make a positive impact in the communities where we do business. 53 INTRODUCTION ENVIRONMENTAL SOCIAL GOVERNANCE Corporate Governance and ESG Oversight Stakeholder Engagement Risk Management Data Privacy and Cybersecurity Business Ethics Political Engagement and Public Policy ESG REPORT APPENDICES
Risk Management Risk is an inherent part of JPMorgan Chase’s business activities. When the Firm extends a loan, advises customers and clients on their investments, makes markets in securities, or offers other products or services, we take on some degree of risk. Our overall objective is to manage our businesses, and the associated risks, in a way that serves our clients, customers and investors while protecting the safety and soundness of the Firm. We focus on understanding different types of risk, as well as what drives such risks and their potential impacts. We generally divide risks into four categories: strategic risk, credit and investment risk, market risk and operational risk. Each line of business and Treasury and CIO is responsible for the ongoing identifying of risks, as well as the design and execution of controls to manage those risks. The Independent Risk Management ("IRM") function establishes the Firm’s risk- management frameworks. It also reviews and challenges risks identified by the lines of business and corporate risk management areas. IRM also implements policy and standards with respect to its own processes. The independent status of the IRM function is supported by a governance structure that provides for escalation of risk issues to senior management, the Firmwide Risk Committee and the Board of Directors, as appropriate. For more information on the Firm’s overall approach to risk management, see our Annual Report and Form 10-K. Managing Environmental and Social Risks Our world today faces serious environmental and social challenges, such as climate change, deforestation, lack of water quality and availability, waste generation, human rights issues and the impact of development on communities, that if not adequately addressed could create risks for society and businesses. We recognize that our business decisions have the potential to impact the environment and surrounding communities. This is why understanding our clients’ approach to, and performance on, environmental and social matters is an important component of our risk management process, as it helps us make more informed risk decisions, serve our customers responsibly and safeguard our financial resilience. Internal risk policies and standards indicate certain sectors, activities and financial products (primarily for capital markets and lending transactions) subject to environmental and social due diligence, which are evaluated as part of the first and second line of defense processes. IRM may recommend measures to mitigate environmental and social risk – such as enhanced disclosure, changes to transaction documentation or improved performance standards. CLIMATE RISK Climate change is one of the most critical challenges facing society and the environment today. JPMorgan Chase is committed to understanding how climate change may influence the risks it manages. This includes evaluating how our businesses, and the activities of our clients and customers, could be impacted through transition or physical risks driven by climate change. Our resiliency planning approach focuses on preparing for the impacts to locations, people, technology and suppliers. We have developed an internal risk classification system that projects how various climate-risk drivers – including physical risks such as extreme weather events, and transition risk as society moves toward net-zero emissions – can translate into potential impacts for our clients, customers and Firm. This system informs our understanding of how climate risk could materialize across the four major risk types we manage: strategic, market, operational and credit and investment risk. We assess these impacts against considerations such as time horizon, business sector and geography to better understand how these risks may emerge within our Firm. The Firm has a dedicated Climate Risk team, which is led by our Firmwide Risk Executive for Climate Risk. The team establishes our internal approach to managing climate risk, including developing relevant policies and standards as well as building our approach to climate risk data. The Climate Risk team collaborates with stakeholders across the Firm to integrate climate considerations into line-of-business risk management frameworks. We plan to disclose additional detail on our efforts to integrate climate risk into our Firmwide risk management framework in a standalone climate report which we plan to publish later this year. HUMAN RIGHTS RISK Identifying and managing human rights risk is another key area of interest for our stakeholders. JPMorgan Chase supports fundamental human rights across our lines of business and in each region of the world in which we operate. We are guided by the United Nations Universal Declaration of Human Rights and the Guiding Principles on Business and Human Rights as the overarching framework for corporations to respect human rights in their own operations and through their business relationships. We have a range of policies and procedures that pertain to human rights issues, including modern slavery and Indigenous Peoples, across our business and supply chain. We also publish a Modern Slavery Act Statement annually, which outlines practices and policies we have in place to mitigate the potential risk of modern slavery occurring in our business and supply chain. Additional information on our management of environmental and social risks, including publicly available policies and statements, can be found on our website . 54 INTRODUCTION ENVIRONMENTAL SOCIAL GOVERNANCE Corporate Governance and ESG Oversight Stakeholder Engagement Risk Management Data Privacy and Cybersecurity Business Ethics Political Engagement and Public Policy ESG REPORT APPENDICES
Data Privacy and Cybersecurity As digital solutions play an ever-larger role in financial services and the economy as a whole, the risk of cyber-attacks and other threats to information security continues to evolve and grow. In addition, the individuals with whom the Firm interacts expect that our data practices are safe and lawful. Data privacy and cybersecurity therefore remain top priorities for our Firm. At the same time, greater reliance on remote work due to the COVID-19 pandemic has only further underscored the importance of safe digital solutions and data practices. and remediation activities in the Firm. The Firm’s privacy framework outlines roles and responsibilities, sets compliance risk management controls in the form of policies and standards, directs advisory requests, and provides protocols for monitoring, reporting and escalation of key privacy risks and issues. The program reports periodically to our management, including our Board of Directors. Our multi-stakeholder approach to oversight and governance is embedded in our three lines of defense and supported by dedicated data and privacy teams around the world. We provide regular training and awareness to our workforce, not only on core privacy obligations and how to meet them, but also on emerging risks, trends and new developments. Information on how we collect, process, use, share and disposition personal information, as well as rights that individuals may have with respect to their personal information and how to exercise them, is available on our websites and upon request through multiple channels. In addition to traditional privacy notices, we often publish related materials such as frequently asked questions and tips for keeping personal financial information safe. We have a wide range of technological, administrative, organizational and physical security measures designed to safeguard the confidentiality, integrity and availability of personal information. Our Code of Conduct and related policies include specific guidelines on how employees should protect customers’ confidential information. We have established processes and procedures to report and respond to suspected or actual data privacy incidents that may compromise the confidentiality, integrity or availability of personal information. We provide our employees the ability to make reports through our internal systems. Our centralized process requires escalation to a dedicated incident response team for severity assessment, mitigation, root cause analysis and corrective action. In accordance with the Firm's policies, we notify individuals and our regulators of data incidents. Data Privacy As a global financial institution, our Firm collects, processes, uses, shares and dispositions all manner of personal information and financial data every day, and we have processes to manage that data in accordance with the laws, rules and regulations of the countries in which we operate. We take a multi-faceted approach to addressing privacy and data protection risks, including maintaining and evolving our internal controls, establishing policies covering all stages of the data lifecycle and deploying appropriate technology. Our Firmwide internal policy on personal information applies globally to our legal entities as well as third parties that handle personal information on our behalf. The policy sets forth minimum requirements including that personal information is processed for defined purposes. The policy also specifies the use of privacy by design principles, designed to ensure that privacy is taken into account throughout the data lifecycle. Data protection and privacy are key components of our global data risk management program. That program focuses on execution of the compliance and operational risk oversight of data management and privacy governance, controls 55 INTRODUCTION ENVIRONMENTAL SOCIAL GOVERNANCE Corporate Governance and ESG Oversight Stakeholder Engagement Risk Management Data Privacy and Cybersecurity Business Ethics Political Engagement and Public Policy ESG REPORT APPENDICES
38 Industry best practices include; ISACA COBIT, ISO 27000 standards, FFIEC guidance, the Information Security Forum Standard for Good Practice, NIST SP800-53 and BSIMIM. Cybersecurity JPMorgan Chase experiences numerous attempted cyber-attacks on its computer systems, software, networks and other technology assets on a daily basis from various actors, including groups acting on behalf of hostile countries, cyber- criminals, “hacktivists” (i.e., individuals or groups that use technology to promote a political agenda or social change) and others. regulations. With a large number of employees continuing to work offsite, we are taking additional measures to mitigate cyber risks posed by our increased use of remote access and third-party video conferencing. The Global Cybersecurity and Technology Controls ("CTC") organization, working with each of our lines of business and corporate functions, identifies technology and cybersecurity risks and is responsible for the controls to manage these threats. CTC assesses changes in global threats and monitors our operations to detect and respond to them. We also conduct periodic internal assessments to identify vulnerabilities, upgrade opportunities and new defense layers, and our cybersecurity incident response plan enables us to react to attempted breaches, coordinate our response with law enforcement and notify customers, when applicable. The CTC organization’s efforts are overseen by management at multiple levels including technology management, greater Firmwide management and the Firm’s Operating Committee. The Board of Directors is updated periodically on our Information Security Program and any recommended changes, cybersecurity policies and practices, and ongoing efforts to improve security, as well as on our efforts regarding significant cybersecurity events. In addition to internal capabilities, we leverage external resources to strengthen our defenses. Our cybersecurity controls, governance and practices are based on recognized industry best practices. We also have adopted the Financial Sector Profile from the Cyber Risk Institute, which provides the framework by which these various best practices are aligned with and integrated into our technology and cybersecurity standards. These standards meet the requirements of more than 150 regulators worldwide and are periodically updated. We also engage third parties to independently evaluate our capabilities and identify areas for improvement. 38 External auditors periodically review our IT programs and processes, and regulators periodically inspect and review our program in the countries where we operate. We also discuss cybersecurity risks with law enforcement, government officials, peer groups and trade associations. Cyber-attacks are a threat not just to our Firm, but also to our clients and the global financial system. We have increased our efforts to educate shareholders and customers about the importance of disciplined cyber hygiene and protecting themselves against fraud. We also contribute to efforts to build and maintain systemic resiliency. We are a member of the Financial Services Information Sharing & Analysis Center , an intelligence-sharing cooperative for the financial services industry. Its 16,000 users in more than 70 countries share best practices and exercises to better secure the sector for the benefit of the public and the resiliency and integrity of financial institutions. Our Firm also helped create the Analysis and Resilience Center for Systemic Risk, an industry-funded nonprofit organization designed to mitigate systemic risk to the nation’s critical energy and financial infrastructure. JPMorgan Chase also participates in public-private partnerships and, over the course of 2021, was engaged on policy issues related to operational collaboration, including incident notification, software bill of materials, zero trust and evolving U.S. National Institute of Standards and Technology ("NIST") standards. We will continue to advocate for policy to protect the global financial system as a whole, as well as improving the nation’s cybersecurity. As threats to cybersecurity grow in size and sophistication, protecting our Firm, customers and vendors while enabling innovation is an important, evolving priority. When we enter new businesses and adopt new technologies, these risks and challenges multiply. This is why we devote significant, diverse resources to cybersecurity. Our efforts are designed to stop malicious actors from infiltrating our computer systems to destroy data, obtain confidential information, disrupt service, engage in “ransomware” or cause other damage. For example, through the CB we provide clients with resources and educational content to help them fight and prevent fraud losses, such as a client ransomware guide and business email compromise toolkit. To help safeguard the confidentiality, integrity and availability of our infrastructure, resources and information, we maintain a robust Information Security Program. It establishes policies and procedures to prevent, detect and respond to cyber-attacks. Because every employee serves as the first line of defense, we educate, train and test all our employees on how to identify potential cybersecurity risks, protect the Firm’s resources and information, and report any unusual activity or incidents. Every employee is required to complete cybersecurity training on an annual basis and we undertake quarterly Firmwide phishing tests. We also require certain third-party vendors to comply with minimum security and control standards, our Supplier Code of Conduct, and all applicable laws and 56 INTRODUCTION ENVIRONMENTAL SOCIAL GOVERNANCE Corporate Governance and ESG Oversight Stakeholder Engagement Risk Management Data Privacy and Cybersecurity Business Ethics Political Engagement and Public Policy ESG REPORT APPENDICES
Business Ethics We strive to be accountable, straightforward and honest in our dealings with customers, employees, suppliers, shareholders and other stakeholders. Our Code of Conduct , Business Principles a nd other internal policies and procedures are designed to promote a culture of respect that allows every employee to feel safe at work and empowered to speak up if they have concerns about unethical behavior. Code of Conduct Our Code of Conduct highlights the personal responsibility of every employee to operate with the highest standards of integrity, transparency and ethical conduct. It emphasizes the importance of avoiding real and perceived conflicts of interest, protecting confidential information and maintaining a workplace that is free from threats, intimidation and physical harm. All employees must complete Code training shortly after their start date and annually thereafter, and each year employees must affirm their compliance with the Code. In general, consultants, agents and contract or temporary workers are expected to comply with the underlying principles of the Code. An additional Code of Ethics for Financial Professionals applies to the CEO, Chief Financial Officer ("CFO") and other finance, accounting, corporate treasury, tax and investor relations roles. We reinforce these expectations through various channels including Culture of Respect trainings, encouraging our senior leaders to communicate about these issues with employees, through town-hall meetings and by including culture- and conduct-related questions in our employee surveys. Acting with integrity is one criterion used to evaluate employees during their annual reviews. Employees are required to raise concerns about misconduct and report any potential or actual violations of the Code of Conduct, other Firm policies or any applicable law or regulation. Employees, directors, suppliers and customers can report known or suspected violations to our Conduct Hotline via phone, online or mobile device. The Hotline is anonymous, except in certain non-U.S. jurisdictions where anonymous reporting is prohibited. It is operated by a third-party service provider and is accessible 24/7 worldwide, with translation services available. The Code of Conduct prohibits intimidation or retaliation against anyone who raises an issue in good faith or assists with an investigation. Reporting obligations to the company do not prevent employees from reporting to the government or regulators conduct that they believe violates the law. It is our Firm's policy to promptly review all potential violations and take action as appropriate. Confidentiality will be maintained to the extent possible consistent with investigations. Ethics and culture are key focus areas of our Board of Directors. The Board’s Compensation & Management Development Committee oversees the governance framework that underpins our Firmwide culture of ethics and receives regular updates from management, including regarding any significant conduct issues should they occur. This committee holds a periodic joint session with the Risk Committee in which directors are briefed by senior management on conduct- related matters. The Audit Committee periodically receives reports on the Code of Conduct program and helps the Board maintain compliance with the Firm’s ethical standards, policies, plans and procedures, laws and regulations. Advancing Principles and Policies for Responsible AI The use of AI and machine learning technologies in financial services is quickly expanding. From optimiz - ing analysis, trading, and enhancing credit under - writing to strengthening customer service and improving fraud detection, the range of potential applications is extensive and can bring benefits for multiple stakeholders. However, these technologies also carry unique risks, such as the potential for unintended bias or new threats to data security and privacy. JPMorgan Chase is committed to upholding and promoting high standards of responsibility and ethics in AI. As part of this effort, we have actively participated in the Business Roundtable AI Initiative, which has published a set of key principles and pol - icy recommendations to guide responsible develop - ment and use of AI. 57 INTRODUCTION ENVIRONMENTAL SOCIAL GOVERNANCE Corporate Governance and ESG Oversight Stakeholder Engagement Risk Management Data Privacy and Cybersecurity Business Ethics Political Engagement and Public Policy ESG REPORT APPENDICES
ANTI-CORRUPTION AND BRIBERY Our Firm has zero tolerance for bribery and corruption. Our global Anti-Corruption Policy prohibits offering or giving anything of value to – and soliciting or accepting anything of value from – anyone for a corrupt purpose, such as improper payments or benefits to government officials or private parties for a business advantage. The program includes a governance structure managed by anti-corruption professionals with senior management oversight, training and awareness activities and monitoring and testing for compliance. All employees are required to complete anti- corruption training annually. We are also committed to participating in international efforts to combat money laundering and the funding of terrorist activities. We have implemented a risk-based global Anti-Money Laundering Compliance Program designed to comply with anti-money laundering laws and regulations in the U.S. and other jurisdictions where we operate. We are also part of the Wolfsberg Group, an association of thirteen global banks which aims to develop frameworks and guidance for the management of financial crime risks, including the foundational Wolfsberg Anti-Money Laundering Principles for Private Banking. SUPPLY CHAIN AND RESPONSIBLE SOURCING Our suppliers are expected to demonstrate high standards of business conduct and integrity. Through our Supplier Code of Conduct, we set out our Business Principles that we expect our suppliers to adhere to, such as operational excellence, fairness and environmental and social responsibility. Our suppliers respond to annual targeted surveys and attestations, through which we monitor how well they manage issues such as labor practices, human rights, environmental management and occupational health and safety. We believe that the effective management of these issues, including adherence to applicable laws and regulations, reduces potential risk to both JPMorgan Chase and our suppliers. We have also set up a Supply Network collective, comprised of supplier-management stakeholders across the Firm including vendor management, sourcing and procurement and finance and business management, which aims to promote community, connectivity and collaboration as ways to improve JPMorgan Chase's supply chain. For more information on our efforts to improve supplier diversity, see page 40. RESPONSIBLE MARKETING We believe it is important to be clear and transparent in our advertising and marketing. The Firm seeks to comply with relevant U.S. federal regulation on responsible and fair marketing practices. Our sales employees are expected to communicate with customers in a clear, truthful and complete manner and to provide them with relevant information to make an informed decision. Our lines of business are required to have an established procedure for reviewing all new and revised marketing materials, terms and conditions, disclaimers and other customer communications to make sure they are fair, not misleading and in compliance with applicable regulations and requirements. 58 INTRODUCTION ENVIRONMENTAL SOCIAL GOVERNANCE Corporate Governance and ESG Oversight Stakeholder Engagement Risk Management Data Privacy and Cybersecurity Business Ethics Political Engagement and Public Policy ESG REPORT APPENDICES
Political Engagement and Public Policy JPMorgan Chase believes that responsible corporate citizenship demands a strong commitment to a healthy and informed democracy through civic and community involvement. Our business is subject to extensive laws and regulations, and changes to such laws can significantly affect how we operate, our revenues and the costs we incur. Because of the impact public policy can have on our businesses, employees, communities and customers, we engage with policymakers on a range of issues – including banking, financial services, cybersecurity, workforce development, small business, tax, trade and inclusive economic growth, among others – to advance and protect the long-term interests of the Firm. The Firm’s political engagement and public policy activities are managed by Global Government Relations. This organization and leadership helps us focus the Firm’s political engagement efforts on those public policy issues most relevant to the long- term interests of the Firm overall and to our clients and shareholders. Another important way we advocate for policy is through the JPMorgan Chase Policy Center, which works to publish sustainable, evidence-based policy solutions to drive inclusive economic growth in the U.S. and around the world. In 2021, we continued our focus on federal and state policy changes to remove barriers to employment for people with criminal backgrounds, as part of our Second Chance Agenda. We also focused on policies to enhance racial equity, expand opportunities for underserved communities and continue the economic recovery following the onset of the COVID-19 pandemic, such as expanding the Earned Income Tax and Child Tax Credits, modernizing unemployment insurance and increasing the minimum wage. We belong to several trade associations that advocate on major public policy issues of importance to the Firm and the communities we serve. The Firm’s participation as a member of these associations comes with the understanding that we may not always agree with all the positions of an association or its other members, and that we are committed to voicing our concerns as appropriate. The Public Responsibility Committee of our Board of Directors provides oversight of our positions and practices on public responsibility matters, including significant policies and practices regarding political contributions, major lobbying priorities and principal trade association memberships that relate to the Firm's public policy objectives. We aim to operate with the highest standards of public transparency in political spending. Our efforts have been recognized by the CPA-Zicklin Index of Corporate Political Disclosure and Accountability as a "Trendsetter" with an overall score of 97.14%. The Firm discloses on its website contributions made by the Firm's political action committees, contributions of corporate funds made in connection with ballot initiatives and information about our governance and oversight practices. 59 INTRODUCTION ENVIRONMENTAL SOCIAL GOVERNANCE Corporate Governance and ESG Oversight Stakeholder Engagement Risk Management Data Privacy and Cybersecurity Business Ethics Political Engagement and Public Policy ESG REPORT APPENDICES
ESG Report Appendices 60
List of Acronyms ABP Advancing Black Pathways AI Artificial Intelligence AHL Advancing Hispanics and Latinos API Asian & Pacific Islander AUM Assets Under Management AWM Asset & Wealth Management BRG Business Resource Group CAP Chase Advisory Panel CB Commercial Banking CCB Consumer & Community Banking CCT Center for Carbon Transition CDFI Community Development Financial Institution CEO Chief Executive Officer CFO Chief Financial Officer CIB Corporate & Investment Bank CIO Chief Investment Office CTC Cybersecurity and Technology Controls DEI Diversity, Equity and Inclusion EAC Energy Attribute Certificate EEO Equal Employment Opportunity EIDL Economic Injury Disaster Loan ESG Environmental, Social and Governance EV Electric Vehicle E-Waste Electronic Waste FHA Federal Housing Administration FDIC Federal Deposit Insurance Corporation FTTH Fiber to the Home GESRM Global Environmental and Social Risk Management GFANZ Glasgow Financial Alliance for Net Zero GHG Greenhouse Gas GMSC Global Markets Sustainability Center GRI Global Reporting Initiative GWh Gigawatt Hours HVAC Heating, Ventilation and Air Conditioning HCBUs Historically Black Colleges and Universities ICMA International Capital Market Association IPO Initial Public Offering IRM Independent Risk Management JESG J.P. Morgan ESG JPM DFI J.P. Morgan Development Finance Institution LGBT+ Lesbian, Gay, Bisexual, Transgender, plus all sexual and gender identities LEED Leadership in Energy and Environmental Design LIHTC Low-Income Housing Tax Credit LISC Local Initiatives Support Corporation LMI Low-to-Moderate Income MDI Minority Depository Institution MW Megawatts NDI National Disability Institute NIST National Institute of Standards and Technology NMTC New Markets Tax Credit NZAM Net Zero Asset Managers initiative NZBA Net-Zero Banking Alliance ODI Office of Disability Inclusion PPP Paycheck Protection Program REC Renewable Energy Certificates SASB Sustainability Accounting Standards Board SBA Small Business Administration SCBC Second Chance Business Coalition SDGs Sustainable Development Goals SEC Securities and Exchange Commission TCFD Task Force on Climate-related Financial Disclosures TFI The Fellowship Initiative WOTM Women on the Move U.K. United Kingdom U.S. United States 61 INTRODUCTION ENVIRONMENTAL SOCIAL GOVERNANCE ESG REPORT APPENDICES List of Acronyms Resources Global Reporting Initiative Index Sustainability Accounting Standards Board Index JPMorgan Chase Sustainable Bond Annual Report
Resources Annual Report and Proxy Awards and Recognition Board Committees Business Principles Carbon Compass Methodology Cen ter for Carbon Transition Code of Conduct (2021) Code of Ethics for Finance Professionals Cor porate Governance Principles Diversity, Equity & Inclusion Equa l Opportunity, Anti-Discrimination and Anti-Harassment Statement Env ironmental, Social and Governance Information Env ironmental Data FY2021 Hum an Rights Statement and Modern Slavery Act Statement JPMorgan Chase Institute JPMor gan Chase Policy Cent er J.P. Morgan Development Finance Institution Our Impact Raci al Equity Commitment Polit ical Engagement and Public Policy Statement Suppliers Sustainability Sustainable Development Target Approach Sustainable Investing (Asset Management) Sus tainable Investing (Global Private Bank) 62 INTRODUCTION ENVIRONMENTAL SOCIAL GOVERNANCE ESG REPORT APPENDICES List of Acronyms Resources Global Reporting Initiative Index Sustainability Accounting Standards Board Index JPMorgan Chase Sustainable Bond Annual Report
Global Reporting Initiative Index Source Key 2021 Form 10-K Environmental and Social Policy Framework 2021 ESG Report Appendices 2021 ESG Report Code of Conduct Modern Slavery Act Statement Code of Ethics for Finance Professionals 2022 Proxy Statement Corporate Governance Principles Weblinks FY2021 Environmental Data Reporting Status Fully reporting Partially reporting We assess and identify new or emerging ESG issues that could impact or be impacted by our Firm through discussions with subject matter experts from across our business, analyzing feedback we receive through our engagement with stakeholders, and monitoring of ESG trends and policy developments, disclosure standards and industry best practices. We have identified the following ESG topics as the most relevant to our business and of greatest interest to our stakeholders. • Environmental topics include; developing financial solutions that help address climate change and other environ - mental impacts; managing environmental and climate-related risks; minimizing the environmental impacts of our physical operations; and collaborating with organizations to advance sustainable development. • Social topics include; serving our customers; addressing human rights-related risks; developing financial solutions that improve quality of life and generate other positive social impacts; expanding economic opportunity in the communities where we do business; investing in our human capital; promoting diversity, equity and inclusion; and strengthening consumer financial health. • Governance topics include cultivating a strong risk and control environment; fostering a culture of transparency and ethical behavior; maintaining effective Board leadership and management processes; participating in political engagement and public policy; safeguarding privacy and cybersecurity. We have identified the following GRI topics as related to our key ESG topics: economic performance, indirect economic impacts, anti-corruption, anti-competitive behavior, energy, emissions, employment, training and education, diversity and equal opportunity, human rights assessment, local communities, public policy, product portfolio, audit, active ownership, marketing and labeling, customer privacy and socioeconomic compliance. The index below includes GRI indicators that are relevant to our business. Unless otherwise noted, all data and descriptions apply to our entire Firm and are as of or for the year ended December 31, 2021. 63 INTRODUCTION ENVIRONMENTAL SOCIAL GOVERNANCE ESG REPORT APPENDICES List of Acronyms Resources Global Reporting Initiative Index Sustainability Accounting Standards Board Index JPMorgan Chase Sustainable Bond Annual Report
Indicator Disclosure Title Reporting Status Source 2-1 Organizational details 2021 Form 10-K (p. 1, 34) 2021 ESG Report (p. 3) Who We Are 2-2 Enti tie s included in the organization’s sustainability reporting 2021 Form 10-K (p. 1) 2021 ESG Report (p. 3) 2-3 Re p orting period, frequency and con - tact point 2021 ESG Report (p. 5) Note: Reporting frequency is annually, and aligns to the Firm’s financial reporting period. Contact points: Sustainability Investor Relations 2-4 Re s tatements of information 2021 ESG Report (p. 7, footnote 3 ) 2-5 Exte rnal assurance Note: We did not seek external assurance for the contents of this report. 2-6 Activities, value chain, and other busi- ness relationships 2021 ESG Report (p. 3, 21–23, 40–48) 2021 Form 10-K (p. 34, 44, 61–80) Suppliers Who We Are Note: JPMorgan Chase does business with over 16,000 suppliers globally across a wide range of product/service categories. Our third party vendor spend is spread across categories such as real estate, professional services, tech- nology, marketing, document production, printing, ship- ping and travel, among others. 2-7 Employees 2021 ESG Report (p. 26) 2021 Form 10-K (p. 2) Work force Composition Disclosure 2-9 Go v ernance structure and composition Corporate Governance Principles 2021 ESG Report (p. 50) 2022 Proxy Statement (p. 7, 11, 13– 1 9, 24–26) Indicator Disclosure Title Reporting Status Source 2-10 Nomination and selection of the highest governance body 2022 Proxy Statement (p. 20–21) 2-11 Chair of the highest governance body 2022 Proxy Statement 2-12 Role of the highest governance body in overseeing the management of impacts 2021 Form (p. 5, 7, 22 –23) 10-K (p. 81–84) 2021 ESG Report (p. 54) 2022 Proxy Statement (p. 28 – 31) 2-13 Delegation of responsibility for manag- ing impacts 2021 ESG Report (p. 13, 27–29, 33, 50–51, 54) 2-14 Role of the highest governance body in sustainability reporting Note: Our Corporate Sustainability team, which reports to the Global Head of Corporate Responsibility, oversees the development of our sustainability reporting. 2-15 Conflicts of interest Code of Conduct Corporate Governance Principles 2022 Proxy Statement (p. 1 4 –18, 34–35) 2-16 Communication of critical concerns Corporate Governance Principles 2-17 Collective knowledge of the highest governance body 2022 Proxy Statement (p. 27) 2-18 Evaluation of the performance of the highest governance body 2022 Proxy Statement (p. 27) 2-19 Remuneration policies 2022 Proxy Statement (p. 38–83) 2-20 Process to determine remuneration 2022 Proxy Statement (p. 38–83) 2-21 Annual total compensation ratio 2022 Proxy Statement (p. 82) 2-22 Statement on sustainable development strategy 2021 ESG Report (p. 2) 64 INTRODUCTION ENVIRONMENTAL SOCIAL GOVERNANCE ESG REPORT APPENDICES List of Acronyms Resources Global Reporting Initiative Index Sustainability Accounting Standards Board Index JPMorgan Chase Sustainable Bond Annual Report
Indicator Disclosure Title Reporting Status Source 2-23 Policy commitments Code of Conduct Code of Ethics for Finance Pro f essionals Business Principles Human Rights 2-2 4 E mbedding policy commitments Code of Conduct Code of Ethics for Finance Pro f essionals Business Principles 2021 ESG Report (p. 51, 54, 57) Human Rights 2-2 5 P rocesses to remediate negative impacts Code of Conduct Corporate Governance Principles Environmental and Social Policy Fr a mework (p. 4 II.D, p. 5 II.E, p. 7 III, p. 8 IV, p. 9 V) 2021 ESG Report (p. 51–54, 57) Human Rights Modern Slavery Act Statement 2-2 6 M echanisms for seeking advice and raising concerns Code of Conduct Indicator Disclosure Title Reporting Status Source 2-27 Compliance with laws and regulations 2021 Form 10-K (Note 30 p. 290–293). Note on the Firm’s legal proceedings: JPMorgan Chase & Co. and/or its subsidiaries (collectively, the "Firm") are defendants or putative defendants in numerous legal pro- ceedings, including private civil litigations and regulatory/ government investigations. The litigations range from indi- vidual actions involving a single plaintiff to class action lawsuits with potentially millions of class members and cover a wide range of issues. Investigations involve both formal and informal proceedings, by both governmental agencies and self-regulatory organizations. These legal proceedings are at varying stages of adjudication, arbitra- tion or investigation, and involve each of the firm's lines of business and geographies and a wide variety of claims (including common law tort and contract claims and statu- tory antitrust, securities and consumer protection claims), some of which present novel legal theories. Based on cur- rent knowledge, the firm believes it has asserted meritori- ous defenses to the claims asserted against it in its cur- rently outstanding legal proceedings, intends to defend itself vigorously in all such matters. For further discussion, please refer to JPMorgan Chase & Co.'s publicly filed dis- closures, including its most recent Annual Report on Form 10-K and Quarterly Reports on Form 10-Q filed with the U.S. Securities and Exchange Commission (available at: https://jpmorganchaseco.gcs-web.com/financial-informa - t i o n / s e c- fi l i n g s ) . 2-28 Membership associations 2021 ESG Report (p. 12, 14, 56, 58) External memberships and co m mitments 2-29 Approach to stakeholder engagement 2021 ESG Report (p. 52–53) 2-30 Collective bargaining agreements Note: JPMorgan Chase supports employee rights and is committed to adherence to local laws regarding the free- dom of association and collective employee action. We also have relationships with trade unions and work coun- cils in the regions where we operate as well as through many of our vendors. Most JPMorgan Chase employees are not covered by collective bargaining agreements and no U.S.- based employees are subject to collective bargaining agreements. JPMorgan Chase’s Code of Conduct sets forth the Firm’s expectations for each employee. The Code of Conduct provides the principles that govern employee con- duct with clients, customers, shareholders and one another, as well as with the markets and communities in which JPMorgan Chase does business. Employees are encouraged to raise any concerns through multiple chan- nels identified in the Code of Conduct. 3-2 List of material topics See p. 63 of this appendix. 3-3 Management approach Note: Management of material topics is included in the rel- evant topical standards below. 65 INTRODUCTION ENVIRONMENTAL SOCIAL GOVERNANCE ESG REPORT APPENDICES List of Acronyms Resources Global Reporting Initiative Index Sustainability Accounting Standards Board Index JPMorgan Chase Sustainable Bond Annual Report
Indicator Disclosure Title Reporting Status So urce GRI 201: ECONOMIC PERFORMANCE (2016) 3-3 Management approach 2021 ESG Report (p. 20–24, 36–48) Impact 201 -1 D irect economic value generated and distributed 2021 ESG Report (p. 20–24, 36–48) 201-2 Financial implications and other risks and opportunities due to climate change 2021 Form 10-K (p. 8, 9, 15, 26, 29) 2021 ESG Report (p. 1 2–16) Note: In 2022, we intend to release a dedicated climate report, which will be informed by the recommendations of the TCFD, and which will include additional details on this topic. 201-3 Defined benefit plan obligations and other retirement plans 2021 Form 10-K (pp. 215–217) GRI 203: INDIRECT ECONOMIC IMPACTS (2016) 3-3 Management approach 2021 ESG Report (p. 20–24, 36–48) Impact 203 -1 I nfrastructure investments and services supported 2021 ESG Report (p. 20–24, 36–48) Impact 203 -2 S ignificant indirect economic impacts 2021 ESG Report (p. 20–24, 36–48) Impact GRI 205: ANTI-CORRUPTION (2016) 3-3 Management approach Code of Conduct Code of Ethics for Financial Prof e ssionals Corporate Governance Principles 2021 ESG Report (p. 5 7–58) 205-2 Communication and training about anti-corruption policies and procedures Note: All employees are required to complete anti- corruption training annually. 205-3 Confirmed incidents of corruption and actions taken 2021 Form 10-K (Note 30 p. 290–293) Refer to the note on the Firm’s legal proceedings (indicator 2–27). Indicator Disclosure Title Reporting Status Source GRI 206: ANTI-COMPETITIVE BEHAVIOR (2016) 3-3 Management approach Code of Conduct 2021 ESG Report (p. 5 7–58) 206-1 Legal actions for anti-competitive behavior, anti-trust, and monopoly practices 2021 Form 10-K (Note 30 p. 290–293) Refer to the note on the Firm’s legal proceedings (indicator 2–27). GRI 302: ENERGY 3-3 Management approach 2021 ESG Report (p. 17–18) 302-1 Energy consumption within the organization 2021 ESG Report (p. 17–18) FY2021 Environmental Data 302-4 Re duction of energy consumption 2021 ESG Report (p. 17–18) FY2021 Environmental Data GRI 303: WATER AND EFFLUENTS (2018) 3-3 Management approach 2021 ESG Report (p. 18–19) 303-3 Water withdrawal by source 2021 ESG Report (p. 18–19) FY2021 Environmental Data GRI 304: BIODIVERSITY (2016) 3-3 Management approach Environmental and Social Policy Framework (p. 3I, p. 4 II. D, p. 5 II.E.2, p. 8 IV) 304-2 Significant impacts of activities, products, and services on biodiversity 2021 ESG Report (p. 18–19) Environmental and Social Policy Fra m ework (p. 3 I, p. 4 II. D, p. 5 II.E.2, p. 8 IV) 66 INTRODUCTION ENVIRONMENTAL SOCIAL GOVERNANCE ESG REPORT APPENDICES List of Acronyms Resources Global Reporting Initiative Index Sustainability Accounting Standards Board Index JPMorgan Chase Sustainable Bond Annual Report
Indicator Disclosure Title Reporting Sta tus Source GRI 305: EMISSIONS (2016) 3-3 Management approach 2021 ESG Report (p. 17–18) 305-1 Direct (Sc ope 1) GHG emissions 2021 ESG Report (p. 17–28) FY2021 Environmental Data 30 5-2 Energy indirect (Scope 2) GHG emissions 2021 ESG Report (p. 17–18) FY2021 Environmental Data 30 5-3 Other indirect (Scope 3) GHG emissions 2021 ESG Report (p. 17–18) FY2021 Environmental Data 305 -4 GHG emissions intensity 2021 ESG Report (p. 17–18) FY2021 Environmental Data 305 -5 Reduction of GHG emissions 2021 ESG Report (p. 17–18) FY2021 Environmental Data GRI 306: WASTE (2020) 3-3 Management approach 2021 ESG Report (p. 18–19) 306-4 Waste diverted from disposal 2021 ESG Report (p. 18–19) FY2021 Environmental Data GRI 307: ENVIRONMENTAL COMPLIANCE (2016) 307-1 Non-compliance with environmental laws and regulations 2021 Form 10-K (Note 30 pp. 290–293). Refer to the note on the Firm’s legal proceedings (indicator 2–27). GRI 401: EMPLOYMENT (2016) 3-3 Management approach 2021 ESG Report (p. 30–35) Careers 40 1-2 Benefits provided to full-time employ - ees that are not provided to temporary or part-time employees 2021 ESG Report (p. 34–35) Indicator Disclosure Title Reporti ng Status Source GRI 404: TRAINING AND EDUCATION 3-3 Management approach 2021 ESG Report (p. 25–35, 55–57) 404-2 Programs for upgrading employee skills and transition assistance programs 2021 ESG Report (p. 32–33, 37–39) 404-3 Percentage of employees receiving reg - ular performance and career develop - ment reviews 2021 ESG Report (p. 32) GRI 405: DIVERSITY AND EQUAL OPPORTUNITY 3-3 Management approach Code of Conduct 2021 ESG Report (p. 25–29) Diversity and Inclusion 40 5-1 Diversity of governance bodies and employees 2021 Form 10-K (p. 2) 2021 ESG Report (p. 25–29) 2022 Proxy Statement (p . 13) Diversity and Inclusion Workforce Composition Disclosure 40 5-2 Ratio of basic salary and remuneration of women to men 2021 ESG Report (p. 34) GRI 406: NON-DISCRIMINATION (2016) 3-3 Management approach Code of Conduct 2021 ESG Report (p. 25–29, 57) Human Rights Diversity and Inclusion 67 INTRODUCTION ENVIRONMENTAL SOCIAL GOVERNANCE ESG REPORT APPENDICES List of Acronyms Resources Global Reporting Initiative Index Sustainability Accounting Standards Board Index JPMorgan Chase Sustainable Bond Annual Report
Indicator Disclosure Title Reporting Statu s Source GRI 409: FORCED OR COMPULSORY LABOR (2016) 3-3 Management approach Human Rights Environmental and Social Policy Fr a mework (p. 1 I, p. 9 V) GRI 412: HUMAN RIGHTS ASSESSMENT (2016) 3-3 Management approach Environmental and Social Policy Framework (p. 1 I, p. 9 V) 2021 ESG Report (p. 54) Human Rights Modern Slavery Act Statement Supplier Code of Conduct 412 -3 Significant investment agreements and contracts that include human rights clauses or that underwent human rights screening Environmental and Social Policy Framework (p. 9 V) 2021 ESG Report (p. 51, 54) Human Rights Modern Slavery Act Statement GRI 413: LOCAL COMMUNITIES (2016) 3-3 Management approach Code of Conduct Environmental and Social Policy Fr a mework (p. 1 I, p. 9 V) 2 Im p act 021 ESG Report (p. 6–10, 36–48) 413-1 Op e rations with local community engagement, impact assessments, and development programs 2021 ESG Report (p. 6–10, 36–48, 52–53) FS14 Initiatives to improve access to financial services for disadvantaged people 2021 ESG Report (p. 6–10, 21–24, 27–29, 31, 3 4 ) Impact Indicator Disclosure Title Reporting Status Source GRI 415: PUBLIC POLICY (2016) 3-3 Management approach 2021 ESG Report (p. 59) Political Engagement and Public Pol i cy Statement 415-1 Political contributions Political Engagement and Public Policy Statement FINANCIAL SERVICES SECTOR SUPPLEMENT (2008) PRODUCT PORTFOLIO 3-3 Management approach Environmental and Social Policy Framework (p. 3 I, p. 4 II.D, p. 5 II.E.2, p. 7 III, p. 8 IV, p. 9 V) 2021 ESG Report (p. 6–10, 12–16, 36– 48) Human Rights Impact FS7 Mo netary value of products and services designed to deliver specific social benefit 2021 ESG Report (p. 6–10, 36–48) Impact FS8 Mo netary value of products and ser - vices designed to deliver specific envi - ronmental benefit 2021 ESG Report (p. 6–10, 12–16) 68 INTRODUCTION ENVIRONMENTAL SOCIAL GOVERNANCE ESG REPORT APPENDICES List of Acronyms Resources Global Reporting Initiative Index Sustainability Accounting Standards Board Index JPMorgan Chase Sustainable Bond Annual Report
Indicator Disclosure Title Reporti ng Status Source AUDIT 3-3 Management approach Environmental and Social Policy Framework (p. 3 I, p. 4 II.D, p. 5 II.E.2, p. 7 III, p. 8 IV, p. 9 V) 2021 ESG Report (p. 54) FS -Audit Coverage and frequency of audits to assess implementation of environmen - tal and social policies and risk assess - ment procedures Environmental and Social Policy Framework (p. 3 I, p. 4 II.D, p. 5 II.E.2, p. 7 III, p. 8 IV, p. 9 V) 2021 ESG Report (p. 54) AC TIVE OWNERSHIP Voting policy(ies) applied to environmen - tal or social issues for shares over which the reporting organization holds the right to vote shares or advises on voting Proxy Information FS11 Percentage of assets subject to positive and negative environmental or social screening 2021 ESG Report (p. 54) Note: In 2021, approximately 9,464 transactions were screened using the internal E&S risk submission form, which led to 2,540 transactions (including loans, debt underwriting, equity underwriting and advisory services) being referred to the GESRM team for review because a potential environmental or social risk. Following the initial review, the GESRM team undertook detailed due diligence of approximately 1,938 of these transactions. Indicator Disclosure Title Repor ting Status Source GRI 417: MARKETING AND LABELING (2016) 3-3 Management approach 2021 ESG Report (p. 58) Note: Fair and transparent communications is an import- ant marketing communications topic for JPMorgan Chase, which we discuss on page 58 of our ESG report. GRI 418: CUSTOMER PRIVACY (2016) 3-3 Management approach Code of Conduct 2021 ESG Report (p. 55) Chase — Security Center J.P. Morgan—Privacy Policy 418 -1 Substantiated complaints concerning breaches of customer privacy and losses of customer data Note: It is JPMorgan Chase’s policy to follow U.S. and global laws regarding reporting breaches of customer data, including notices to individuals, regulators and other entities. In addition, JPMorgan Chase provides information regarding risks related to cyber in its SEC filings. GRI 419: SOCIOECONOMIC COMPLIANCE (2016) 3-3 Management approach Code of Conduct 2021 ESG Report (p. 50–51) 419 -1 Non-compliance with laws and regula - tions in the social and economic area 2021 Form 10-K (Note 30 pp. 290–293) Refer to the note on the Firm’s legal proceedings (indicator 2–27). 69 INTRODUCTION ENVIRONMENTAL SOCIAL GOVERNANCE ESG REPORT APPENDICES List of Acronyms Resources Global Reporting Initiative Index Sustainability Accounting Standards Board Index JPMorgan Chase Sustainable Bond Annual Report
Sustainability Accounting Standards Board Index The index below includes disclosures related to the Sustainability Accounting Standards Board (SASB) sector standards that are relevant to our business: Asset Management & Custody Activities; Commercial Banks; Consumer Finance; Investment Banking & Brokerage; and Mortgage Finance. Unless otherwise noted, all data and descriptions apply to our entire firm and are as of or for the year ended December 31, 2021. For additional information about the firm’s financial performance, please refer to the firm’s quarterly earnings materials as well as quarterly and annual reports on Form 10-Q and Form 10-K , respectively. Source Key 2021 Form 10-K 2021 ESG Report Code of Conduct 2022 Proxy Statement Code of Ethics for Finance Professionals Weblinks Corporate Governance Principles Metric Code Metric Source TOPICS IN MULTIPLE SECTOR STANDARDS TOPIC: BUSINESS ETHICS F N - A C-2 7 0 a . 2 F N - A C- 5 1 0 a . 1 FN-CB-510a.1 FN-CF-220a.2 FN-CF-270a.5 FN-IB-510a.1 FN-IB-510b.3 FN-MF-270a.3 FN-MF-270b.2 Total amount of monetary losses as a result of legal procee dings associated with: • Marketing and communication of financial product-related information to new and returning customers • Fraud, insider trading, anti-trust, anti- competitive behavior, market manipulation, malpractice or other related financial industry laws or regulations • Customer privacy • Selling and servicing of products • Professional integrity, including duty of care • Communications to customers or remuneration of loan originators • Discriminatory mortgage lending 2021 Form 10-K (Note 30 p. 290–293) Note on the Firm’s legal proceedings: JPMorgan Chase & Co. and/or its subsidiaries (collectively, the "firm") are defendants or putative defendants in numerous legal proceedings, including private civil litigations and regula- tory/government investigations. The litigations range from individual actions involving a single plaintiff to class action lawsuits with potentially millions of class members and cover a wide range of issues. Investigations involve both formal and informal proceedings, by both govern- mental agencies and self-regulatory organizations. These legal proceedings are at varying stages of adjudication, arbitration or investigation, and involve each of the firm's lines of business and geographies and a wide variety of claims (including common law tort and contract claims and statutory antitrust, securities and consumer protec- tion claims), some of which present novel legal theories. Based on current knowledge, the firm believes it has asserted meritorious defenses to the claims asserted against it in its currently outstanding legal proceedings, intends to defend itself vigorously in all such matters. For further discussion, please refer to JPMorgan Chase & Co.'s publicly filed disclosures, including its most recent Annual Report on Form 10-K and Quarterly Reports on Form 10-Q filed with the U.S. Securities and Exchange Commission (available at: https://jpmorganchaseco.gcs- web.com/financial-information/sec-filings ). F N - A C- 5 1 0 a . 2 FN-CB-510a.2 FN-IB-510a.2 Description of whistleblower policies and procedures Code of Conduct 2021 ESG Report (p. 57) TO P IC: DATA SECURITY FN-CB-230a.2 FN-CF-230a.3 Description of approach to identifying and address - ing data security risks 2021 Form 10-K (p. 7, 144–145) 2021 ESG Report (p. 55–56) TO P IC: EMPLOYEE DIVERSITY AND INCLUSION F N - A C-3 3 0 a . 1 FN-IB-330a.1 Percentage of gender and racial/ethnic group repre - sentation for (1) executive management, (2) non-ex - ecutive management, (3) professionals and (4) all other employees 2021 ESG Report (p. 26) 70 INTRODUCTION ENVIRONMENTAL SOCIAL GOVERNANCE ESG REPORT APPENDICES List of Acronyms Resources Global Reporting Initiative Index Sustainability Accounting Standards Board Index JPMorgan Chase Sustainable Bond Annual Report
Metric Code Metric Source TOPIC: SYSTEMIC RISK MANAGEMENT FN-CB-550a.1 FN-IB-550a.1 Global Systemically Important Bank (G-SIB) score, by category 2021 Form 10-K (p. 90) Banking Organization Systemic Ri sk Report (FR Y-15) FN-CB-550a.2 FN-IB-550a.2 Description of approach to incorporation of results of mandatory and voluntary stress tests into capital adequacy planning, long-term corporate strategy and other business activities 2021 Form 10-K (p. 86–96) ASSET MANAGEMENT & CUSTODY ACTIVITIES TOPIC: TRANSPARENT INFORMATION & FAIR ADVICE FOR CUSTOMERS F N - A C-2 7 0 a . 3 Description of approach to informing customers about products and services 2021 ESG Report (p. 6–10, 12–16) Client Service Business Principles TO P IC: INCORPORATION OF ENVIRONMENTAL, SOCIAL AND GOVERNANCE FACTORS IN INVESTMENT MANAGEMENT & ADVISORY F N - A C- 41 0 a . 1 Amount of assets under management, by asset class, that employ (1) integration of environmental, social, and governance (ESG) issues, (2) sustainability themed investing and (3) screening 2021 ESG Report (p. 6–10, 12–16) Asset Management Sustainable In vesting F N - A C- 41 0 a . 2 Description of approach to incorporation of environ - mental, social and governance (ESG) factors in investment and/or wealth management processes and strategies 2021 ESG Report (p. 6–10, 12–16) Asset Management Investment Ste w ardship Wealth Management Sustainable Inv esting F N - A C- 41 0 a . 3 Description of proxy voting and investee engagement policies and procedures Proxy Information Metric Code Metric Source TOPIC: ACTIVITY METRICS FN-AC-000.A (1) Total registered and (2) total unregistered assets under management (AUM) 2021 Form 10-K (p. 78) FN-AC-000.B Total assets under custody and supervision 2021 Form 10-K (p. 78) COMMERCIAL BANKS TOPIC: FINANCIAL INCLUSION & CAPACITY BUILDING FN-CB-240a.1 (1) Number and (2) amount of loans outstanding qualified to programs designed to promote small business and community development 2021 Form 10-K (p. 48) 2021 ESG Report (p. 40–42) FN - CB-240a.4 Number of participants in financial literacy initiatives for unbanked, underbanked or underserved customers 2021 ESG Report (p. 46) TOP IC: INCORPORATION OF ENVIRONMENTAL, SOCIAL AND GOVERNANCE FACTORS IN CREDIT ANALYSIS FN-CB-410a.1 Commercial and industrial credit exposure, by industry 2021 Form 10-K (p. 194–195) FN-CB-410a.2 Description of approach to incorporation of environ - mental, social and governance (ESG) factors in credit analysis 2021 ESG Report (p. 12–16, 51, 54) Carbon Compass Methodology FN- C B-000.B (1) Number and (2) value of loans by segment: (a) personal, (b) small business and (c) corporate 2021 Form 10-K (Note 12 p. 229–247) CONSUMER FINANCE TOPIC: SELLING PRACTICES FN-CF-270a.1 Percentage of total remuneration for covered employees that is variable and linked to the amount of products and services sold Code of Conduct Corporate Governance Principles (S e ction 5.4) 2022 Proxy Statement (p . 3 6, 39) 71 INTRODUCTION ENVIRONMENTAL SOCIAL GOVERNANCE ESG REPORT APPENDICES List of Acronyms Resources Global Reporting Initiative Index Sustainability Accounting Standards Board Index JPMorgan Chase Sustainable Bond Annual Report
Metric Code Metric Source INVESTMENT BANKING & BROKERAGE TOPIC: INCORPORATION OF ENVIRONMENTAL, SOCIAL AND GOVERNANCE FACTORS IN INVESTMENT BANKING & BROKERAGE ACTIVITIES FN-IB-410a.2 (1) Number and (2) total value of investments and loans incorporating integration of environmental, social and governance (ESG) factors, by industry 2021 ESG Report (p. 12–16, 51, 54) FN-IB-410a.3 Description of approach to incorporation of environ - mental, social and governance (ESG) factors in investment banking and brokerage activities 2021 ESG Report (p. 12–16, 51, 54) Carbon Compass Methodology TOP IC: PROFESSIONAL INTEGRITY FN-IB-510b.4 Description of approach to ensuring professional integrity, including duty of care Code of Conduct Code of Ethics for Finance Pro fessionals 2021 ESG Report (p. 57–58) Conflict of Interest Policy TO PIC: EMPLOYEE INCENTIVES & RISK TAKING FN-IB-550b.3 Discussion of policies around supervision, control and validation of traders’ pricing of Level 3 assets and liabilities 2021 Form 10-K (p. 81–84, 149, Note 2 169–189) 2022 Proxy Statement (p . 39) Metric Code Metric Source MORTGAGE FINANCE TOPIC: DISCRIMINATORY LENDING FN-MF-270b.1 (1) Number, (2) value and (3) weighted average Loan- to-Value (LTV) ratio of mortgages issued to (a) minority and (b) all other borrowers, by FICO scores above and below 660 2021 Form 10-K (Note 12, p. 229–247) FN-MF-270b.3 Description of policies and procedures for ensuring nondiscriminatory mortgage origination Fair Lending Overview TOPIC: ACTIVITY METRICS FN-MF-000.A (1) Number and (2) value of mortgages originated by category: (a) residential and (b) commercial 2021 Form 10-K (p. 66, footnote e) 72 INTRODUCTION ENVIRONMENTAL SOCIAL GOVERNANCE ESG REPORT APPENDICES List of Acronyms Resources Global Reporting Initiative Index Sustainability Accounting Standards Board Index JPMorgan Chase Sustainable Bond Annual Report
JPMorgan Chase Sustainable Bond Annual Report As of February 28, 2022, the net proceeds of the Notes have been entirely allocated – in alignment with the criteria in our Framework for Eligible Green Projects – to nine renewable energy investments in wind, solar and geothermal projects across the U.S. These projects are collectively expected to produce approximately 7,000 gigawatt- hours of electricity annually, enough to supply approximately 650,000 homes with clean electricity each year. USE OF PROCEEDS AND EXPECTED IMPACT METRICS ,40 39 Key issuance metrics Issuer JPMorgan Chase & Co. Notes Fixed-to-Floating Rate Notes due 2025 Sustainable Type Green Bond Tranche Senior Settlement Date August 10, 2021 Principal Amount $1,250,000,000 Net Proceeds $1,246,875,000 Tenor 4 years CUSIP 46647PCM6 ISIN US46647PCM68 From time to time, JPMorgan Chase & Co. may issue green, social or sustainability bonds (collectively, “Sustainable Bonds”), which are issuances governed by our Sustainable Bond Framework (July 2020) (the “Framework”). We will allocate an amount equal to the net proceeds of any Sustainable Bond issuance to Eligible Green Projects or Eligible Social Projects (each as described in our Framework), or to a combination of Eligible Green Projects and Eligible Social Projects, as applicable. Through the end of 2021, JPMorgan Chase had issued three Sustainable Bonds under our Framework. We reported on the use of proceeds and expected impact metrics of our inaugural $1 billion green bond and inaugural $1 billion social bond issuances in our Green Bond Report (September 2021) and Social Bond Report (February 2022), respectively. Set forth below is our reporting on our third issuance: a green bond of $1.25 billion Fixed-to-Floating Rate Notes due 2025 (the “Notes”). Going forward, we intend to report on all Sustainable Bond issuances on an annual basis, within our annual ESG Report. Total Impact of Projects JPMorgan Chase’s Share of Impact 41 Project Type Number of Projects Funded Amount Allocated to Notes ($mm) 42 JPMorg an Chase’s Funded Share of Projects’ Total Valuation 43 Capacity (MW) 44 Annual Expected Generation / Output (GWh) 45 Annual Estimated Tons of CO 2 e Avoided 46 Capacity (MW) Annual Expected Generation / Output (GWh) Annual Estimated Tons of CO 2 e Avoided Wind 4 856 44% 1,552 5,922 4,409,384 672 2,538 1,844,434 Residential Solar 3 243 21% 245 285 218,263 51 60 46,111 Utility Solar 1 95 37% 200 387 234,605 74 143 8 7,01 3 Geothermal 1 59 24% 48 367 269,097 12 90 65,667 Total 9 $1,253 NM 2,045 6,960 5,131,349 809 2,832 2,043,225 39 Note: Numbers may not sum due to rounding. Residential Solar Projects represent programs of thousands of individual rooftop solar system installations. A Wind Project may represent a portfolio of one or more wind farms. 40 The expected impact metrics are presented in accordance with the recommendations set forth in the International Capital Market Association’s Handbook – Harmonized Framework for Impact Reporting (June 2021). All impact metrics presented in the Impact Metric Table are based on available actual data or estimated data. 41 Calculated based on JPMorgan Chase’s funded share of projects’ total estimated valuation. 42 Represents the funded amounts of Eligible Green Projects to which proceeds from the issuance of the Notes were allocated. Only amounts funded within the 24-month look back period under our Framework have been included. The total funded amount allocated with respect to the Eligible Green Projects referenced in the table ($1,253,158,287.45) reflects amounts actually disbursed by JPMorgan Chase, and such total funded amount exceeds the amount of net proceeds from the issuance of the Notes ($1,246,875,000). The management assertion on page 74 of this report is given with respect to the amount of net proceeds from the issuance of the Notes. 43 Represents JPMorgan Chase’s share of the project, based on the funded amounts of the Eligible Green Project allocated as a percentage of the project’s overall estimated valuation. 44 Based on nameplate capacity or capacity data in megawatts ("MW") provided by the program sponsor for residential solar systems. 45 Annual expected generation in gigawatt hours ("GWh") is based on project capacity and project specific capacity factors based on our internal estimates that take into account independent technical consultant assessments. 46 Annual estimated tons of CO 2 e avoided is based on annual expected generation and U.S. Environmental Protection Agency (EPA) 2020 Avoided Emissions Factors by region; if a project spans multiple regions, a national average was used for the applicable generation type. Measured in short tons. 73 INTRODUCTION ENVIRONMENTAL SOCIAL GOVERNANCE ESG REPORT APPENDICES List of Acronyms Resources Global Reporting Initiative Index Sustainability Accounting Standards Board Index JPMorgan Chase Sustainable Bond Annual Report
Management Assertion Management of JPMorgan Chase & Co. (“JPMorgan Chase”) asserts that, as of February 28, 2022, the net proceeds of $1,246,875,000 from the August 10, 2021 issuance of JPMorgan Chase’s Fixed-to-Floating Rate Notes due 2025 (the “Notes”) were allocated to refinance Eligible Green Projects. JPMorgan Chase is responsible for the completeness, accuracy and validity of this management assertion. For purposes of this assertion, Eligible Green Projects relate to projects for which JPMorgan Chase disbursed funds up to 24 months prior to the issuance of the Notes related to the development, construction, installation, operation, or acquisition of on-shore wind energy projects, solar energy projects, or geothermal energy projects. There were four on-shore wind energy projects, three residential solar energy projects, one utility solar energy project, and one geothermal energy project (as listed in the “Project Type” and “Number of Projects” columns within the table entitled “Use of Proceeds and Expected Impact Metrics” contained in this Sustainable Bond Annual Report). This Sustainable Bond Annual Report is included as an appendix to JPMorgan Chase’s 2021 Environmental, Social & Governance Report. The definition of Eligible Green Projects used in connection with the offering of the Notes and contained in JPMorgan Chase’s Sustainable Bond Framework (July 2020), to which reference is made within this Sustainable Bond Annual Report, specifies additional types of eligible green projects to which the proceeds of a green bond offering by JPMorgan Chase may be allocated. DISCLAIMER This report is not, does not contain and is not intended as an offer to sell or a solicitation of any offer to buy any securities issued by JPMorgan Chase. No representation is made as to the suitability of any issuance of green, social or sustainability bonds to fulfill environmental, social and sustainability criteria required by prospective investors. Eligible Green Projects and Eligible Social Projects may not satisfy an investor’s expectations concerning environmental, social or sustainability benefits, and may result in adverse impacts. The information contained herein is provided as of the date of this report, and JPMorgan Chase does not undertake to update any of such information. Wind Residential Solar Geothermal Utility Solar Case study: McGinness Hills JPMorgan Chase provided $59 million of tax equity to support Ormat Technologies Inc.’s McGinness Hills Phase 3 geothermal power plant in the Great Basin of Central Nevada, resulting in 48 MW of additional clean power to the grid. The McGinness Hills complex now has a total capacity of approximately 160 MW, making it the largest geothermal complex in Nevada and one of the largest in the United States. Geography of Solar, Wind and Geothermal Projects 74 INTRODUCTION ENVIRONMENTAL SOCIAL GOVERNANCE ESG REPORT APPENDICES List of Acronyms Resources Global Reporting Initiative Index Sustainability Accounting Standards Board Index JPMorgan Chase Sustainable Bond Annual Report
Third Party Attestation Report of Independent Accountants To the Management of JPMorgan Chase & Co. We have examined the management assertion of JPMorgan Chase & Co. (JPMorgan Chase) contained in this Sustainable Bond Annual Report, that as of February 28, 2022, the net proceeds of $1,246,875,000 from the August 10, 2021 issuance of JPMorgan Chase’s Fixed-to-Floating Rate Notes due 2025 were allocated to refinance Eligible Green Projects as defined in management’s assertion. JPMorgan Chase’s management is responsible for its assertion. Our responsibility is to express an opinion on management’s assertion based on our examination. Our examination was conducted in accordance with attestation standards established by the American Institute of Certified Public Accountants. Those standards require that we plan and perform the examination to obtain reasonable assurance about whether management’s assertion is fairly stated, in all material respects. An examination involves performing procedures to obtain evidence about management’s assertion. The nature, timing and extent of the procedures selected depend on our judgment, including an assessment of the risks of material misstatement of management’s assertion, whether due to fraud or error. We believe that the evidence we obtained is sufficient and appropriate to provide a reasonable basis for our opinion. Only the information included in the “Project Type” and “Number of Projects” columns and funded amounts up to $1,246,875,000 in the “Funded Amount Allocated to Notes” column within the table entitled “Use of Proceeds and Expected Impact Metrics” contained in this Sustainable Bond Annual Report is part of JPMorgan Chase’s management assertion and our examination engagement. This Sustainable Bond Annual Report is included as an appendix to JPMorgan Chase’s 2021 Environmental, Social & Governance Report (ESG Report). The other information in this Sustainable Bond Annual Report and JPMorgan Chase’s ESG Report have not been subjected to the procedures applied in our examination engagement, and accordingly, we make no comment as to its completeness and accuracy and do not express an opinion or provide any assurance on such information. In our opinion, management’s assertion that, as of February 28, 2022, the net proceeds of $1,246,875,000 from the August 10, 2021 issuance of the Fixed-to-Floating Rate Notes due 2025 were allocated to refinance Eligible Green Projects as defined in management’s assertion is fairly stated, in all material respects. New York, New York March 29, 2022 PricewaterhouseCoopers LLP, 300 Madison Avenue, New York, NY 10017 T: (646) 471 3000, F: (813) 286 6000, www.pwc.com/us 75 INTRODUCTION ENVIRONMENTAL SOCIAL GOVERNANCE ESG REPORT APPENDICES List of Acronyms Resources Global Reporting Initiative Index Sustainability Accounting Standards Board Index JPMorgan Chase Sustainable Bond Annual Report
DISCLAIMERS The information provided in this report reflects JPMorgan Chase’s approach to ESG as at the date of this report and is subject to change without notice. We do not undertake to update any of such information in this report. Any references to “sustainable investing”, “sustainable investments”, “ESG” or similar terms in this report are intended as references to the internally defined criteria of the Firm or our businesses only, as applicable, and not to any jurisdiction-specific regulatory definition. Our approach to inclusion of disclosures in this report is different from disclosures included in mandatory regulatory reporting, including under Securities and Exchange Commission (“SEC”) regulations. While this report describes events, including potential future events, that may be significant, any significance does not necessarily equate to the level of materiality of disclosures required under U.S. federal securities laws. This report contains forward-looking statements within the meaning of the Private Securities Litigation Reform Act of 1995. These statements are based on the current beliefs and expectations of JPMorgan Chase’s management and are subject to significant risks and uncertain - ties, many of which are beyond JPMorgan Chase’s control. Expected results or actions may differ from the anticipated goals and targets set forth in the forward-looking statements. Factors that could cause JPMorgan Chase’s actual results to differ materially from those described in the forward-looking statements can be found in JPMorgan Chase’s Annual Reports on Form 10-K, Quarterly Reports on Form 10-Q and Current Reports on Form 8-K filed with the SEC. Those reports are available on JPMorgan Chase’s website (https://jpmorganchaseco.gcs-web. com/financial-information/sec-filings) and on the Securities and Exchange Commission’s website (www.sec.gov). JPMorgan Chase does not undertake to update any forward-looking statements. No reports, documents or websites that are cited or referred to in this document shall be deemed to form part of this report. JPMorgan Chase is not responsible for the information contained on third-party websites, nor do we guarantee their accuracy and completeness. Contact Us To contact Sustainability, email [email protected] . To contact Investor Relations, email [email protected] . Information about J.P. Morgan’s capabilities can be found at jpmorgan.com and about Chase’s capabilities at chase.com. Information about JPMorgan Chase & Co. is available at jpmorganchase.com . “JPMorgan Chase,” “J.P. Morgan,” “Chase,” the Octagon symbol and other words or symbols in this report that identify JPMorgan Chase services are service marks of JPMorgan Chase & Co. Other words or symbols in this report that identify other parties’ goods or services may be trademarks or service marks of those other parties.