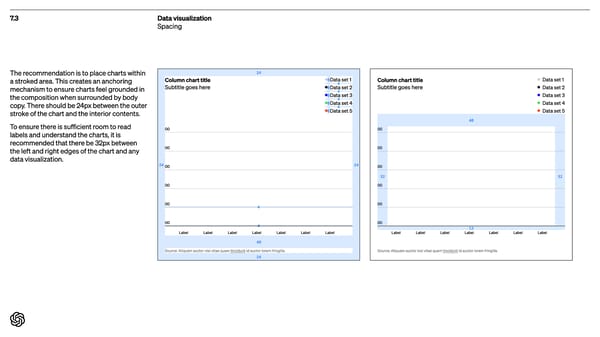
7.3 Data visualization Spacing The recommendation is to place charts within a stroked area . This creates an anchoring mechanism to ensure charts feel grounded in the composition when surrounded by body copy. There should be 24px between the outer stroke of the chart and the interior contents. To ensure there is sufficient room to read labels and understand the charts, it is recommended that there be 32px between the lef t and right edges of the chart and any data visualization. Column char t title Subtitle goes here Data set 1 Data set 2 Data set 3 Data set 4 Data set 5 4 0 00 00 00 00 00 00 1 2 L abel L abel L abel L abel L abel L abel L abel S ource: Aliquam auctor nisi vitae quam tincidunt id auctor lorem fringilla . 3 2 3 2 Column char t title Subtitle goes here 8 Data set 1 4 8 Data set 2 4 8 Data set 3 4 8 Data set 4 4 8 Data set 5 00 00 00 00 00 4 00 4 L abel L abel L abel L abel L abel L abel L abel 4 0 S ource: Aliquam auctor nisi vitae quam tincidunt id auctor lorem fringilla . 2 4 2 4 2 4 2 4
 Open AI Brand Book Page 88 Page 90