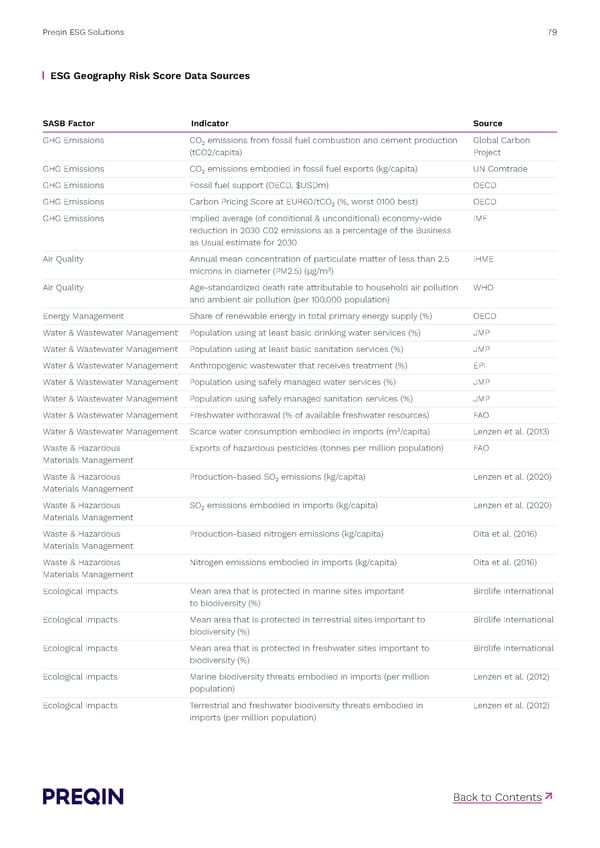
Preqin ESG Solutions 79 ESG Geography Risk Score Data Sources SASB Factor Indicator Source _____________________________________________________________________________________________________________________________________________________________________________________________________________________________________________________________________________________________________________________________________________________________________________________________________________________________________________ GHG Emissions CO₂ emissions from fossil fuel combustion and cement production Global Carbon (tCO2/capita) Project GHG Emissions CO₂ emissions embodied in fossil fuel exports (kg/capita) UN Comtrade GHG Emissions Fossil fuel support (OECD, $USDm) OECD GHG Emissions Carbon Pricing Score at EUR60/tCO₂ (%, worst 0100 best) OECD GHG Emissions Implied average (of conditional & unconditional) economy-wide IMF reduction in 2030 C02 emissions as a percentage of the Business as Usual estimate for 2030 Air Quality Annual mean concentration of particulate matter of less than 2.5 IHME microns in diameter (PM2.5) (μg/m³) Air Quality Age-standardized death rate attributable to household air pollution WHO and ambient air pollution (per 100,000 population) Energy Management Share of renewable energy in total primary energy supply (%) OECD Water & Wastewater Management Population using at least basic drinking water services (%) JMP Water & Wastewater Management Population using at least basic sanitation services (%) JMP Water & Wastewater Management Anthropogenic wastewater that receives treatment (%) EPI Water & Wastewater Management Population using safely managed water services (%) JMP Water & Wastewater Management Population using safely managed sanitation services (%) JMP Water & Wastewater Management Freshwater withdrawal (% of available freshwater resources) FAO Water & Wastewater Management Scarce water consumption embodied in imports (m³/capita) Lenzen et al. (2013) Waste & Hazardous Exports of hazardous pesticides (tonnes per million population) FAO Materials Management Waste & Hazardous Production-based SO₂ emissions (kg/capita) Lenzen et al. (2020) Materials Management Waste & Hazardous SO₂ emissions embodied in imports (kg/capita) Lenzen et al. (2020) Materials Management Waste & Hazardous Production-based nitrogen emissions (kg/capita) Oita et al. (2016) Materials Management Waste & Hazardous Nitrogen emissions embodied in imports (kg/capita) Oita et al. (2016) Materials Management Ecological Impacts Mean area that is protected in marine sites important Birdlife International to biodiversity (%) Ecological Impacts Mean area that is protected in terrestrial sites important to Birdlife International biodiversity (%) Ecological Impacts Mean area that is protected in freshwater sites important to Birdlife International biodiversity (%) Ecological Impacts Marine biodiversity threats embodied in imports (per million Lenzen et al. (2012) population) Ecological Impacts Terrestrial and freshwater biodiversity threats embodied in Lenzen et al. (2012) imports (per million population) ↗ Back to Contents
 Preqin ESG Solutions Methodology Page 78 Page 80