RELAYTO Best Practices for Analytics
Estimated reading time - 3 minutes | Guidelines about the analytics in RELAYTO for understanding your audiences preferences and behaviour
RELAYTO/ BEST PRACTICES FOR ANALYTICS Understand digital body language & engage in conversations with your audience. Academy
TABLE OF CONTENTS 1. Data-Driven Content Matters 7. Specific Metrics - Interactions 2. Accessing Analytics 6. Specific Metrics 3. Overview Metrics 5. Changing Time Frame 4. Specify Email Domain
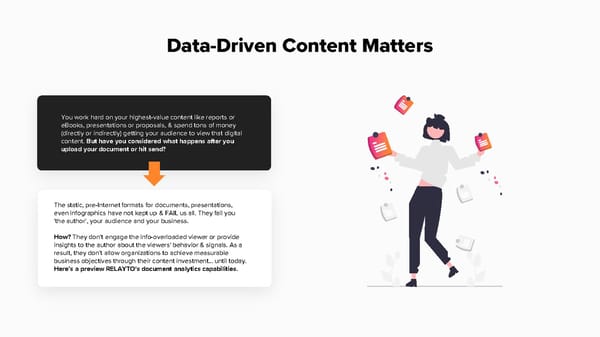
Data-Driven Content Matters You work hard on your highest-value content like reports or eBooks, presentations or proposals, & spend tons of money (directly or indirectly) getting your audience to view that digital content. But have you considered what happens after you upload your document or hit send? The static, pre-Internet formats for documents, presentations, even infographics have not kept up & FAIL us all. They fail you 'the author', your audience and your business. How? They don't engage the info-overloaded viewer or provide insights to the author about the viewers' behavior & signals. As a result, they don't allow organizations to achieve measurable business objectives through their content investment... until today. Here’s a preview RELAYTO's document analytics capabilities.
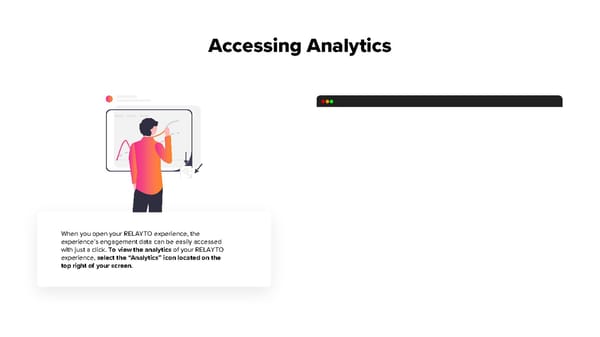
Accessing Analytics When you open your RELAYTO experience, the experience’s engagement data can be easily accessed with just a click. To view the analytics of your RELAYTO experience,select the “Analytics” icon located on the top right of your screen.
This is a modal window.
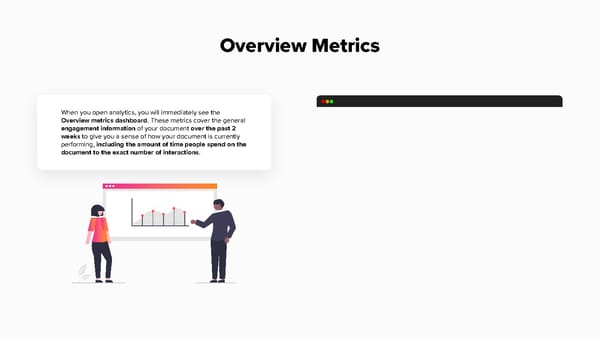
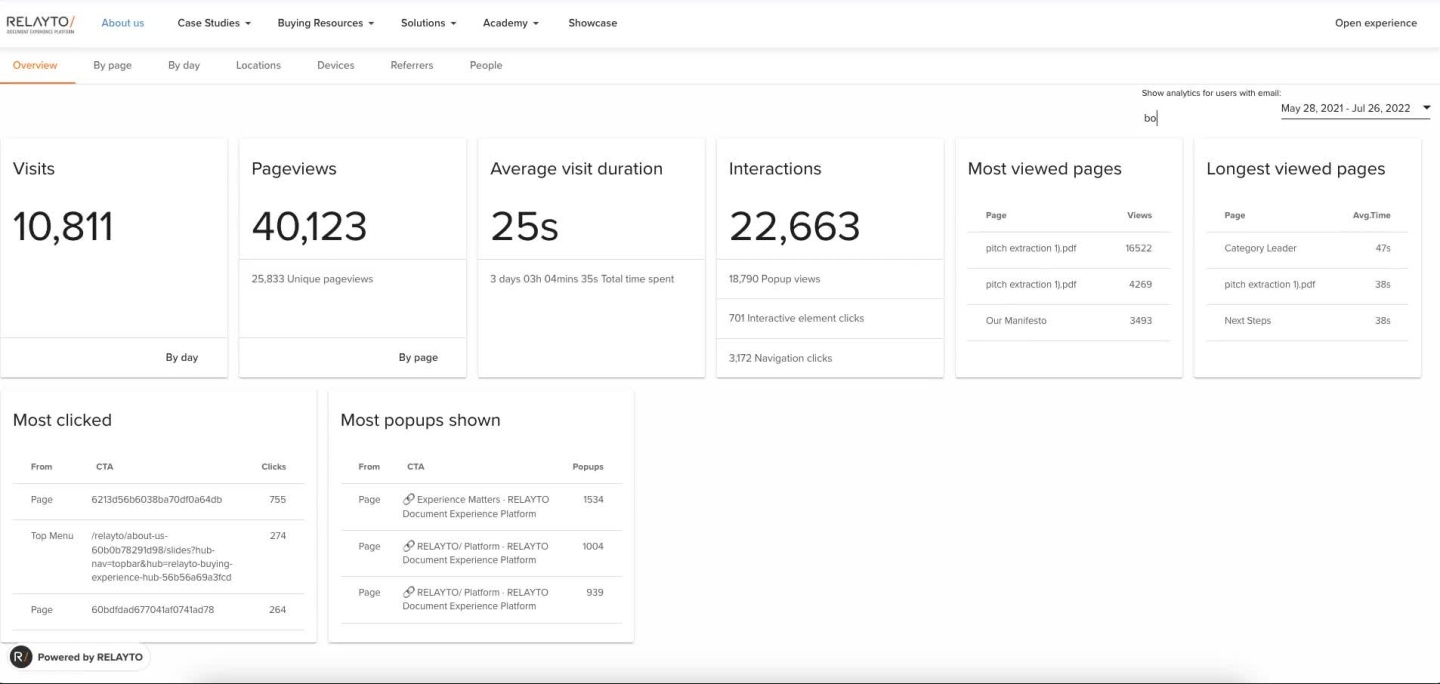
Overview Metrics When you open analytics, you will immediately see the Overview metrics dashboard. These metrics cover the general engagement information of your document over the past 2 weeks to give you a sense of how your document is currently performing, including the amount of time people spend on the document to the exact number of interactions.
This is a modal window.
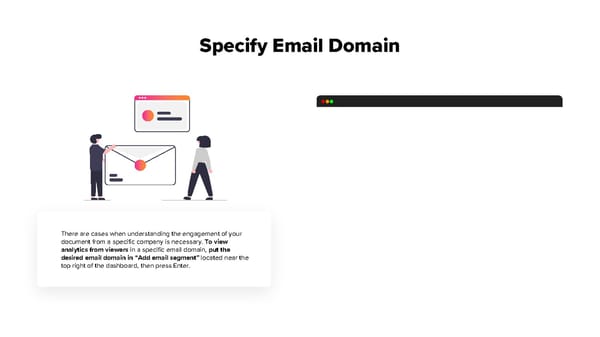
Specify Email Domain There are cases when understanding the engagement of your document from a specific company is necessary. To view analytics from viewers in a specific email domain, put the desired email domain in “Add email segment” located near the top right of the dashboard, then press Enter.
This is a modal window.
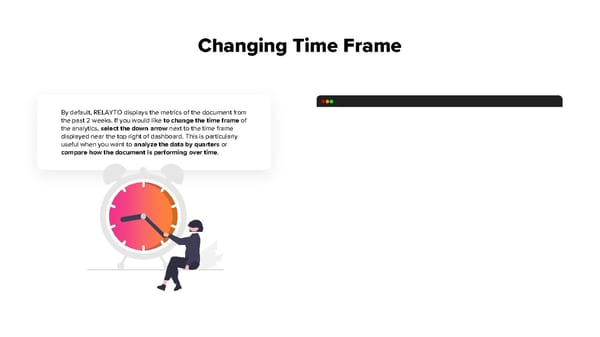
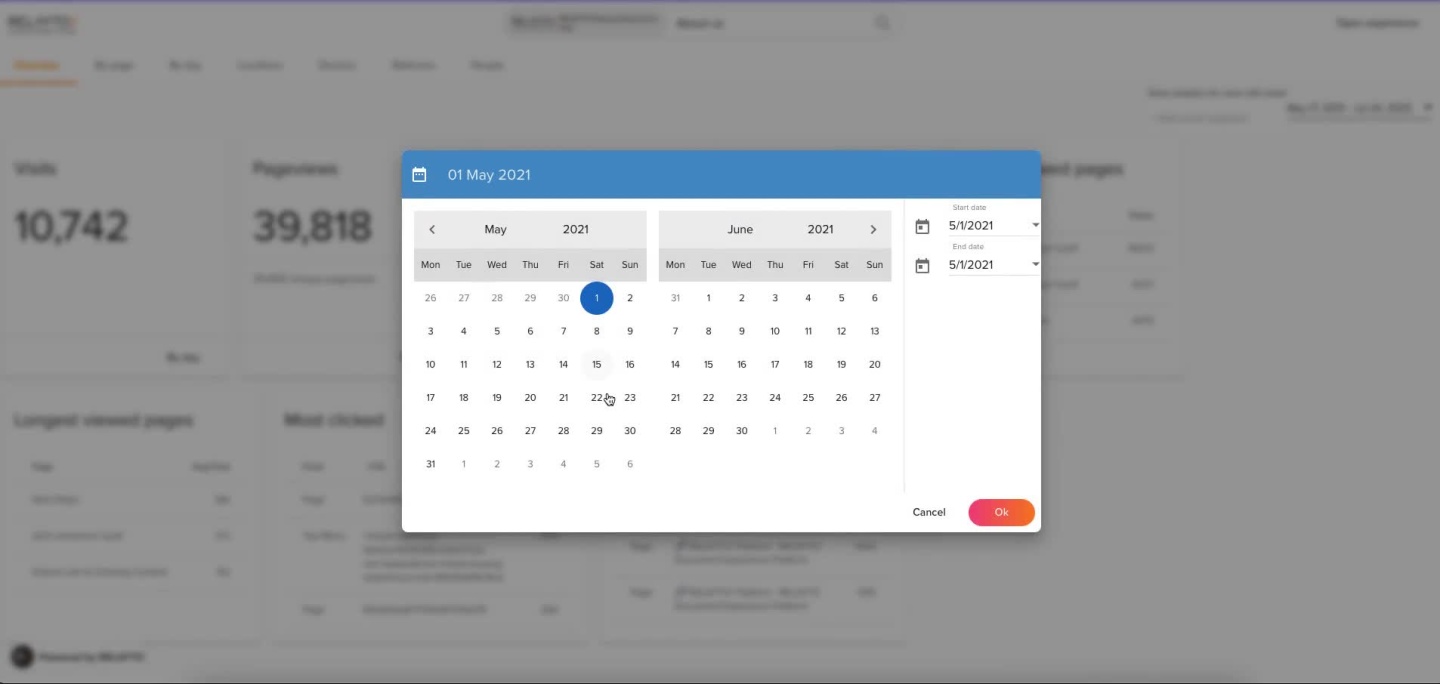
Changing Time Frame By default, RELAYTO displays the metrics of the document from the past 2 weeks. If you would like to change the time frame of the analytics, select the down arrow next to the time frame displayed near the top right of dashboard. This is particularly useful when you want to analyze the data by quarters or compare how the document is performing over time.
This is a modal window.
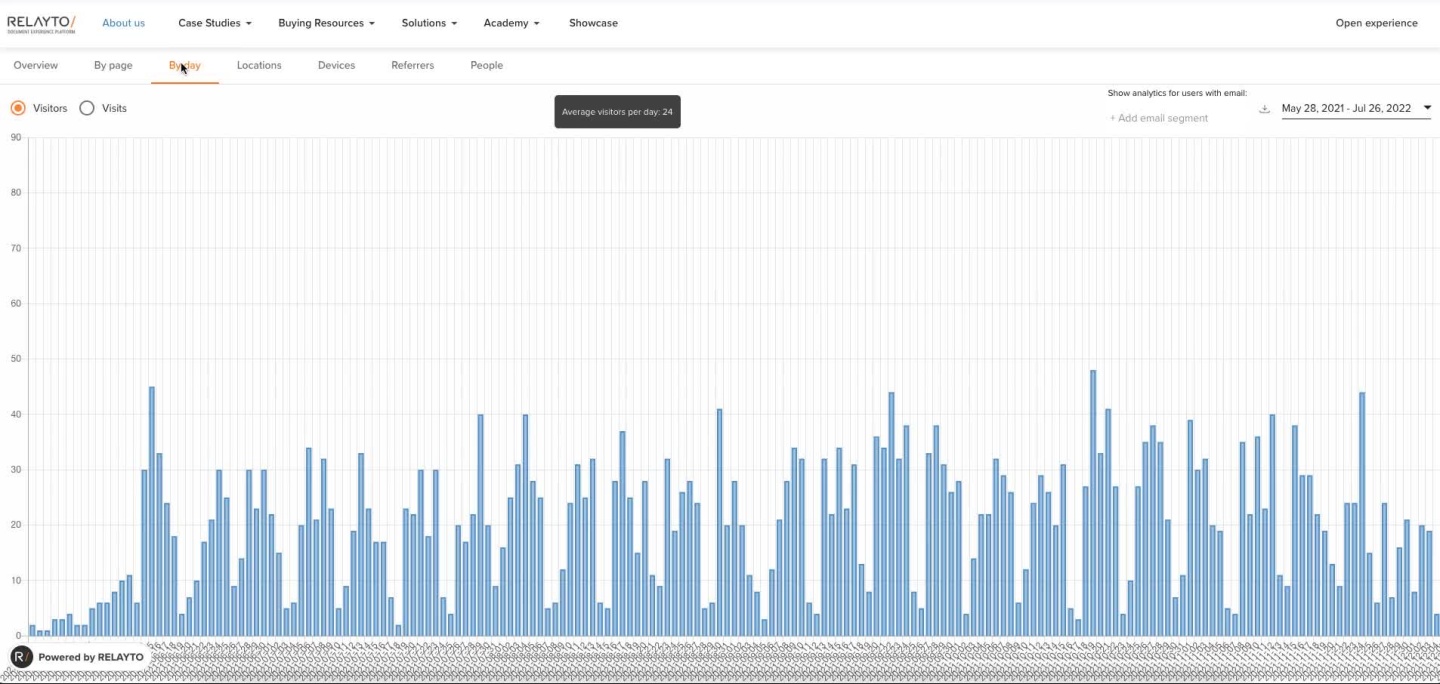
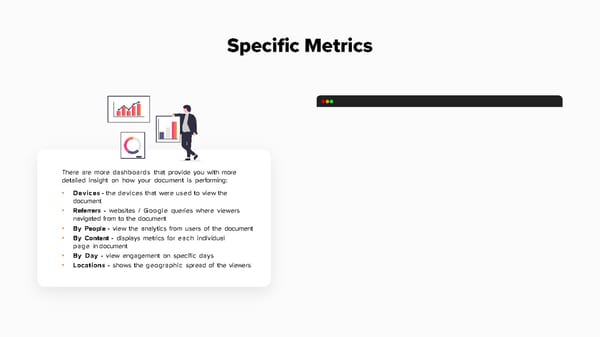
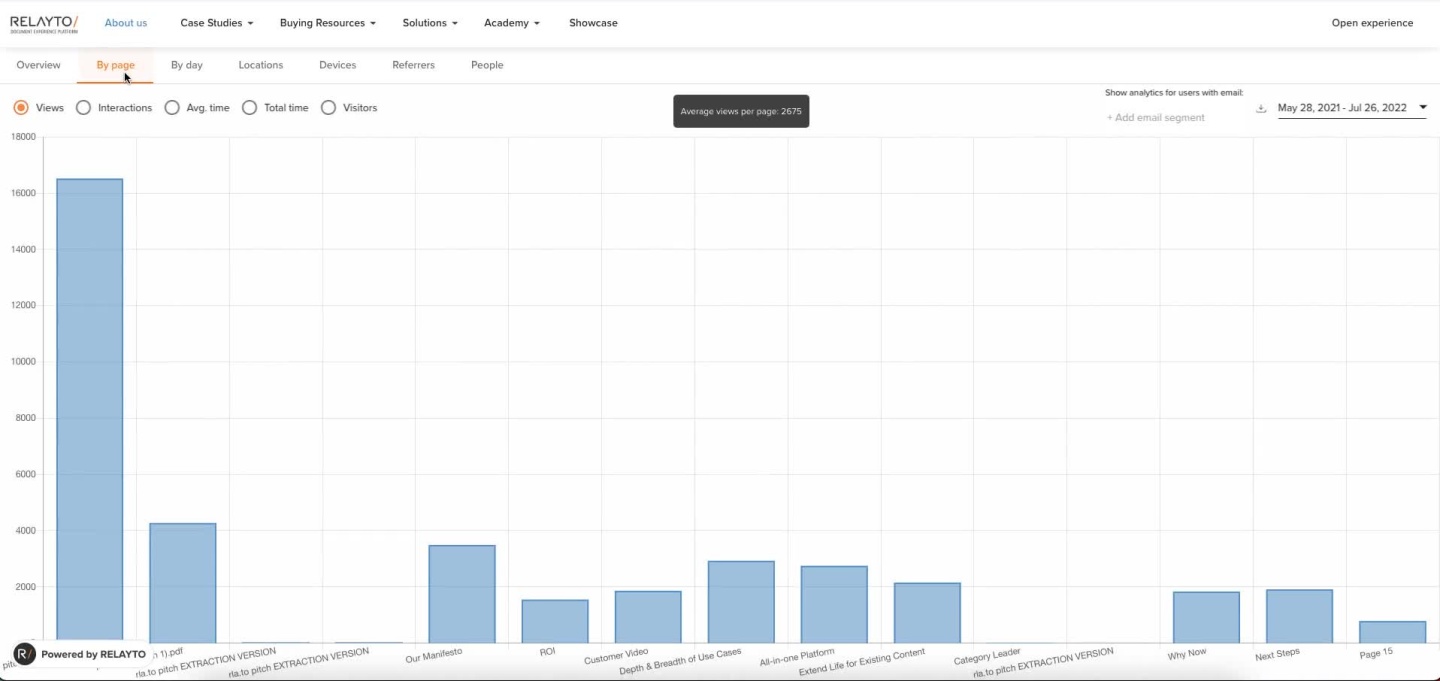
Specific Metrics There are more dashboards that provide you with more detailed insight on how your document is performing: • Devices- the devices that were used to view the document • Referrers - websites / Google queries where viewers navigated from to the document • By People - view the analytics from users of the document • By Content - displays metrics for each individual page in document • By Day - view engagement on specific days • Locations - shows the geographic spread of the viewers
This is a modal window.
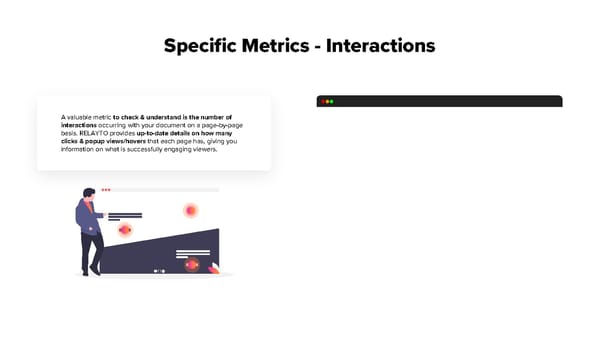
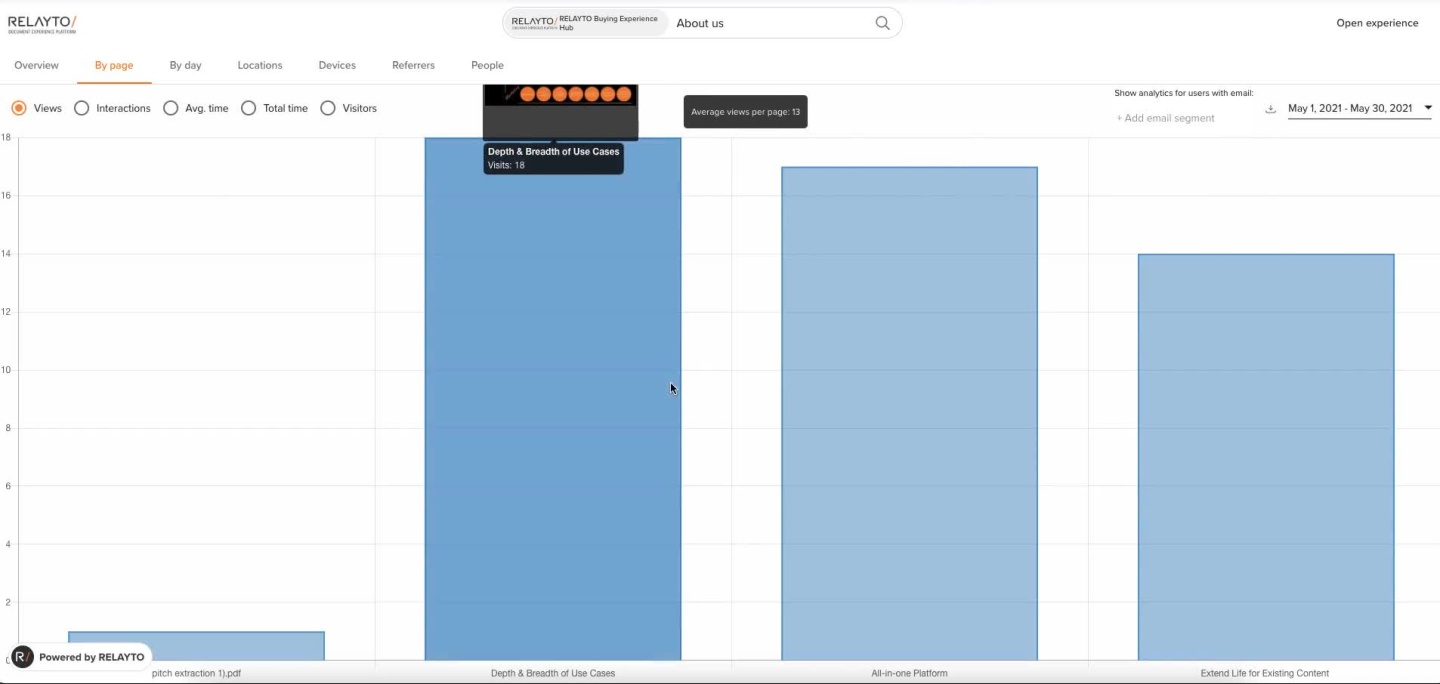
Specific Metrics - Interactions A valuable metric to check & understand is the number of interactions occurring with your document on a page-by-page basis. RELAYTO provides up-to-date details on how many clicks & popup views/hovers that each page has, giving you information on what is successfully engaging viewers.
This is a modal window.