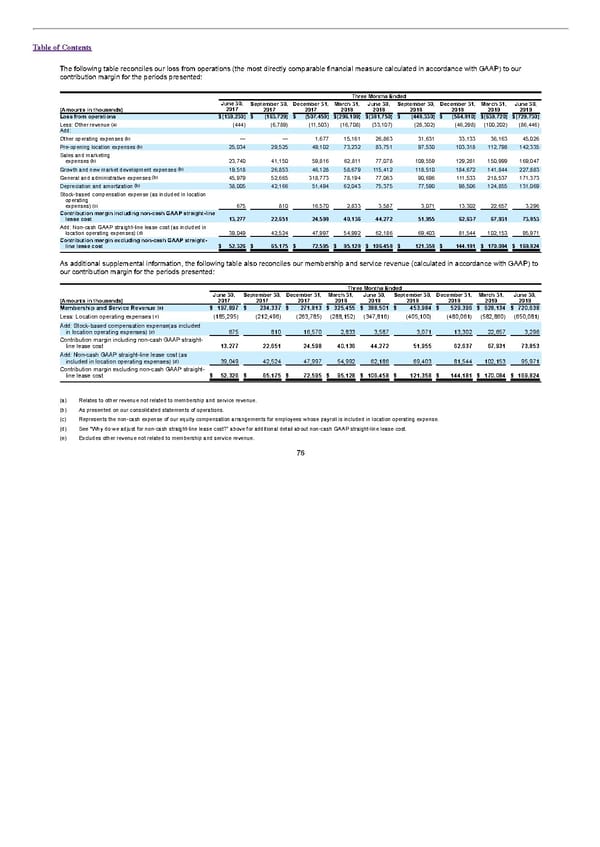
Table of Contents The following table reconciles our loss from operations (the most directly comparable financial measure calculated in accordance with GAAP) to our contribution margin for the periods presented: Three Months Ended June 30, September 30, December 31, March 31, June 30, September 30, December 31, March 31, June 30, (Amounts in thousands) 2017 2017 2017 2018 2018 2018 2018 2019 2019 Loss from operations $(139,230) $ (163,729) $ (507,459) $(296,109) $(381,750) $ (448,330) $ (564,810) $(639,720) $(729,730) (a) Less: Other revenue (444) (6,789) (11,503) (16,708) (33,107) (28,302) (46,298) (100,202) (86,446) Add: (b) Other operating expenses — — 1,677 15,161 26,863 31,631 33,133 36,163 45,026 (b) Pre-opening location expenses 25,034 29,525 49,102 73,232 83,751 97,530 103,318 112,798 142,335 Sales and marketing (b) expenses 23,740 41,150 59,816 62,811 77,078 109,559 129,281 150,999 169,047 (b) Growth and new market development expenses 19,518 26,853 46,128 58,679 115,412 118,510 184,672 141,844 227,883 (b) General and administrative expenses 45,979 52,665 318,773 78,194 77,063 90,696 111,533 218,537 171,373 (b) Depreciation and amortization 38,005 42,166 51,494 62,043 75,375 77,590 98,506 124,855 131,069 Stock-based compensation expense (as included in location operating (c) expenses) 675 810 16,570 2,833 3,587 3,071 13,302 22,657 3,296 Contribution margin including non-cash GAAP straight-line lease cost 13,277 22,651 24,598 40,136 44,272 51,955 62,637 67,931 73,853 Add: Non-cash GAAP straight-line lease cost (as included in (d) location operating expenses) 39,049 42,524 47,997 54,992 62,186 69,403 81,544 102,153 95,971 Contribution margin excluding non-cash GAAP straight- line lease cost $ 52,326 $ 65,175 $ 72,595 $ 95,128 $ 106,458 $ 121,358 $ 144,181 $ 170,084 $ 169,824 As additional supplemental information, the following table also reconciles our membership and service revenue (calculated in accordance with GAAP) to our contribution margin for the periods presented: Three Months Ended June 30, September 30, December 31, March 31, June 30, September 30, December 31, March 31, June 30, (Amounts in thousands) 2017 2017 2017 2018 2018 2018 2018 2019 2019 (e) Membership and Service Revenue $ 197,897 $ 234,337 $ 271,813 $ 325,455 $ 388,501 $ 453,984 $ 529,396 $ 628,134 $ 720,638 (b) Less: Location operating expenses (185,295) (212,496) (263,785) (288,152) (347,816) (405,100) (480,061) (582,860) (650,081) Add: Stock-based compensation expense(as included in location operating expenses) (c) 675 810 16,570 2,833 3,587 3,071 13,302 22,657 3,296 Contribution margin including non-cash GAAP straight- line lease cost 13,277 22,651 24,598 40,136 44,272 51,955 62,637 67,931 73,853 Add: Non-cash GAAP straight-line lease cost (as included in location operating expenses) (d) 39,049 42,524 47,997 54,992 62,186 69,403 81,544 102,153 95,971 Contribution margin excluding non-cash GAAP straight- line lease cost $ 52,326 $ 65,175 $ 72,595 $ 95,128 $ 106,458 $ 121,358 $ 144,181 $ 170,084 $ 169,824 (a) Relates to other revenue not related to membership and service revenue. (b) As presented on our consolidated statements of operations. (c) Represents the non-cash expense of our equity compensation arrangements for employees whose payroll is included in location operating expense. (d) See “Why do we adjust for non-cash straight-line lease cost?” above for additional detail about non-cash GAAP straight-line lease cost. (e) Excludes other revenue not related to membership and service revenue. 76
 S1 - WeWork Prospectus Page 80 Page 82