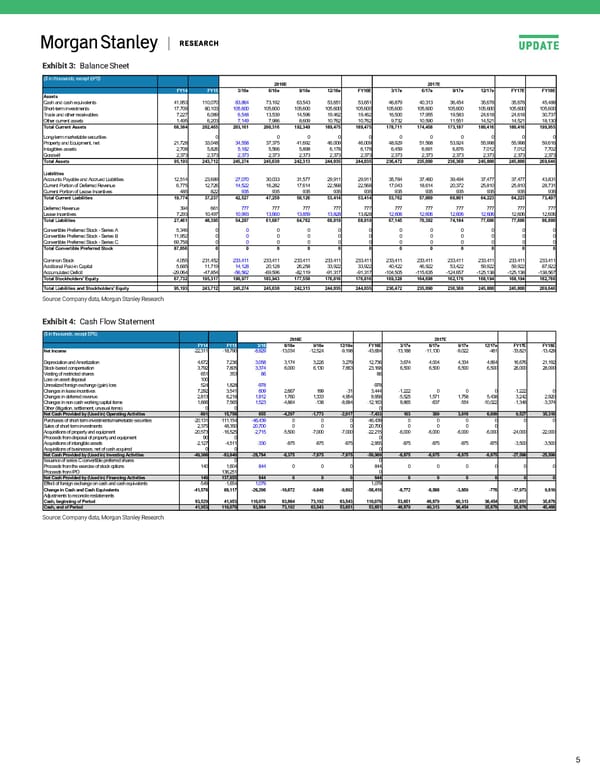
Exhibit 3: Balance Sheet ($ in thousands, except EPS) 2016E 2017E FY14 FY15 3/16e 6/16e 9/16e 12/16e FY16E 3/17e 6/17e 9/17e 12/17e FY17E FY18E Assets Cash and cash equivalents 41,953 110,070 83,864 73,192 63,543 53,651 53,651 46,879 40,313 36,454 35,678 35,678 45,488 Short-term investments 17,709 80,103 105,600 105,600 105,600 105,600 105,600 105,600 105,600 105,600 105,600 105,600 105,600 ,618 24,618 30,737 Trade and other receivables 7,227 6,089 6,548 13,539 14,596 19,462 19,462 16,500 17,955 19,583 24 Other current assets 1,495 6,203 7,149 7,986 8,609 10,762 10,762 9,732 10,590 11,551 14,521 14,521 18,130 Total Current Assets 68,384 202,465 203,161 200,316 192,349 189,475 189,475 178,711 174,458 173,187 180,416 180,416 199,955 Long-term marketable securities 0 0 0 0 0 0 0 0 0 0 0 Property and Equipment, net 21,728 33,048 34,558 37,375 41,692 46,009 46,009 48,929 51,568 53,924 55,998 55,998 59,616 66 5,898 6,178 6,178 6,459 6,691 6,876 7,012 7,012 7,702 Intagibles assets 2,708 5,826 5,182 5,5 Goodwill 2,373 2,373 2,373 2,373 2,373 2,373 2,373 2,373 2,373 2,373 2,373 2,373 2,373 Total Assets 95,193 243,712 245,274 245,630 242,313 244,035 244,035 236,472 235,090 236,360 245,800 245,800 269,646 Liabilities Accounts Payable and Accrued Liabilities 12,514 23,689 27,070 30,033 31,577 29,911 29,911 35,784 37,460 39,494 37,477 37,477 43,831 Current Portion of Deferred Revenue 6,775 12,726 14,522 16,282 17,614 22,568 22,568 17,043 18,614 20,372 25,810 25,810 28,731 Current Portion of Lease Incentives 485 822 935 935 935 935 935 935 935 935 935 935 935 Total Current Liabilities 19,774 37,237 42,527 47,250 50,126 53,414 53,414 53,762 57,009 60,801 64,223 64,223 73,497 Deferred Revenue 394 661 777 777 777 777 777 777 777 777 777 777 777 Lease incentives 7,293 10,497 10,993 13,660 13,859 13,828 13,828 12,606 12,606 12,606 12,606 12,606 12,606 Total Liabilities 27,461 48,395 54,297 61,687 64,762 68,019 68,019 67,145 70,392 74,184 77,606 77,606 86,880 Convertible Preferred Stock - Series A 5,346 0 0 0 0 0 0 0 0 0 0 0 0 Convertible Preferred Stock - Series B 11,952 0 0 0 0 0 0 0 0 0 0 0 0 Convertible Preferred Stock - Series C 69,758 0 0 0 0 0 0 0 0 0 0 0 0 Total Convertible Preferred Stock 87,056 0 0 0 0 0 0 0 0 0 0 0 0 11 Common Stock 4,055 231,452 233,411 233,411 233,411 233,411 233,411 233,411 233,411 233,411 233,411 233,411 233,4 Additional Paid-in Capital 5,685 11,719 14,128 20,128 26,258 33,922 33,922 40,422 46,922 53,422 59,922 59,922 87,922 Accumulated Deficit -29,064 -47,854 -56,562 -69,596 -82,119 -91,317 -91,317 -104,505 -115,635 -124,657 -125,138 -125,138 -138,567 Total Stockholders' Equity 67,732 195,317 190,977 183,943 177,550 176,016 176,016 169,328 164,698 162,176 168,194 168,194 182,766 45,630 242,313 244,035 244,035 236,472 235,090 236,360 245,800 245,800 269,646 Total Liabilities and Stockholders' Equity 95,193 243,712 245,274 2 Source: Company data, Morgan Stanley Research Exhibit 4: Cash Flow Statement ($ in thousands, except EPS) 2016E 2017E FY14 FY15 3/16 6/16e 9/16e 12/16e FY16E 3/17e 6/17e 9/17e 12/17e FY17E FY18E Net Income -22,311 -18,790 -8,929 -13,034 -12,524 -9,198 -43,684 -13,188 -11,130 -9,022 -481 -33,821 -13,429 Depreciation and Amortization 4,672 7,236 3,058 3,174 3,226 3,279 12,736 3,674 4,004 4,334 4,664 16,676 21,192 Stock-based compensation 3,792 7,805 3,374 6,000 6,130 7,663 23,168 6,500 6,500 6,500 6,500 26,000 28,000 Vesting of restricted shares 651 353 86 86 Loss on asset disposal 100 Unrealized foreign exchange (gain) loss 524 1,828 -978 -978 Changes in lease incentives 7,292 3,541 609 2,667 199 -31 3,444 -1,222 0 0 0 -1,222 0 Changes in deferred revenue 2,813 6,218 1,912 1,760 1,333 4,954 9,958 -5,525 1,571 1,758 5,438 3,242 2,920 Changes in non-cash working capital items 1,666 7,565 1,523 -4,864 -138 -8,684 -12,163 9,865 -637 -554 -10,022 -1,348 -3,374 Other (litigation, settlement, unusual items) 0 0 0 Net Cash Provided by (Used in) Operating Activities -801 15,756 655 -4,297 -1,773 -2,017 -7,433 103 309 3,016 6,099 9,527 35,310 Purchases of short-term investments/marketable securities -20,131 -111,154 -46,439 0 0 0 -46,439 0 0 0 0 0 0 Sales of short-term investments 2,375 48,350 20,700 0 0 0 20,700 0 0 0 0 Acquisitions of property and equipment -20,573 -16,525 -2,715 -5,500 -7,000 -7,000 -22,215 -6,000 -6,000 -6,000 -6,000 -24,000 -22,000 Proceeds from disposal of property and equipment 90 0 0 Acquisitions of intangible assets -2,127 -4,511 -330 -875 -875 -875 -2,955 -875 -875 -875 -875 -3,500 -3,500 Acquisitions of businesses, net of cash acquired 0 0 0 Net Cash Provided by (Used in) Investing Activities -40,366 -83,840 -28,784 -6,375 -7,875 -7,875 -50,909 -6,875 -6,875 -6,875 -6,875 -27,500 -25,500 Issuance of series C convertible preferred shares 0 0 Procee ds from the exercise of stock options 140 1,604 844 0 0 0 844 0 0 0 0 0 0 Proceeds from IPO 136,251 0 Net Cash Provided by (Used in) Financing Activities 140 137,855 844 0 0 0 844 0 0 0 0 0 0 Effect of foreign exchange on cash and cash equivalents -549 -1,654 1,079 1,079 Change in Cash and Cash Equivalents -41,576 68,117 -26,206 -10,672 -9,648 -9,892 -56,419 -6,772 -6,566 -3,859 -776 -17,973 9,810 Adjustments to reconcile restatements Cash, beginning of Period 83,529 41,953 110,070 83,864 73,192 63,543 110,070 53,651 46,879 40,313 36,454 53,651 35,678 Cash, end of Period 41,953 110,070 83,864 73,192 63,543 53,651 53,651 46,879 40,313 36,454 35,678 35,678 45,488 Source: Company data, Morgan Stanley Research 5
 Shopify: SHOP Delivered Page 4 Page 6