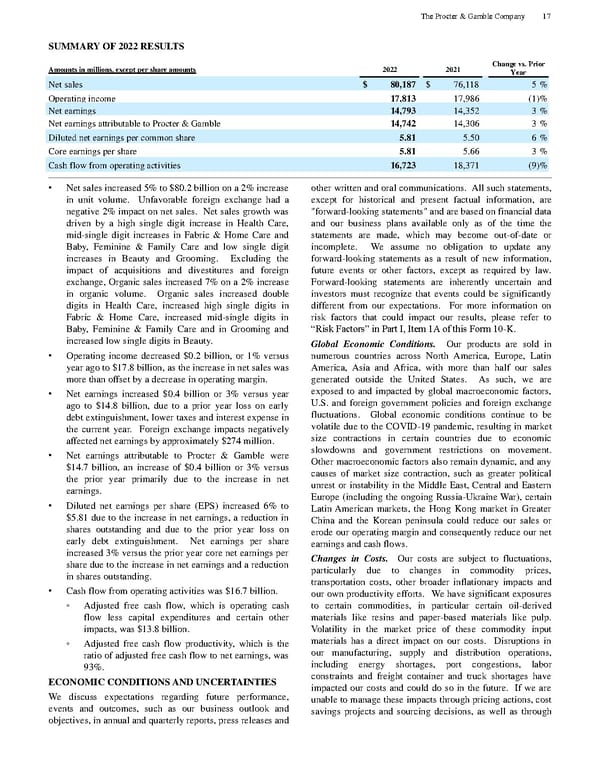
SUMMARY OF 2022 RESULTS Amounts in millions, except per share amounts 2022 2021 Change vs. Prior Year Net sales $ 80,187 $ 76,118 5 % Operating income 17,813 17,986 (1) % Net earnings 14,793 14,352 3 % Net earnings attributable to Procter & Gamble 14,742 14,306 3 % Diluted net earnings per common share 5.81 5.50 6 % Core earnings per share 5.81 5.66 3 % Cash flow from operating activities 16,723 18,371 (9) % • Net sales increased 5% to $80.2 billion on a 2% increase in unit volume. Unfavorable foreign exchange had a negative 2% impact on net sales. Net sales growth was driven by a high single digit increase in Health Care, mid - single digit increases in Fabric & Home Care and Baby, Feminine & Family Care and low single digit increases in Beauty and Grooming. Excluding the impact of acquisitions and divestitures and foreign exchange, Organic sales increased 7% on a 2% increase in organic volume. Organic sales i ncreased double digits in Health Care, increased high single digits in Fabric & Home Care, increased mid - single digits in Baby, Feminine & Family Care and in Grooming and increased low single digits in Beauty. • Operating income decreased $0.2 billion, or 1% versus year ago to $17.8 billion, as the increase in net sales was more than offset by a decrease in operating margin. • Net earnings increased $0.4 billion or 3% versus year ago to $14.8 billion, due to a prior year loss on early debt extingu ishment, lower taxes and interest expense in the current year. Foreign exchange impacts negatively affected net earnings by approximately $274 million . • Net earnings attributable to Procter & Gamble were $14.7 billion, an increase of $0.4 billion or 3% ve rsus the prior year primarily due to the increase in net earnings. • Diluted net earnings per share (EPS) increased 6% to $5.81 due to the increase in net earnings, a reduction in shares outstanding and due to the prior year loss on early debt extinguishment . Net earnings per share increased 3% versus the prior year core net earnings per share due to the increase in net earnings and a reduction in shares outstanding. • Cash flow from operating activities was $16.7 billion. ◦ Adjusted free cash flow, which is o perating cash flow less capital expenditures and certain other impacts, was $13.8 billion. ◦ Adjusted free cash flow productivity, which is the ratio of adjusted free cash flow to net earnings, was 93%. ECONOMIC CONDITIONS AND UNCERTAINTIES We discuss expe ctations regarding future performance, events and outcomes, such as our business outlook and objectives, in annual and quarterly reports, press releases and other written and oral communications. All such statements, except for historical and present fact ual information, are "forward - looking statements" and are based on financial data and our business plans available only as of the time the statements are made, which may become out - of - date or incomplete. We assume no obligation to update any forward - looki ng statements as a result of new information, future events or other factors, except as required by law. Forward - looking statements are inherently uncertain and investors must recognize that events could be significantly different from our expectations. For more information on risk factors that could impact our results, please refer to “Risk Factors” in Part I, Item 1A of this Form 10 - K. Global Economic Conditions. Our products are sold in numerous countries across North America, Europe, Latin America, A sia and Africa, with more than half our sales generated outside the United States. As such, we are exposed to and impacted by global macroeconomic factors, U.S. and foreign government policies and foreign exchange fluctuations. Global economic conditions continue to be volatile due to the COVID - 19 pandemic, resulting in market size contractions in certain countries due to economic slowdowns and government restrictions on movement. Other macroeconomic factors also remain dynamic, and any causes of market size contraction, such as greater political unrest or instability in the Middle East, Central and Eastern Europe (including the ongoing Russia - Ukraine War), certain Latin American markets, the Hong Kong market in Greater China and the Korean peninsula coul d reduce our sales or erode our operating margin and consequently reduce our net earnings and cash flows. Changes in Costs. Our costs are subject to fluctuations, particularly due to changes in commodity prices, transportation costs, other broader inflationary impacts and our own productivity efforts. We have significant exposures to certain commodities, in particular certai n oil - derived materials like resins and paper - based materials like pulp. Volatility in the market price of these commodity input materials has a direct impact on our costs. Disruptions in our manufacturing, supply and distribution operations, including e nergy shortages, port congestions, labor constraints and freight container and truck shortages have impacted our costs and could do so in the future. If we are unable to manage these impacts through pricing actions, cost savings projects and sourcing deci sions, as well as through The Procter & Gamble Company 17
 The Procter & Gamble Annual Report Page 28 Page 30