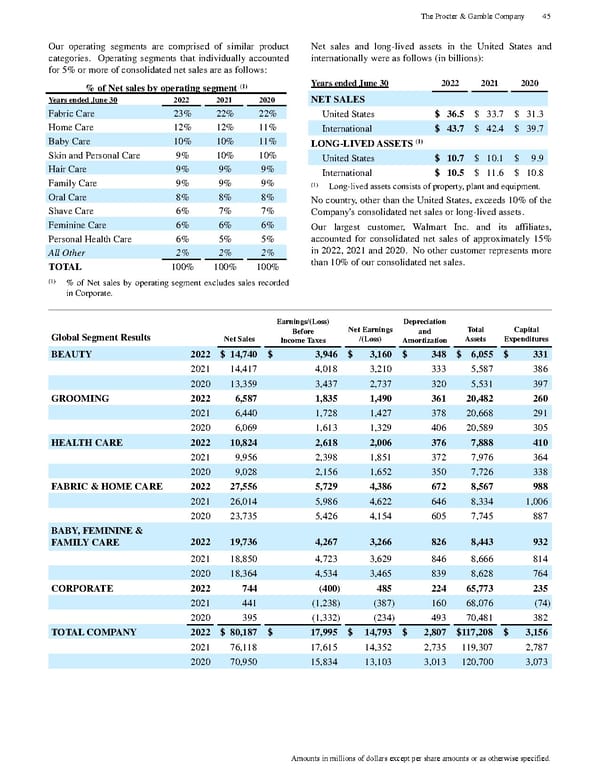
Our operating segments are comprised of similar product cat egories. Operating segments that individually accounted for 5% or more of consolidated net sales are as follows: % of Net sales by operating segment (1) Years ended June 30 2022 2021 2020 Fabric Care 23% 22% 22% Home Care 12% 12% 11% Baby Care 10% 10% 11% Skin and Personal Care 9% 10% 10% Hair Care 9% 9% 9% Family Care 9% 9% 9% Oral Care 8% 8% 8% Shave Care 6% 7% 7% Feminine Care 6% 6% 6% Personal Health Care 6% 5% 5% All Other 2% 2% 2% TOTAL 100% 100% 100% (1) % of Net sales by operating segment excludes sales recorded in Corporate. Net sales and long - lived assets in the United States and internationally were as follows (in billions): Years ended June 30 2022 2021 2020 NET SALES United States $ 36.5 $ 33.7 $ 31.3 International $ 43.7 $ 42.4 $ 39.7 LONG - LIVED ASSETS (1) United States $ 10.7 $ 10.1 $ 9.9 International $ 10.5 $ 11.6 $ 10.8 (1) Long - lived assets consists of property, plant and equipment. No country, other than the United States, exceeds 10% of the Company's consolidated net sales or long - lived assets. Our largest customer, Walmart Inc. and its affiliates, accounted for consolid ated net sales of approximately 15% in 2022, 2021 and 2020. No other customer represents more than 10% of our consolidated net sales. Global Segment Results Net Sales Earnings/(Loss) Before Income Taxes Net Earnings /(Loss) Depreciation and Amortization Total Assets Capital Expenditures BEAUTY 2022 $ 14,740 $ 3,946 $ 3,160 $ 348 $ 6,055 $ 331 2021 14,417 4,018 3,210 333 5,587 386 2020 13,359 3,437 2,737 320 5,531 397 GROOMING 2022 6,587 1,835 1,490 361 20,482 260 2021 6,440 1,728 1,427 378 20,668 291 2020 6,069 1,613 1,329 406 20,589 305 HEALTH CARE 2022 10,824 2,618 2,006 376 7,888 410 2021 9,956 2,398 1,851 372 7,976 364 2020 9,028 2,156 1,652 350 7,726 338 FABRIC & HOME CARE 2022 27,556 5,729 4,386 672 8,567 988 2021 26,014 5,986 4,622 646 8,334 1,006 2020 23,735 5,426 4,154 605 7,745 887 BABY, FEMININE & FAMILY CARE 2022 19,736 4,267 3,266 826 8,443 932 2021 18,850 4,723 3,629 846 8,666 814 2020 18,364 4,534 3,465 839 8,628 764 CORPORATE 2022 744 (400) 485 224 65,773 235 2021 441 (1,238) (387) 160 68,076 (74) 2020 395 (1,332) (234) 493 70,481 382 TOTAL COMPANY 2022 $ 80,187 $ 17,995 $ 14,793 $ 2,807 $ 117,208 $ 3,156 2021 76,118 17,615 14,352 2,735 119,307 2,787 2020 70,950 15,834 13,103 3,013 120,700 3,073 The Procter & Gamble Company 45 Amounts in millions of dollars except per share amounts or as otherwise specified.
 The Procter & Gamble Annual Report Page 56 Page 58