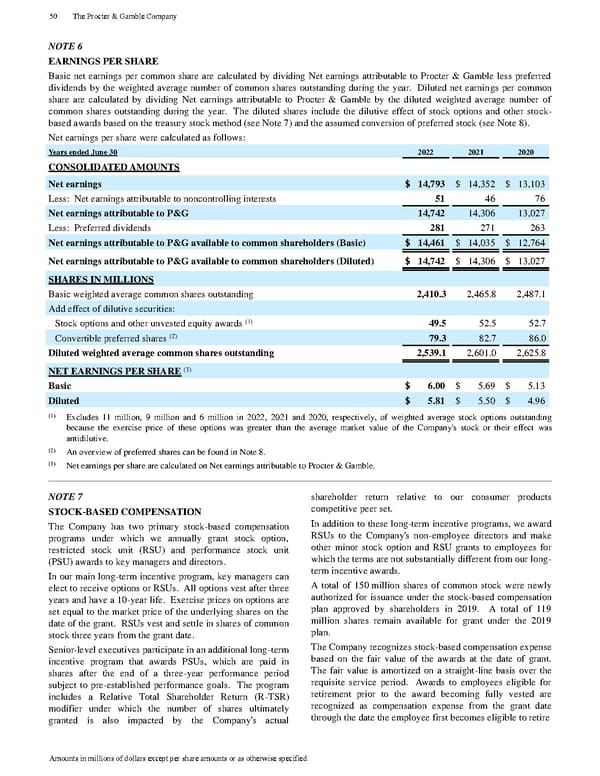
NOTE 6 EARNINGS PER SHARE Basic net earnings per common share are calculated by dividing Net earnings attributable to Procter & Gamble less preferred dividends by the weighted average number of common shares outstanding during the year. Diluted net earnin gs per common share are calculated by dividing Net earnings attributable to Procter & Gamble by the diluted weighted average number of common shares outstanding during the year. The diluted shares include the dilutive effect of stock options and other sto ck - based awards based on the treasury stock method (see Note 7) and the assumed conversion of preferred stock (see Note 8). Net earnings per share were calculated as follows: Years ended June 30 2022 2021 2020 CONSOLIDATED AMOUNTS Net earnings $ 14,793 $ 14,352 $ 13,103 Less: Net earnings attributable to noncontrolling interests 51 46 76 Net earnings attributable to P&G 14,742 14,306 13,027 Less: Preferred dividends 281 271 263 Net earnings attributable to P&G available to common shareholders (Basic) $ 14,461 $ 14,035 $ 12,764 Net earnings attributable to P&G available to common shareholders (Diluted) $ 14,742 $ 14,306 $ 13,027 SHARES IN MILLIONS Basic weighted average common shares outstanding 2,410.3 2,465.8 2,487.1 Add effect of dilutive securities: Stock options and other unvested equity awards (1) 49.5 52.5 52.7 Convertible preferred shares (2) 79.3 82.7 86.0 Diluted weighted average common shares outstanding 2,539.1 2,601.0 2,625.8 NET EARNINGS PER SHARE (3) Basic $ 6.00 $ 5.69 $ 5.13 Diluted $ 5.81 $ 5.50 $ 4.96 (1) Excludes 11 million, 9 million and 6 million in 2022, 2021 and 2020, respectively, of weighted average stock options outstanding because the exercise price of these options was greater than the average market value of the Company's stock or their effect was antidilutive. (2) An overview of preferred shares can be found in Note 8. (3) Net earnings per share are calculated on Net earnings attributable to Procter & Gamble. NOTE 7 STOCK - BASED COMPENSATION The Company has two primary stock - based compensation programs under which we annually grant stock option, restricted stock unit (RSU) and performance stock unit (PSU) awards to key managers and directors. In our main long - term incentive program, key manag ers can elect to receive options or RSUs. All options vest after three years and have a 10 - year life. Exercise prices on options are set equal to the market price of the underlying shares on the date of the grant. RSUs vest and settle in shares of commo n stock three years from the grant date. Senior - level executives participate in an additional long - term incentive program that awards PSUs, which are paid in shares after the end of a three - year performance period subject to pre - established performance g oals. The program includes a Relative Total Shareholder Return (R - TSR) modifier under which the number of shares ultimately granted is also impacted by the Company's actual shareholder return relative to our consumer products competitive peer set. In addi tion to these long - term incentive programs, we award RSUs to the Company's non - employee directors and make other minor stock option and RSU grants to employees for which the terms are not substantially different from our long - term incentive awards. A total of 150 million shares of common stock were newly authorized for issuance under the stock - based compensation plan approved by shareholders in 2019. A total of 119 million shares remain available for grant under the 2019 plan. The Company recognizes stock - based compensation expense based on the fair value of the awards at the date of grant. The fair value is amortized on a straight - line basis over the requisite service period. Awards to employees eligible for retirement prior to the award becoming fully v ested are recognized as compensation expense from the grant date through the date the employee first becomes eligible to retire 50 The Procter & Gamble Company Amounts in millions of dollars except per share amounts or as otherwise specified.
 The Procter & Gamble Annual Report Page 61 Page 63