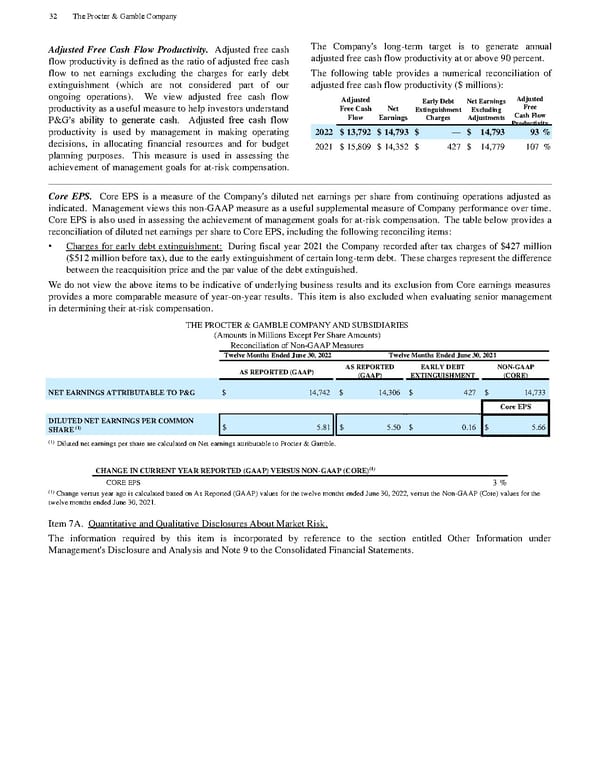
Adjusted Free Cash Flow Productivity. Adjusted free cash flow productivity is defined as the ratio of adjusted free cash flow to net earnings excluding the charges for early debt extinguishment (which are not considered part of our ongoing operations). We view adjusted free cash flow productivity as a useful measure to help investors understand P&G’s ability to generate cash. Adjusted free cash flow productivity is used by management in making operating decisions, in alloca ting financial resources and for budget planning purposes. This measure is used in assessing the achievement of management goals for at - risk compensation. The Company's long - term target is to generate annual adjusted free cash flow productivity at or abo ve 90 percent. The following table provides a numerical reconciliation of adjusted free cash flow productivity ($ millions): Adjusted Free Cash Flow Net Earnings Early Debt Extinguishment Charges Net Earnings Excluding Adjustments Adjusted Free Cash Flow Productivity 2022 $ 13,792 $ 14,793 $ — $ 14,793 93 % 2021 $ 15,809 $ 14,352 $ 427 $ 14,779 107 % Core EPS. Core EPS is a measure of the Company's diluted net earnings per share from continuing operations adjusted as indicated. Management views this non - GAAP measure as a useful supplemental measure of Company performance over time. Core EPS is also used in a ssessing the achievement of management goals for at - risk compensation. The table below provides a reconciliation of diluted net earnings per share to Core EPS, including the following reconciling items: • Charges for early debt extinguishment: During fisca l year 2021 the Company recorded after tax charges of $427 million ($512 million before tax), due to the early extinguishment of certain long - term debt. These charges represent the difference between the reacquisition price and the par value of the debt e xtinguished. We do not view the above items to be indicative of underlying business results and its exclusion from Core earnings measures provides a more comparable measure of year - on - year results. This item is also excluded when evaluating senior managem ent in determining their at - risk compensation. THE PROCTER & GAMBLE COMPANY AND SUBSIDIARIES (Amounts in Millions Except Per Share Amounts) Reconciliation of Non - GAAP Measures Twelve Months Ended June 30, 2022 Twelve Months Ended June 30, 2021 AS REPORTED (GAAP) AS REPORTED (GAAP) EARLY DEBT EXTINGUISHMENT NON - GAAP (CORE) NET EARNINGS ATTRIBUTABLE TO P&G $ 14,742 $ 14,306 $ 427 $ 14,733 Core EPS DILUTED NET EARNINGS PER COMMON SHARE (1) $ 5.81 $ 5.50 $ 0.16 $ 5.66 (1) Diluted net earnings per share are calculated on Net earnings attributable to Procter & Gamble. CHANGE IN CURRENT YEAR REPORTED (GAAP) VERSUS NON - GAAP (CORE) (1) CORE EPS 3 % (1) Change versus year ago is calculated based on As Reported (GAAP) values for the twelve months ended June 30, 2022, versus the Non - GAAP (Core) values for the twelve months ended June 30, 2021. Item 7A. Quantitative and Qualitative Disclosures About Market Risk. The information required by this item is incorporated by reference to the section entitled Other Information under Management's Disclosure and Analysis and Note 9 to the Consolidated Financial Sta tements. 32 The Procter & Gamble Company
 The Procter & Gamble Annual Report Page 43 Page 45