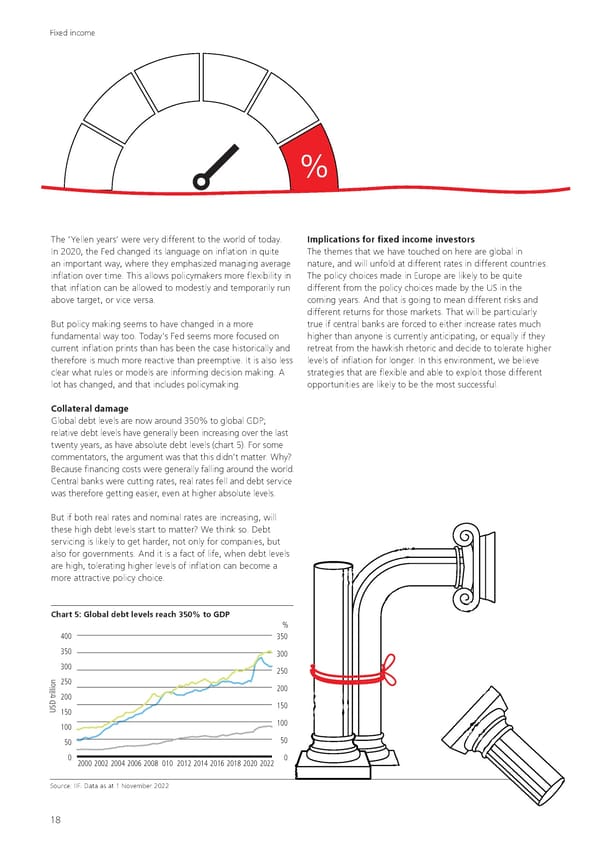
Fixed income % The ‘Yellen years’ were very different to the world of today. Implications for fixed income investors In 2020, the Fed changed its language on inflation in quite The themes that we have touched on here are global in an important way, where they emphasized managing average nature, and will unfold at different rates in different countries. inflation over time. This allows policymakers more flexibility in The policy choices made in Europe are likely to be quite that inflation can be allowed to modestly and temporarily run different from the policy choices made by the US in the above target, or vice versa. coming years. And that is going to mean different risks and different returns for those markets. That will be particularly But policy making seems to have changed in a more true if central banks are forced to either increase rates much fundamental way too. Today’s Fed seems more focused on higher than anyone is currently anticipating, or equally if they current inflation prints than has been the case historically and retreat from the hawkish rhetoric and decide to tolerate higher therefore is much more reactive than preemptive. It is also less levels of inflation for longer. In this environment, we believe clear what rules or models are informing decision making. A strategies that are flexible and able to exploit those different lot has changed, and that includes policymaking. opportunities are likely to be the most successful. Collateral damage Global debt levels are now around 350% to global GDP; relative debt levels have generally been increasing over the last twenty years, as have absolute debt levels (chart 5). For some commentators, the argument was that this didn't matter. Why? Because financing costs were generally falling around the world. Central banks were cutting rates, real rates fell and debt service was therefore getting easier, even at higher absolute levels. But if both real rates and nominal rates are increasing, will these high debt levels start to matter? We think so. Debt servicing is likely to get harder, not only for companies, but also for governments. And it is a fact of life, when debt levels are high, tolerating higher levels of inflation can become a more attractive policy choice. Chart 5: Global debt levels reach 350% to GDP % 400 350 350 300 300 250 n250 200 200 USD trillio150 150 100 100 50 50 0 2000 2002 2004 2006 2008 010 2012 2014 2016 2018 2020 2022 0 Government Debt (LHS) Global Debt (LHS) % of GDP (RHS) Source: IIF. Data as at 1 November 2022 18
 UBS Investing 2023 Page 10 Page 12