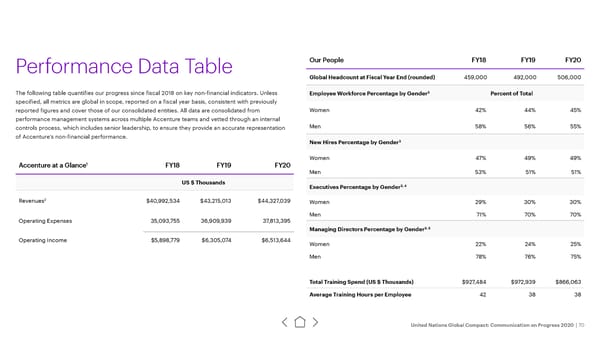
Performance Data Table Our People FY18 FY19 FY20 Global Headcount at Fiscal Year End (rounded) 459,000 492,000 506,000 The following table quantifies our progress since fiscal 2018 on key non-financial indicators. Unless 3 Percent of Total Employee Workforce Percentage by Gender specified, all metrics are global in scope, reported on a fiscal year basis, consistent with previously reported figures and cover those of our consolidated entities. All data are consolidated from Women 42% 44% 45% performance management systems across multiple Accenture teams and vetted through an internal controls process, which includes senior leadership, to ensure they provide an accurate representation Men 58% 56% 55% of Accenture’s non-financial performance. 3 New Hires Percentage by Gender Women 47% 49% 49% 1 Accenture at a Glance FY18 FY19 FY20 Men 53% 51% 51% US $ Thousands 3, 4 Executives Percentage by Gender 2 $40,992,534 $43,215,013 $44,327,039 Revenues Women 29% 30% 30% Men 71% 70% 70% Operating Expenses 35,093,755 36,909,939 37,813,395 3, 5 Managing Directors Percentage by Gender Operating Income $5,898,779 $6,305,074 $6,513,644 Women 22% 24% 25% Men 78% 76% 75% Total Training Spend (US $ Thousands) $927,484 $972,939 $866,063 Average Training Hours per Employee 42 38 38 United Nations Global Compact: Communication on Progress 2020 | 70
 UN Global Compact | Accenture Page 69 Page 71