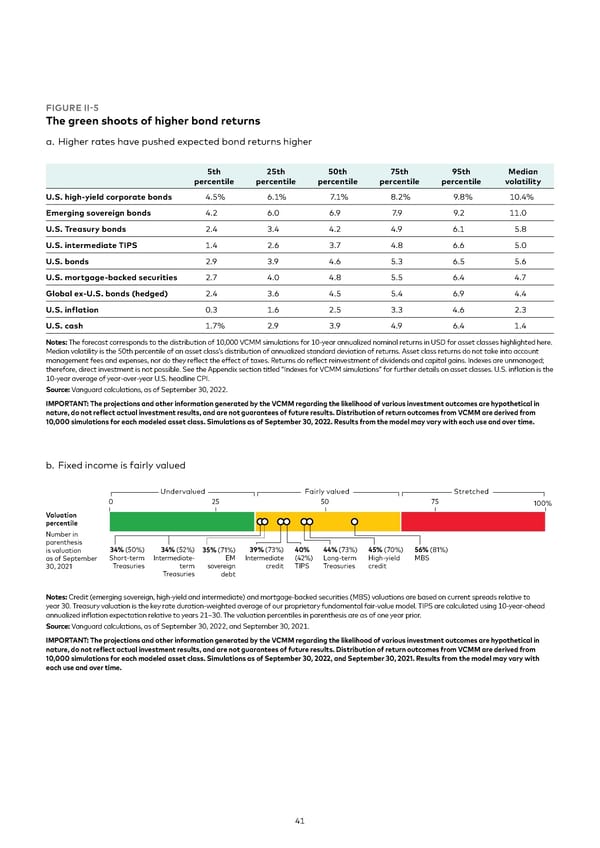
FIGURE II-5 The green shoots of higher bond returns a. Higher rates have pushed expected bond returns higher 5th 25th 50th 75th 95th Median percentile percentile percentile percentile percentile volatility U.S. high-yield corporate bonds 4.5% 6.1% 7.1% 8.2% 9.8% 10.4% Emerging sovereign bonds 4.2 6.0 6.9 7.9 9.2 11.0 U.S. Treasury bonds 2.4 3.4 4.2 4.9 6.1 5.8 U.S. intermediate TIPS 1.4 2.6 3.7 4.8 6.6 5.0 U.S. bonds 2.9 3.9 4.6 5.3 6.5 5.6 U.S. mortgage-backed securities 2.7 4.0 4.8 5.5 6.4 4.7 Global ex-U.S. bonds (hedged) 2.4 3.6 4.5 5.4 6.9 4.4 U.S. inflation 0.3 1.6 2.5 3.3 4.6 2.3 U.S. cash 1.7% 2.9 3.9 4.9 6.4 1.4 Notes: The forecast corresponds to the distribution of 10,000 VCMM simulations for 10-year annualized nominal returns in USD for asset classes highlighted here. Median volatility is the 50th percentile of an asset class’s distribution of annualized standard deviation of returns. Asset class returns do not take into account management fees and expenses, nor do they reflect the effect of taxes. Returns do reflect reinvestment of dividends and capital gains. Indexes are unmanaged; therefore, direct investment is not possible. See the Appendix section titled “Indexes for VCMM simulations” for further details on asset classes. U.S. inflation is the 10-year average of year-over-year U.S. headline CPI. Source: Vanguard calculations, as of September 30, 2022. IMPORTANT: The projections and other information generated by the VCMM regarding the likelihood of various investment outcomes are hypothetical in nature, do not reflect actual investment results, and are not guarantees of future results. Distribution of return outcomes from VCMM are derived from 10,000 simulations for each modeled asset class. Simulations as of September 30, 2022. Results from the model may vary with each use and over time. b. Fixed income is fairly valued Undervalued Fairly valued Stretched 0 25 50 75 100% Valuation percentile Number in parenthesis is valuation 34% (50%) 34% (52%) 35% (71%) 39% (73%) 40% 44% (73%) 45% (70%) 56% („1%) as of September Short-term ntermeiate- ntermeiate ( 2%) ƒon-term €ih-‚iel …S 30, 2021 Treasuries term soverein reit TS Treasuries reit Treasuries ebt Notes: Credit (emerging sovereign, high-yield and intermediate) and mortgage-backed securities (MBS) valuations are based on current spreads relative to year 30. Treasury valuation is the key rate duration-weighted average of our proprietary fundamental fair-value model. TIPS are calculated using 10-year-ahead annualized inflation expectation relative to years 21–30. The valuation percentiles in parenthesis are as of one year prior. Source: Vanguard calculations, as of September 30, 2022, and September 30, 2021. IMPORTANT: The projections and other information generated by the VCMM regarding the likelihood of various investment outcomes are hypothetical in nature, do not reflect actual investment results, and are not guarantees of future results. Distribution of return outcomes from VCMM are derived from 10,000 simulations for each modeled asset class. Simulations as of September 30, 2022, and September 30, 2021. Results from the model may vary with each use and over time. 41
 Vanguard economic and market outlook for 2023 Page 40 Page 42