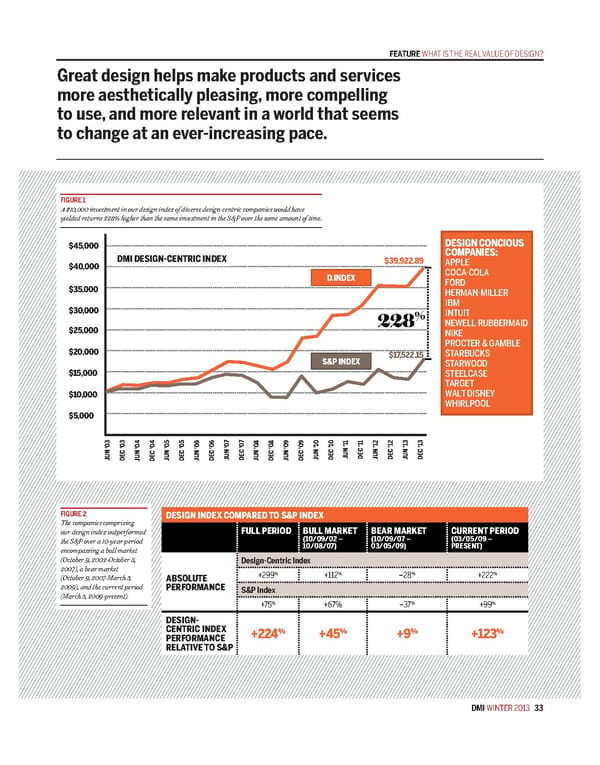
fEATURE what is the reaL vaLUe OF desiGn? Great design helps make products and services more aesthetically pleasing, more compelling to use, and more relevant in a world that seems to change at an ever-increasing pace. fIGURE 1 A $10,000 investment in our design index of diverse design-centric companies would have yielded returns 228% higher than the same investment in the S&P over the same amount of time. $45,000 DesIgn ConCIous DmI DesIgn-CenTRIC InDex CompanIes: $40,000 $39,922.89 Apple D.InDex CoCA-ColA $35,000 Ford HermAn-mIller IBm $30,000 % IntUIt 228 newell-rUBBermAId $25,000 nIke proCter & GAmBle $20,000 $17,522.15 StArBUCkS s&p InDex StArwood $15,000 SteelCASe tArGet $10,000 wAlt dISney wHIrlpool $5,000 07 07 10 10 11 11 12 12 13 13 03 03 04 04 05 05 06 06 ’ ’ 08 08 09 09 ’ ’ ’ ’ ’ ’ ’ ’ ’ ’ ’ ’ ’ ’ ’ ’ C ’ ’ ’ ’ C C C C C C C C e C C e e e e Jun e e Jun e e Jun D e e Jun D Jun D Jun D Jun D D Jun D D Jun D Jun D Jun D fIGURE 2 DesIgn InDex CompaReD To s&p InDex The companies comprising our design index outperformed full peRIoD Bull maRkeT BeaR maRkeT CuRRenT peRIoD the S&P over a 10-year period (10/09/02 – (10/09/07 – (03/05/09 – encompassing a bull market 10/08/07) 03/05/09) pResenT) (October 9, 2002-October 8, Design-Centric Index 2007), a bear market % % % % (October 9, 2007-March 5, aBsoluTe +299 +112 –28 +222 2009), and the current period peRfoRmanCe S&P Index (March 5, 2009-present). +75% +67% –37% +99% DesIgn- CenTRIC InDex % % % % peRfoRmanCe +224 +45 +9 +123 RelaTIve To s&p DMI Winter 2013 33
 What Is the Real Value of Design Page 3 Page 5