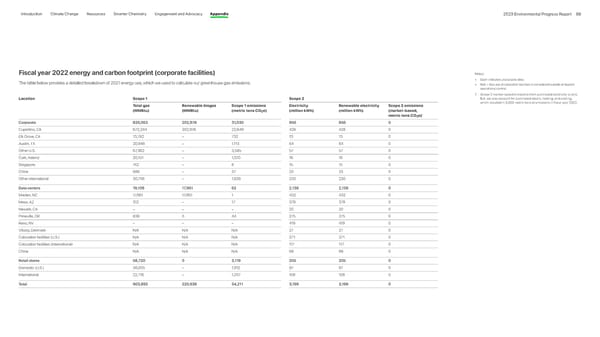
Introduction Climate Change Resources Smarter Chemistry Engagement and Advocacy Appendix 2023 Environmental Progress Report 88 Fiscal year 2022 energy and carbon footprint ( corporate facilities) Notes: The table below provides a detailed breakdown of 2021 energy use, which we used to calculate our greenhouse gas emissions. • Dash indicates unavailable data. • N/A = Gas use at colocation facilities is considered outside of Apple’s operational control. 1 Scope 2 market-based emissions from purchased electricity is zero. Location Scope 1 Scope 2 But, we also account for purchased steam, heating, and cooling, Total gas Renewable biogas Scope 1 emissions Electricity Renewable electricity Scope 2 emissions which resulted in 3, 020 m etric tons of emissions in fiscal year 2022. (MMBtu) (MMBtu) (metric tons CO 2 e) (million kWh) (million kWh) (market-based, metric tons CO 2 e) 1 Corporate 826,063 202,978 31,030 856 856 0 Cupertino, CA 672,244 202,978 22,849 428 428 0 Elk Grove, CA 13,782 – 732 13 13 0 Austin, TX 20,948 – 1,113 64 64 0 Other U.S. 67,362 – 3,585 57 57 0 Cork, Ireland 20,151 – 1,070 16 16 0 Singapore 142 – 8 15 15 0 China 686 – 37 33 33 0 Other international 30,748 – 1,636 230 230 0 Data centers 19,109 17,961 62 2,138 2,138 0 Maiden, NC 17,961 17,961 1 432 432 0 Mesa, AZ 312 – 17 379 379 0 Newark, CA – – – 20 20 0 Prineville, OR 836 0 44 275 275 0 Reno, NV – – – 419 419 0 Viborg, Denmark N/A N/A N/A 27 27 0 Colocation facilities (U.S.) N/A N/A N/A 371 371 0 Colocation facilities (international) N/A N/A N/A 117 117 0 China N/A N/A N/A 98 98 0 Retail stores 58,720 0 3,119 205 205 0 Domestic (U.S.) 36,005 – 1,912 97 97 0 International 22,716 – 1,207 108 108 0 Total 903,892 220,939 34,211 3,199 3,199 0
 Apple Environmental | Immersive Page 87 Page 89