Carlyle Credit Market Outlook
2024 report | 'Never Let Me Go': Competition and Opportunity in the Era of Bank Disintermediation.
May 2024 2024 Credit Market Outlook ̒Never Let Me Go’: Competition and Opportunity in the Era of Bank Disintermediation
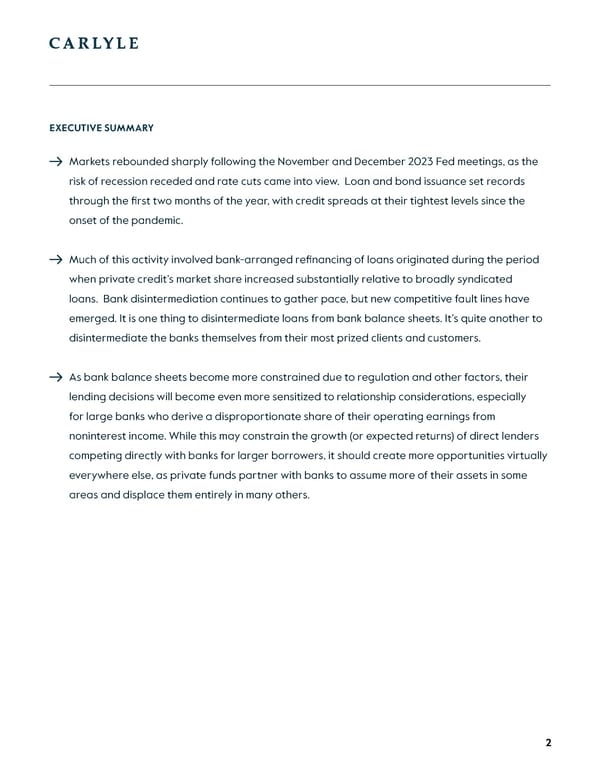
EXECUTIVE SUMMARY Markets rebounded sharply following the November and December 2023 Fed meetings, as the risk of recession receded and rate cuts came into view. Loan and bond issuance set records through the 昀椀rst two months of the year, with credit spreads at their tightest levels since the onset of the pandemic. Much of this activity involved bank-arranged re昀椀nancing of loans originated during the period when private credit’s market share increased substantially relative to broadly syndicated loans. Bank disintermediation continues to gather pace, but new competitive fault lines have emerged. It is one thing to disintermediate loans from bank balance sheets. It’s quite another to disintermediate the banks themselves from their most prized clients and customers. As bank balance sheets become more constrained due to regulation and other factors, their lending decisions will become even more sensitized to relationship considerations, especially for large banks who derive a disproportionate share of their operating earnings from noninterest income. While this may constrain the growth (or expected returns) of direct lenders competing directly with banks for larger borrowers, it should create more opportunities virtually everywhere else, as private funds partner with banks to assume more of their assets in some areas and displace them entirely in many others. 2

Market narratives can be 昀椀ckle things. A year ago, as the This has, in turn, led to a reconsideration of credit market Fed was taking base rates to levels that were unimaginable narratives. A year ago, we warned of the “triumphalism” just two years’ prior (Figure 1), market participants prepared that characterized discussions of private credit’s for the recession most analysts thought was necessary to displacement of more traditional forms of 昀椀nance. Banks extirpate price pressures from the system. It was further have not only returned to the market in force in 2024, but assumed that once in昀氀ation returned to target, the Fed much of their activity has been concentrated on re昀椀nancing would swiftly take base rates back down to more “normal” borrowers out of the more expensive loans originated levels, leaving longer-term discount rates largely una昀昀ected. during the period when private credit was “the only game These broadly shared expectations produced a plunge in in town.” A recalibration of expectations seems in order. M&A activity and defensive market positioning, as investors awaited signs of the inevitable downturn and aggressive Bank disintermediation continues to gather pace, but new rate cuts that would soon follow. competitive fault lines have emerged. It is one thing to disintermediate loans from bank balance sheets. It’s quite The economy proved more resilient than expected. U.S. GDP another to disintermediate the banks themselves from their growth accelerated in the period following the Fed’s last rate most prized clients and customers. As more credit market hike, even as in昀氀ation waned. The new narrative, born in the assets inevitably gravitate from banks to private portfolios, wake of the November 2023 FOMC meeting, was that the risk expect banks to mount a more vigorous defense of the of recession had dropped materially but the expected rate smaller, but more lucrative, remaining territories; willing to cuts would arrive just the same (Figure 2, page 4). This set cede assets but not the relationships responsible for their the stage for a remarkable rally in asset prices and market most important income streams. liquidity conditions. Figure 1. Markets Priced 5.3% Base Rates as a 1-in-1 Million Event Figure 1. Source: Carlyle Analysis of Federal Reserve Data, Bloomberg, November 2023. There is no guarantee any trends will continue. 3
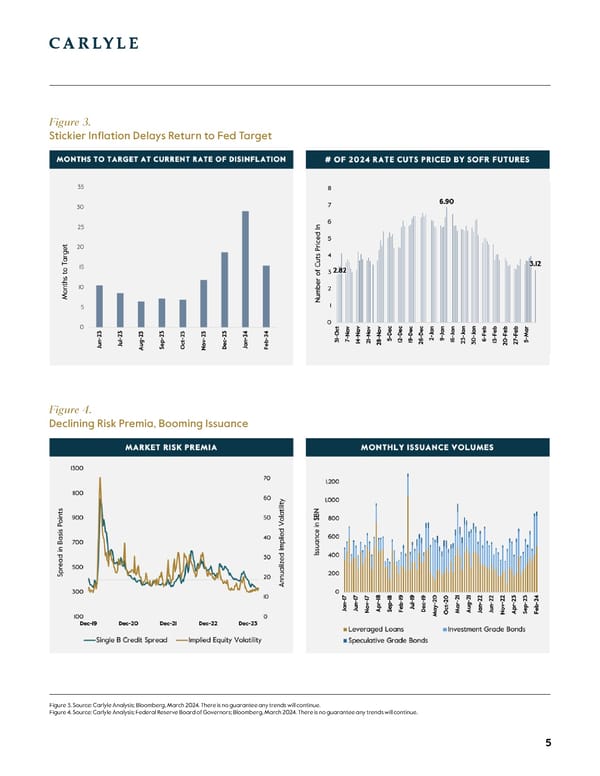
Figure 2. Simultaneous Drop in Recession Probabilities & Forward Interest Rates A MARKET LOOKING MORE LIKE 2021 large-cap tech stocks. Bitcoin has nearly doubled. Meme THAN 2022-23 coins are back in vogue. And credit markets have been red hot, with spreads at the tightest levels since the onset of The proximate spark for the recent rally in asset prices was the pandemic and bond and loan issuance at record levels the strongly hinted conclusion to the Fed’s tightening cycle through the 昀椀rst two months of the year (Figure 4, page 5). in November 2023, followed by the promise of rate cuts the following month. These announcements were premised on Re昀椀nancing has been the main driver of 2024 issuance, a rate of disin昀氀ation (at that time) that would have returned accounting for more than 64% of leveraged loans and 88% of core in昀氀ation to the Fed’s target by June 2024. Since then, high-yield bonds (M&A accounted for a trivial share of year- the monthly rate of disin昀氀ation has more than halved, which to-date issuance, though one suspects that’s likely to change would push the return of “price stability” out to the middle meaningfully in the months ahead; Figure 5, page 6). And of next year. Futures markets have dialed back rate cut a non-trivial share of that re昀椀nancing involves borrowers expectations, from nearly seven at the start of the year to opportunistically swapping out private credit in favor of just three now (Figure 3, page 5). cheaper syndicated loans. On average, private lenders charged 650 basis points over SOFR for loans extended This retracement has done little to dent investor enthusiasm. in 2022 and 2023 (Figure 6, page 6). With markets wide The stock market is up by more than 25% since the Fed open and spreads on bank-arranged 昀椀rst lien term loans signaled base rates had peaked. And, unlike prior rallies, averaging less 400bps, it’s no surprise to see borrowers take participation has been broad-based, with the 25% gain in advantage, even in cases that involve a 1% or 2% prepayment the small cap Russell 2000 nearly matching the 30% rise in fee (“call protection”).1 Figure 2. Source: Carlyle Analysis; FRBP Survey of Professional Forecasters, March 2024; ICE BAML Indices, Bloomberg, March 2024. There is no guarantee any trends will continue. 1. Pitchbook, Weekly Market Wrap, March 2024. 4
Figure 3. Stickier In昀氀ation Delays Return to Fed Target Figure 4. Declining Risk Premia, Booming Issuance Figure 3. Source: Carlyle Analysis; Bloomberg, March 2024. There is no guarantee any trends will continue. Figure 4. Source: Carlyle Analysis; Federal Reserve Board of Governors; Bloomberg, March 2024. There is no guarantee any trends will continue. 5
Figure 5. Re昀椀nancing Main Driver of Issuance Figure 6. Di昀昀erences in Credit Spreads & Lending Activity Figure 5. Source: Carlyle Analysis; BAML Credit Market Chartbook, March 2024. There is no guarantee any trends will continue. Figure 6. Source: Carlyle Analysis; “The U.S. Syndicated Term Loan Market: Who holds what and when?” Fed Notes, November 2019; Pitchbook, LCD Database, March 2024. There is no guarantee any trends will continue. 6
DOES THIS MEAN BANK DISINTERMEDIATION atrophy.3 Over the years, pressures have mounted on both WAS OVERHYPED? sides of banks’ balance sheet. Funds have become harder to attain – the share of household savings channeled into bank We warned a year ago that banks had “willingly ceded deposits has dropped by half – and more di昀케cult to deploy, ground,” understandably uneasy about the economy, as new instruments and lenders emerged to o昀昀er credit on interest rates, warehousing risk, and increased regulatory terms more tailored to borrowers’ needs. At the end of 2023, 2 scrutiny. Prodigious as private credit’s growth has been, it banks accounted for roughly one-third of the credit owed by still amounts to just one-third of the credit market (Figure 7), the U.S. corporate sector, and that share will almost certainly insu昀케cient in itself to meet M&A 昀椀nance needs or broader shrink in the years ahead (Figure 8, page 8). corporate loan demand. Banks were always coming back at some point because of their central role as conduits to The 昀椀ssure cast in greater relief by private credit’s dominance broader capital markets, and their return has certainly been in 2022-23 was not between banks and loans, but between welcomed by borrowers. banks and their customers. Direct lenders disintermediate banks to an extent not observed in the case of investment The recent shift in market realities serves more as funds that merely purchase loans or come into new a clari昀椀cation rather than refutation of the “bank commitments alongside banks; they not only deprive banks disintermediation” thesis. The traditional banking business of assets and the associated yields, but also the underwriting – taking deposits from savers to extend loans to households fees and client relationships that allow banks to cross-sell and businesses – peaked in the mid-1970s and continues to other services for which much of their income depends. Figure 7. Credit Market Size by Instrument Figure 7. Source: Carlyle Analysis; BAML Credit Market Chartbook, March 2024; “Private Credit: Characteristics and Risks,” Fed Notes, February 2024. There is no guarantee any trends will continue. 2. Thomas, J and M. Jenkins (2023), “New Landscapes, New Eyes,” Carlyle, April 2023. https://www.carlyle.com/sites/default/昀椀les/2023-04/Carlyle-JT-2023-Credit-Whitepaper.pdf 3. FDIC (2019), Quarterly Banking Pro昀椀le, Q3-2019. Pgs 31-50. 7
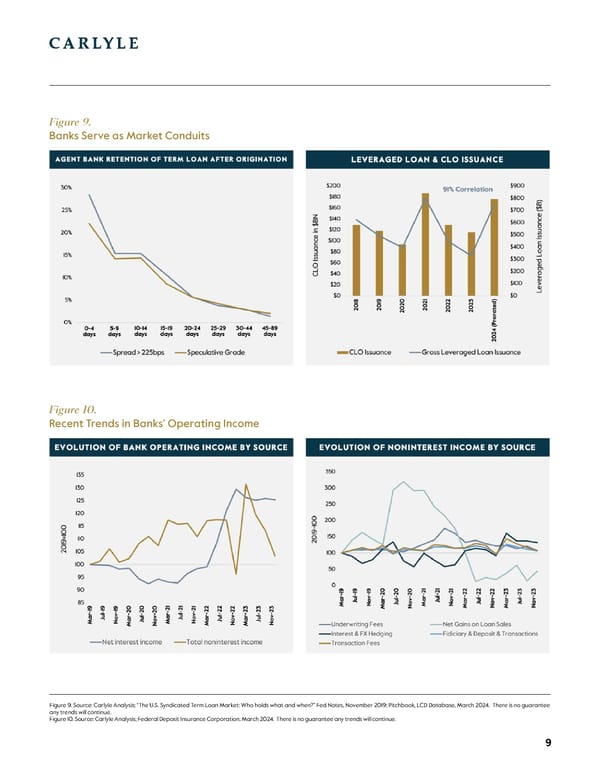
Figure 8. Banks’ Declining Role in Credit Intermediation LEVERAGED LENDING AS “METERED” Collateralized Loan Obligations (CLOs), which today serve DISINTERMEDIATION as the ultimate home for about 70% of leveraged loans. The ability to distribute loans is key to their origination; CLO Leverage lending perhaps best clari昀椀es this asset-client issuance explains over 80% of the variation in leveraged loan distinction. Originally conceived to allow one bank to origination volumes over the past six years (Figure 9, page 9). o昀昀load credit risk onto others, syndicated lending became a mechanism for the banking sector as a whole to o昀昀load In other words, leveraged lending still represents credit risk onto nonbanks. In 2000, banks accounted for disintermediation – the term loans end up on nonbank about 20% of the primary purchases of leveraged term balance sheets – but it’s of a sort that allows banks to loans. By the onset of the pandemic, that 昀椀gure had garner underwriting fees, receipts from loan sales, and dropped to 3%.4 strengthen relationships with borrowers in ways that can lead to other value-added services, like interest rate and On average, the agent bank responsible for arranging foreign exchange hedging, 昀椀duciary and deposit services, committed credit for its client sells down its share of the term transaction fees, loan sales, and other sources of noninterest loan balance from 28% at the time of origination to just 1% income that waned markedly during the time of private three months later. Most of the loan ends up in the hands of credit’s ascendence (Figure 10, page 9). Figure 8. Source: Carlyle Analysis; Federal Reserve Board of Governors. There is no guarantee any trends will continue. 4. FDIC (2019). P. 35. 8
Figure 9. Banks Serve as Market Conduits Figure 10. Recent Trends in Banks’ Operating Income Figure 9. Source: Carlyle Analysis; “The U.S. Syndicated Term Loan Market: Who holds what and when?” Fed Notes, November 2019; Pitchbook, LCD Database, March 2024. There is no guarantee any trends will continue. Figure 10. Source: Carlyle Analysis; Federal Deposit Insurance Corporation, March 2024. There is no guarantee any trends will continue. 9
RELATIONSHIPS DETERMINE WHAT ENDS UP in March 2020, leveraged loan issuance dropped by 65% ON BANK BALANCE SHEETS relative to its trailing 12-month average. But the only reason issuance didn’t drop 100% was because all of the leveraged Banks do hold a pro-rata tranche of leveraged loans on loan originations that month came in the form of bank-retained 5 balance sheet, which typically consists of a revolving credit revolving credit facilities. And these loans were extended at facility with tighter spreads and covenants. But this balance an especially steep discount: the average spread on revolvers sheet capacity tends to be allocated strategically in service issued in March 2020 was 157bps, which was 220bps below the of high-value clients. This is evident when examining bank average spread on the same facilities from the prior month.6 behavior during periods of market stress. When spreads widen (loan prices drop) and leveraged loans cannot be Such behavior may appear uneconomic to credit investors easily distributed to CLOs or other buyers, origination focused solely on extending credit at terms that deliver high volumes tend to drop, often precipitously, but the pro- returns net of any default losses. But it merely re昀氀ects the rata share of loan facilities intentionally retained by banks extent to which the economics of banking strays from pure consistently rises at the same time (Figure 11). credit intermediation. The implied value of a client relationship 7 to a bank is equal 11.6% of loan principal, on average. And one These revolving credit facilities are obviously extended to suspects banks’ credit allocation decisions will become even bolster relationships. For further proof, consider the inverse sensitized to the needs of high-value clients in the future, as relationship between spreads on newly-issued pro-rata regulation (Basel III Endgame), further constrains bank risk- tranches and spreads on secondary market credits (Figure taking and the share of balance sheets that can be allocated to 11). When credit markets froze at the onset of the pandemic capital-intensive loans (Figure 12, page 11). Figure 11. Pro-Rata Share of Loans Rises & Spreads Compress During Market Stress Figure 11. Source: Carlyle Analysis; Pitchbook, LCD Database, March 2024; Bloomberg, March 2024. There is no guarantee any trends will continue. 5. Pitchbook, LCD Database, Accessed March 2024. 6. While some of this inverse relationship could be explained by higher borrower quality during stressed periods (BB rather than B-rated credits, for instance), most of the gap looks like concessionary terms. 7. Ruchti, T. et al. (2024), “The Value of Lending Relationships,” O昀케ce of Financial Research, U.S. Treasury. 10
Figure 12. Change in Bank Balance Sheets Over Time SIZE MATTERS be most sensitized to broader strategic calculation. And when looking solely at the largest bank holding companies, For private credit funds, with focused business models that dependence on noninterest income appears bimodally do not take deposits or derive ancillary fees to the same distributed, with noninterest income accounting for between extent as banks, recent developments represent both a 35% and 50% of operating income for a quarter and warning and opportunity. Direct lenders whose scale pushes between 75% and 90% for another 昀椀fth (Figure 13, page 12). them to compete directly for banks’ most prized clients may 昀椀nd themselves in a position akin to U.S. steelmakers in the This suggests that the clients of a relatively small subset 1960s and 70s: forced to sell their product at market prices of especially large banks may be able to access credit on (spreads, in this case) that seem to make no sense. But more favorable terms because of the fees they generate outside of this corner of the market, circumstances are likely from potential IPOs, advisory work, acquisitions, and other to improve materially, as banks disgorge assets and more related needs, including deposit and transaction services. borrowers seek out alternative sources of credit. It’s impossible to know, analytically, which borrowers 昀椀t precisely into this bucket. One suspects that companies Size matters, both in terms of the banks against which above an annual EBITDA threshold between $200 million private lenders compete and the borrowers themselves. to $400 million would be prime candidates for precisely While all bank holding companies experienced a dip in the sorts of value-added services for which banks derive noninterest income over the past two years, it is the largest so much of their operating income, as would companies banks that derive the greatest share of their operating a昀케liated with large 昀椀nancial sponsors with deep and income from fees and whose lending decisions are likely to multifaceted banking relationships. Figure 12. Source: Carlyle Analysis; Federal Deposit Insurance Corporation, March 2024; Federal Reserve Bank of New York, March 2024. There is no guarantee any trends will continue. 11
Ultimately, spreads on bank-arranged term loans are main relationship-based motivation is retaining deposits – determined by conditions in the market in which they’re which private lenders do not threaten. distributed. And when added to base rates, the associated cash interest expense limits the leverage (debt/EBITDA) The aforementioned trends in balance sheet composition that a 昀椀rst lien loan can accommodate in the current (Figure 12, page 11) should weaken banks’ competitive position in environment. For many capital structures, an increase in this portion of the market. Bank holdings of duration-sensitive bank-intermediated lending necessitates corresponding Treasuries and mortgage-backed securities (MBS) skyrocketed growth in junior capital. In these cases, private capital will in the period preceding the rise in interest rates – partly due still be central to the transaction, but instead of “unitranche” to regulation – leading to catastrophic fair value losses that loans from direct lenders, such participation will come in the have not been recognized for regulatory purposes but reduce form of higher-yielding second liens and preferred securities. earnings capacity and economic capital just the same (Figure 14, This dynamic is a return of sorts to the symbiotic relationship page 13). And while the bank share of most types of loans has between broadly syndicated and private markets that dropped meaningfully over the years, their share of mortgages existed just prior to the pandemic. collateralized by commercial real estate has remained roughly 8 constant, equal to more than half the market. Given the Below the $200 million to $400 million annual EBITDA potential fall-out in the o昀케ce sector, where the “structural” 9 threshold, competition for private lenders is likely to involve vacancy rate is nearly 50% due to work-from-home trends, more commercially-oriented large banks and regional banks many banks may need to jealously guard capital that they might with less fee income to cross-subsidize lending and whose otherwise have been able to commit to new loans. Figure 13. Dispersion in Noninterest Share of Bank Operating Income Figure 13. Source: Carlyle Analysis; Federal Reserve Bank of New York, March 2024; S&P Global, June 2022. There is no guarantee any trends will continue. 8. FDIC (2019). P. 33. 9. Doolittle, T. and A. Fliegelman (2023), “Work-from-Home and the Future Consolidation of the U.S. Commercial Real Estate O昀케ce Sector: The Decline of Regional Malls May Provide Insight,” O昀케ce of Financial Research, U.S. Treasury. 12
Figure 14. Bank Capital Hit by Bond Losses, O昀케ce Exposure CONCLUSION share of their operating earnings from M&A and IPO underwriting, advisory work, transaction services, Narratives surrounding the disintermediation of banks and other fees. While direct lenders aspiring to enter have not flipped but become more nuanced. The share this territory may find themselves at a competitive of total credit market assets on bank balance sheets disadvantage, the actionable opportunity set is likely has dropped materially over the past 50 years and this to expand for private lenders in virtually every other trend seems certain to continue. As bank balance sheets direction. Appreciation for the asset-client distinction become more constrained, their lending decisions will and broader competitive dynamics may be the key to become more sensitized to relationship considerations, assembling the best-performing credit portfolios in the especially for large banks who derive a disproportionate years ahead. Figure 14. Source: Carlyle Analysis; Federal Deposit Insurance Corporation, March 2024; Federal Reserve Board of Governors, March 2024. There is no guarantee any trends will continue. 13
Jason Thomas HEAD OF GLOBAL RESEARCH & INVESTMENT STRATEGY [email protected] / (202) 729-5420 Jason Thomas is the Head of Global Research & Investment Mr. Thomas received a BA from Claremont McKenna College Strategy at Carlyle, focusing on economic and statistical and an MS and PhD in 昀椀nance from George Washington analysis of Carlyle portfolio data, asset prices, and broader University, where he studied as a Bank of America trends in the global economy. Foundation, Leo and Lillian Goodwin Foundation, and School of Business Fellow. Prior to joining Carlyle, Mr. Thomas served on the White House sta昀昀 as Special Assistant to the President and Director Mr. Thomas has earned the chartered 昀椀nancial analyst for Policy Development at the National Economic Council. designation and is a Financial Risk Manager certi昀椀ed by In this capacity, Mr. Thomas acted as the primary adviser to the Global Association of Risk Professionals. the President for public 昀椀nance. Mark Jenkins HEAD OF GLOBAL CREDIT Mark Jenkins is Head of Carlyle Global Credit. He is also a acquisition and oversight of Antares Capital and the member of Carlyle's Leadership Committee. He is based in subsequent expansion in middle market lending. Prior to New York. CPPIB, he was Managing Director, Co-Head of Leveraged Finance Origination and Execution for Barclays Capital in Prior to joining Carlyle, Mr. Jenkins was a Senior Managing New York. Before Barclays, Mr. Jenkins worked for 11 years Director at CPPIB and responsible for leading CPPIB’s at Goldman Sachs & Co. in senior positions within the Fixed Global Private Investment group. He was Chair of the Credit Income and Financing groups in New York. Investment Committee, Chair of the Private Investments Committee and also managed the portfolio value creation Mr. Jenkins earned a B.Comm degree from Queen’s group. While at CPPIB, Mr. Jenkins founded CPPIB Credit University. He served on the boards of Wilton Re, Teine Investments, which is a multi-strategy platform making Energy, Antares Capital and Merchant Capital Solutions. direct principal credit investments. He also led CPPIB’s Economic and market views and forecasts re昀氀ect our judgment as of the date of this presentation and are subject to change without notice. In particular, forecasts are estimated, based on assumptions, and may change materially as economic and market conditions change. The Carlyle Group has no obligation to provide updates or changes to these forecasts. Certain information contained herein has been obtained from sources prepared by other parties, which in certain cases have not been updated through the date hereof. While such information is believed to be reliable for the purpose used herein, The Carlyle Group and its a昀케liates assume no responsibility for the accuracy, completeness or fairness of such information. References to particular portfolio companies are not intended as, and should not be construed as, recommendations for any particular company, investment, or security. The investments described herein were not made by a single investment fund or other product and do not represent all of the investments purchased or sold by any fund or product. This material should not be construed as an o昀昀er to sell or the solicitation of an o昀昀er to buy any security in any jurisdiction where such an o昀昀er or solicitation would be illegal. We are not soliciting any action based on this material. It is for the general information of clients of The Carlyle Group. It does not constitute a personal recommendation or take into account the particular investment objectives, 昀椀nancial situations, or needs of individual investors. 14


