EV Floating Rate Fund
Eaton Vance Floating-Rate Advantage Fund. A diversified, research-driven approach to floating-rate loan investing.
MORNINGSTAR CATEGORY TICKER SYMBOL FACTSHEET Bank Loan EAFAX 1Q24 EIFAX Eaton Vance Floating-Rate Advantage Fund A diversified, research-driven approach to floating-rate loan investing. The Fund: Managed by Eaton Vance, a pioneer in floating rate loans since 1989, this portfolio diversifier FLOATING-RATE LOAN TEAM provides broad exposure to the floating rate loan market. In depth, bottom up credit research and broad diversification are this Fund's cornerstones, managed by one of America's largest and most experienced loan JOINED INDUSTRY managers. Investment Team FIRM EXPERIENCE Andrew N. Sveen, CFA 1999 29 Years The Approach: Invests broadly across the floating rate loan market, providing diversified exposure to the asset class and its many sectors, credit tiers and issuers. Fund employs leverage for the purpose of acquiring additional Ralph Hinckley, CFA 2003 27 Years income-producing investments, which may increase risk and return potential. Jake Lemle, CFA 2007 17 Years The Features: Floating rate loans have typically performed with low correlation to traditional equity and fixed Team members may be subject to change at any time without income markets, providing important diversification benefits for investor portfolios. Low duration and loans' notice. floating rate structure may help reduce interest rate risk and lower portfolio volatility. Morningstar Overall Rating Growth of $10,000 (10-year period ended March 31, 2024) CLASS A SHARES CLASS I SHARES 17,500 Out of 214 Funds. Based on Risk Adjusted Return. Class A and Class I Ratings: 3-year: 4 and 4 stars, respectively ; 5-year: 15,000 3 and 4 stars, respectively ; 10-year: 4 and 5 stars, respectively. The total number of funds in the Bank Loan 12,500 category for the 3, 5 and 10 year periods are 214, 206 and 169, respectively. 10,000 Fund Facts Class A inception 03/17/2008 7,500 Class I inception 03/17/2008 Mar-14 Jul-17 Nov-20 Mar-24 Performance inception 08/04/1989 Investment objective High current income Class A Shares Benchmark Morningstar LSTA US Leveraged Loan TR USD Index Investment Performance (% net of fees) in USD Distribution frequency Monthly Cumulative (%) Annualized (% p.a.) Total net assets $ 5.7 billion 1Q24 YTD 1 YR 3 YR 5 YR 10 YR Total investments $ 5.90 million Class A Shares 2.39 2.39 12.87 5.31 4.71 4.29 Class A expense ratio 2.82 % Class I Shares 2.46 2.46 13.15 5.57 4.99 4.56 Class I expense ratio 2.57 % A Shares with Max. 3.25% Sales Charge -0.95 -0.95 9.19 4.16 4.03 3.95 Class A adjusted expense ratio 1.00 % Morningstar LSTA US Leveraged Loan TR 2.46 2.46 12.47 5.99 5.48 4.55 Class I adjusted expense ratio 0.75 % USD Index Adjusted Expense Ratios excludes certain investment expenses Calendar Year Returns (%) 2023 2022 2021 2020 2019 2018 2017 2016 2015 2014 such as interest expense from borrowings and repurchase Class A Shares 14.04 -3.14 5.15 1.63 8.62 0.12 4.87 12.67 -1.84 0.69 agreements and dividend expense from short sales, incurred directly by the Fund or indirectly through the Fund’s investment Class I Shares 14.44 -3.00 5.41 1.88 9.00 0.28 5.14 12.94 -1.60 0.94 in underlying Eaton Vance Funds, if applicable none of which are Morningstar LSTA US Leveraged Loan TR 13.32 -0.77 5.20 3.12 8.64 0.44 4.12 10.16 -0.69 1.60 paid to Eaton Vance. USD Index Symbols & CUSIPs Performance data quoted represents past performance, which is no guarantee of future results, and current performance Class A EAFAX 277923660 may be lower or higher than the figures shown. For the Fund’s performance as of the most recent month-end, please refer Class Advisers EVFAX 277923678 to eatonvance.com. Investment returns and principal value will fluctuate and fund shares, when redeemed, may be worth Class C ECFAX 277923645 more or less than their original cost. Class I EIFAX 277923637 Performance and fund information is as of March 31, 2024, unless otherwise noted. Returns are net of fees and assume Class R6 EFRRX 27826A623 the reinvestment of all dividends and income. Returns for less than one year are cumulative (not annualized). Performance of other share classes will vary. Characteristics FUND Growth of Investment illustration assumes reinvestment of dividends and capital gains and application of fees, but does Number of Loan Issuers 399 not include sales charges. Performance would have been lower if sales charges had been included. Results are Average Maturity (yrs.) 4.61 hypothetical. Average Duration (yrs.) 0.42 Total return prior to the commencement of A and I Shares reflects returns of Eaton Vance Prime Rate Reserves, the Average Price ($) 96.61 Fund’s Predecessor, adjusted, where indicated, to reflect applicable sales charges (but were not adjusted for other Leverage from Borrowings 20.99 expenses). If adjusted for other expenses, returns would be lower. SEC 30-day yield (%) Class A 8.83 Where the net expense ratio is lower than the gross expense ratio, certain fees have been waived and/or expenses SEC 30-day yield (%) Class I 9.39 reimbursed. These waivers and/or reimbursements will continue for at least one year from the date of the applicable fund’s Top 10 Issuers (% of Total Net Assets) FUND current prospectus (unless otherwise noted in the applicable prospectus) or until such time as the fund's Board of Directors/Trustees acts to discontinue all or a portion of such waivers and/or reimbursements. Absent such waivers and/or TransDigm Inc. 1.10 reimbursements, returns would have been lower. Expenses are based on the fund's current prospectus. The minimum Epicor Software Corporation 1.05 investment is $1,000 for A Shares and $1,000,000 for I Shares. Carnival Corporation 1.01 Applied Systems Inc. 0.91 Go Daddy Operating Company LLC 0.86 American Airlines Inc. 0.81 Ineos US Finance LLC 0.80 Uber Technologies Inc. 0.74 Stars Group Holdings B.V. (The) 0.73 Select Medical Corporation 0.73 NOT FDIC INSURED | OFFER NO BANK GUARANTEE | MAY LOSE VALUE | NOT INSURED BY ANY FEDERAL GOVERNMENT AGENCY | NOT A DEPOSIT
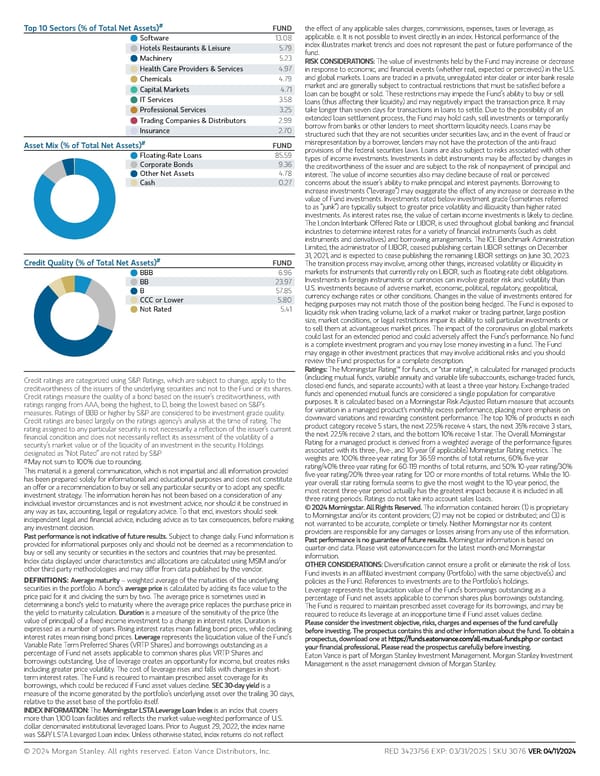
# the effect of any applicable sales charges, commissions, expenses, taxes or leverage, as Top 10 Sectors (% of Total Net Assets) FUND applicable. e. It is not possible to invest directly in an index. Historical performance of the Software 13.08 index illustrates market trends and does not represent the past or future performance of the Hotels Restaurants & Leisure 5.79 fund. Machinery 5.23 RISK CONSIDERATIONS: The value of investments held by the Fund may increase or decrease Health Care Providers & Services 4.97 in response to economic, and financial events (whether real, expected or perceived) in the U.S. and global markets. Loans are traded in a private, unregulated inter-dealer or inter-bank resale Chemicals 4.79 market and are generally subject to contractual restrictions that must be satisfied before a Capital Markets 4.71 loan can be bought or sold. These restrictions may impede the Fund’s ability to buy or sell IT Services 3.58 loans (thus affecting their liquidity) and may negatively impact the transaction price. It may take longer than seven days for transactions in loans to settle. Due to the possibility of an Professional Services 3.25 extended loan settlement process, the Fund may hold cash, sell investments or temporarily Trading Companies & Distributors 2.99 borrow from banks or other lenders to meet shortterm liquidity needs. Loans may be Insurance 2.70 structured such that they are not securities under securities law, and in the event of fraud or misrepresentation by a borrower, lenders may not have the protection of the anti-fraud # Asset Mix (% of Total Net Assets) FUND provisions of the federal securities laws. Loans are also subject to risks associated with other Floating-Rate Loans 85.59 types of income investments. Investments in debt instruments may be affected by changes in Corporate Bonds 9.36 the creditworthiness of the issuer and are subject to the risk of nonpayment of principal and Other Net Assets 4.78 interest. The value of income securities also may decline because of real or perceived concerns about the issuer’s ability to make principal and interest payments. Borrowing to Cash 0.27 increase investments (“leverage”) may exaggerate the effect of any increase or decrease in the value of Fund investments. Investments rated below investment grade (sometimes referred to as “junk”) are typically subject to greater price volatility and illiquidity than higher rated investments. As interest rates rise, the value of certain income investments is likely to decline. The London Interbank Offered Rate or LIBOR, is used throughout global banking and financial industries to determine interest rates for a variety of financial instruments (such as debt instruments and derivatives) and borrowing arrangements. The ICE Benchmark Administration Limited, the administrator of LIBOR, ceased publishing certain LIBOR settings on December 31, 2021, and is expected to cease publishing the remaining LIBOR settings on June 30, 2023. # Credit Quality (% of Total Net Assets) FUND The transition process may involve, among other things, increased volatility or illiquidity in markets for instruments that currently rely on LIBOR, such as floating-rate debt obligations. BBB 6.96 Investments in foreign instruments or currencies can involve greater risk and volatility than BB 23.97 U.S. investments because of adverse market, economic, political, regulatory, geopolitical, B 57.85 currency exchange rates or other conditions. Changes in the value of investments entered for CCC or Lower 5.80 hedging purposes may not match those of the position being hedged. The Fund is exposed to Not Rated 5.41 liquidity risk when trading volume, lack of a market maker or trading partner, large position size, market conditions, or legal restrictions impair its ability to sell particular investments or to sell them at advantageous market prices. The impact of the coronavirus on global markets could last for an extended period and could adversely affect the Fund’s performance. No fund is a complete investment program and you may lose money investing in a fund. The Fund may engage in other investment practices that may involve additional risks and you should review the Fund prospectus for a complete description. Ratings: The Morningstar Rating™ for funds, or "star rating", is calculated for managed products (including mutual funds, variable annuity and variable life subaccounts, exchange-traded funds, Credit ratings are categorized using S&P. Ratings, which are subject to change, apply to the closed-end funds, and separate accounts) with at least a three-year history. Exchange-traded creditworthiness of the issuers of the underlying securities and not to the Fund or its shares. funds and openended mutual funds are considered a single population for comparative Credit ratings measure the quality of a bond based on the issuer’s creditworthiness, with purposes. It is calculated based on a Morningstar Risk-Adjusted Return measure that accounts ratings ranging from AAA, being the highest, to D, being the lowest based on S&P’s for variation in a managed product's monthly excess performance, placing more emphasis on measures. Ratings of BBB or higher by S&P are considered to be investment-grade quality. downward variations and rewarding consistent performance. The top 10% of products in each Credit ratings are based largely on the ratings agency’s analysis at the time of rating. The product category receive 5 stars, the next 22.5% receive 4 stars, the next 35% receive 3 stars, rating assigned to any particular security is not necessarily a reflection of the issuer’s current the next 22.5% receive 2 stars, and the bottom 10% receive 1 star. The Overall Morningstar financial condition and does not necessarily reflect its assessment of the volatility of a Rating for a managed product is derived from a weighted average of the performance figures security’s market value or of the liquidity of an investment in the security. Holdings associated with its three-, five-, and 10-year (if applicable) Morningstar Rating metrics. The designated as “Not Rated” are not rated by S&P weights are: 100% three-year rating for 36-59 months of total returns, 60% five-year # May not sum to 100% due to rounding. rating/40% three-year rating for 60-119 months of total returns, and 50% 10-year rating/30% This material is a general communication, which is not impartial and all information provided five-year rating/20% three-year rating for 120 or more months of total returns. While the 10- has been prepared solely for informational and educational purposes and does not constitute year overall star rating formula seems to give the most weight to the 10-year period, the an offer or a recommendation to buy or sell any particular security or to adopt any specific most recent three-year period actually has the greatest impact because it is included in all investment strategy. The information herein has not been based on a consideration of any three rating periods. Ratings do not take into account sales loads. individual investor circumstances and is not investment advice, nor should it be construed in © 2024 Morningstar. All Rights Reserved. The information contained herein: (1) is proprietary any way as tax, accounting, legal or regulatory advice. To that end, investors should seek to Morningstar and/or its content providers; (2) may not be copied or distributed; and (3) is independent legal and financial advice, including advice as to tax consequences, before making not warranted to be accurate, complete or timely. Neither Morningstar nor its content any investment decision. providers are responsible for any damages or losses arising from any use of this information. Past performance is not indicative of future results. Subject to change daily. Fund information is Past performance is no guarantee of future results. Morningstar information is based on provided for informational purposes only and should not be deemed as a recommendation to quarter-end data. Please visit eatonvance.com for the latest month-end Morningstar buy or sell any security or securities in the sectors and countries that may be presented. information. Index data displayed under characteristics and allocations are calculated using MSIM and/or OTHER CONSIDERATIONS: Diversification cannot ensure a profit or eliminate the risk of loss. other third-party methodologies and may differ from data published by the vendor. Fund invests in an affiliated investment company (Portfolio) with the same objective(s) and DEFINITIONS: Average maturity – weighted average of the maturities of the underlying policies as the Fund. References to investments are to the Portfolio’s holdings. securities in the portfolio. A bond's average price is calculated by adding its face value to the Leverage represents the liquidation value of the Fund’s borrowings outstanding as a price paid for it and dividing the sum by two. The average price is sometimes used in percentage of Fund net assets applicable to common shares plus borrowings outstanding. determining a bond's yield to maturity where the average price replaces the purchase price in The Fund is required to maintain prescribed asset coverage for its borrowings, and may be the yield to maturity calculation. Duration is a measure of the sensitivity of the price (the required to reduce its leverage at an inopportune time if Fund asset values decline. value of principal) of a fixed income investment to a change in interest rates. Duration is Please consider the investment objective, risks, charges and expenses of the fund carefully expressed as a number of years. Rising interest rates mean falling bond prices, while declining before investing. The prospectus contains this and other information about the fund. To obtain a interest rates mean rising bond prices. Leverage represents the liquidation value of the Fund’s prospectus, download one at https://funds.eatonvance.com/all-mutual-funds.php or contact Variable Rate Term Preferred Shares (VRTP Shares) and borrowings outstanding as a your financial professional. Please read the prospectus carefully before investing. percentage of Fund net assets applicable to common shares plus VRTP Shares and Eaton Vance is part of Morgan Stanley Investment Management. Morgan Stanley Investment borrowings outstanding. Use of leverage creates an opportunity for income, but creates risks Management is the asset management division of Morgan Stanley. including greater price volatility. The cost of leverage rises and falls with changes in short- term interest rates. The Fund is required to maintain prescribed asset coverage for its borrowings, which could be reduced if Fund asset values decline. SEC 30-day yield is a measure of the income generated by the portfolio’s underlying asset over the trailing 30 days, relative to the asset base of the portfolio itself. INDEX INFORMATION: The Morningstar LSTA Leverage Loan Index is an index that covers more than 1,100 loan facilities and reflects the market-value-weighted performance of U.S. dollar denominated institutional leveraged loans. Prior to August 29, 2022, the index name was S&P/ LSTA Levarged Loan index. Unless otherwise stated, index returns do not reflect © 2024 Morgan Stanley. All rights reserved. Eaton Vance Distributors, Inc. RED 3423756 EXP: 03/31/2025 | SKU 3076 VER: 04/11/2024