Example Lab Report
Materials Science and Engineering Program Vanderbilt University 1. Introductory Section rd, On November 3 we performed the Beam Flexure laboratory experiment. The goal of this experiment was to be able to measure beam flexure as a function of stress using strain gages for beams made of steel, aluminum, and fiberglass. 2. Experimental Procedure For this lab, the first thing we did was measure each of the beams to learn its important dimensions including its height, total length, and the approximate distances between the edge of the beam and the placement point of the bending tester. Then we placed each beam inside the four-point bending tester and steadily increased the load applied to the beam as we measured its deflection and the strain on the top and bottom of the beam. Once finished the machine would be reset for each beam and for each of the beams there were two samples that were tested using two separate testers. 3. Results
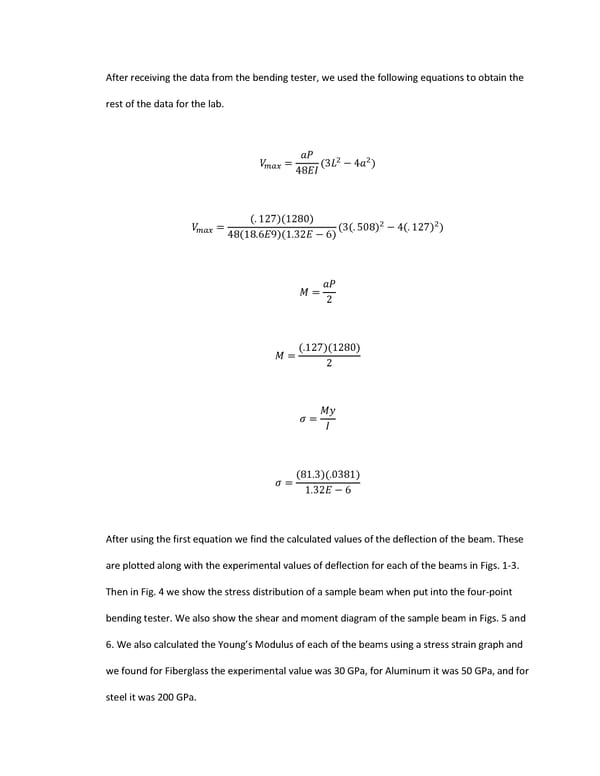
4. Discussion The first thing we see when we look the data we have calculated is the difference that exists between the calculated values for the deflection and the values we found experimentally. Some reasons for this variance could be the fact that these samples have slightly more or less flexibility due to imperfections during the manufacturing process or possible changes in the properties of the beams after repeated testing. Next we have sample stress distribution, shear, and moment diagrams for the beam in the tester which lets us see that the largest stresses and the largest shear values can be found along the left and right edges of the beam while the largest moment in the beam can be found in the center of it which causes its largest deflection to be in the center of the beam. Next, we calculated values of the Young’s Modulus for each of the materials. For fiberglass, we found the value to be 30 GPa which is about 12 off its theoretical value of 18.6, then for aluminum we found it to be 50 GPa which is about 18 off its value of 68, and we found the value for steel to be about 200 GPa which is the same as the theoretical value for the material. In our testing, we also came close to the yielding points of steel and aluminum which occur at about 10 and 9 kN respectively. Finally, we had attached strain gages to the bottom and top of the beam and the values they gave us are related since the gages should be reading the same strain but the signs will be switched since one side is in compression while the other side is in tension. 5. Summary
So, in this lab we managed to find a few key things about the beams we were testing. We graphed the relationship between the load applied and the deflection, found the distribution of the forces and moments in the beams when they are tested, and we also found the experimental values of the Young’s Modulus for each of the beams. Sincerely, Sanjay Ramaprasad
Appendix: Fig. 1 Deflection graph for Fiberglass Beam Fig. 2 Deflection graph for Steel Beam Fig. 3 Deflection graph for Aluminum Beam Figs. 4,5,6 Loading, Shear, and Moment diagram for beam under four-point loading