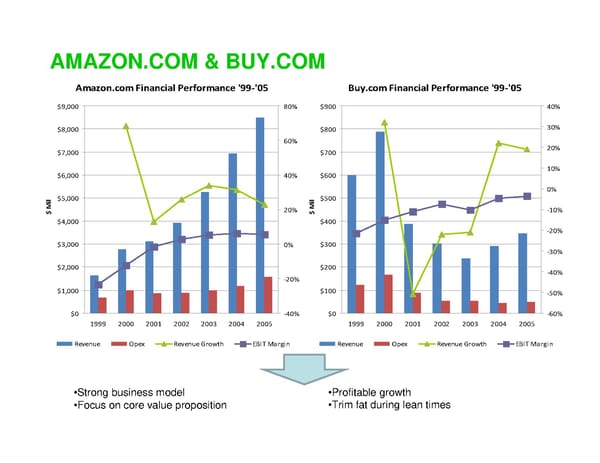
AMAZON.COM & BUY.COM Amazon.com Financial Performance '99‐'05 Buy.com Financial Performance '99‐'05 $9,000 80% $900 40% $8,000 $800 30% 60% $7,000 $700 20% 10% $6,000 40% $600 0% l$5,000 l$500 Mi Mi 20% ‐10% $ $ $4,000 $400 ‐20% $3,000 0% $300 ‐30% $2,000 $200 ‐40% ‐20% $1,000 $100 ‐50% $0 ‐40% $0 ‐60% 1999 2000 2001 2002 2003 2004 2005 1999 2000 2001 2002 2003 2004 2005 Revenue Opex Revenue Growth EBIT Margin Revenue Opex Revenue Growth EBIT Margin •Strong business model •Profitable growth •Focus on core value proposition •Trim fat during lean times
 Startups and the Economic Downturn Page 36 Page 38