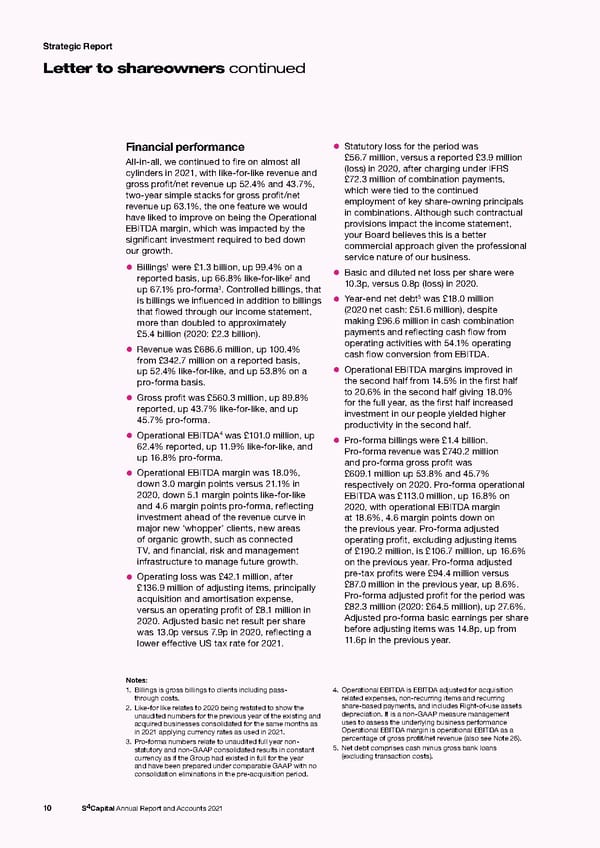
Strategic Report Letter to shareowners continued Financial performance • Statutory loss for the period was All-in-all, we continued to fire on almost all £56.7 million, versus a reported £3.9 million cylinders in 2021, with like-for-like revenue and (loss) in 2020, after charging under IFRS gross profit/net revenue up 52.4% and 43.7%, £72.3 million of combination payments, two-year simple stacks for gross profit/net which were tied to the continued revenue up 63.1%, the one feature we would employment of key share-owning principals have liked to improve on being the Operational in combinations. Although such contractual EBITDA margin, which was impacted by the provisions impact the income statement, significant investment required to bed down your Board believes this is a better our growth. commercial approach given the professional service nature of our business. 1 • Billings were £1.3 billion, up 99.4% on a • Basic and diluted net loss per share were reported basis, up 66.8% like-for-like2 and 10.3p, versus 0.8p (loss) in 2020. up 67.1% pro-forma3. Controlled billings, that 5 is billings we influenced in addition to billings • Year-end net debt was £18.0 million that flowed through our income statement, (2020 net cash: £51.6 million), despite more than doubled to approximately making £96.6 million in cash combination £5.4 billion (2020: £2.3 billion). payments and reflecting cash flow from • Revenue was £686.6 million, up 100.4% operating activities with 54.1% operating from £342.7 million on a reported basis, cash flow conversion from EBITDA. up 52.4% like-for-like, and up 53.8% on a • Operational EBITDA margins improved in pro-forma basis. the second half from 14.5% in the first half • Gross profit was £560.3 million, up 89.8% to 20.6% in the second half giving 18.0% reported, up 43.7% like-for-like, and up for the full year, as the first half increased 45.7% pro-forma. investment in our people yielded higher productivity in the second half. • Operational EBITDA4 was £101.0 million, up • Pro-forma billings were £1.4 billion. 62.4% reported, up 11.9% like-for-like, and Pro-forma revenue was £740.2 million up 16.8% pro-forma. and pro-forma gross profit was • Operational EBITDA margin was 18.0%, £609.1 million up 53.8% and 45.7% down 3.0 margin points versus 21.1% in respectively on 2020. Pro-forma operational 2020, down 5.1 margin points like-for-like EBITDA was £113.0 million, up 16.8% on and 4.6 margin points pro-forma, reflecting 2020, with operational EBITDA margin investment ahead of the revenue curve in at 18.6%, 4.6 margin points down on major new ‘whopper’ clients, new areas the previous year. Pro-forma adjusted of organic growth, such as connected operating profit, excluding adjusting items TV, and financial, risk and management of £190.2 million, is £106.7 million, up 16.6% infrastructure to manage future growth. on the previous year. Pro-forma adjusted • Operating loss was £42.1 million, after pre-tax profits were £94.4 million versus £136.9 million of adjusting items, principally £87.0 million in the previous year, up 8.6%. acquisition and amortisation expense, Pro-forma adjusted profit for the period was versus an operating profit of £8.1 million in £82.3 million (2020: £64.5 million), up 27.6%. 2020. Adjusted basic net result per share Adjusted pro-forma basic earnings per share was 13.0p versus 7.9p in 2020, reflecting a before adjusting items was 14.8p, up from lower effective US tax rate for 2021. 11.6p in the previous year. Notes: 1. Billings is gross billings to clients including pass- 4. O perational EBITDA is EBITDA adjusted for acquisition through costs. related expenses, non-recurring items and recurring 2. Like-for like relates to 2020 being restated to show the share-based payments, and includes Right-of-use assets unaudited numbers for the previous year of the existing and depreciation. It is a non-GAAP measure management acquired businesses consolidated for the same months as uses to assess the underlying business performance in 2021 applying currency rates as used in 2021. Operational EBITDA margin is operational EBITDA as a 3. Pro-forma numbers relate to unaudited full year non- percentage of gross profit/net revenue (also see Note 26). statutory and non-GAAP consolidated results in constant 5. Net debt comprises cash minus gross bank loans currency as if the Group had existed in full for the year (excluding transaction costs). and have been prepared under comparable GAAP with no consolidation eliminations in the pre-acquisition period. 10 S4Capital Annual Report and Accounts 2021
 s4 capital annual report and accounts 2021 Page 11 Page 13