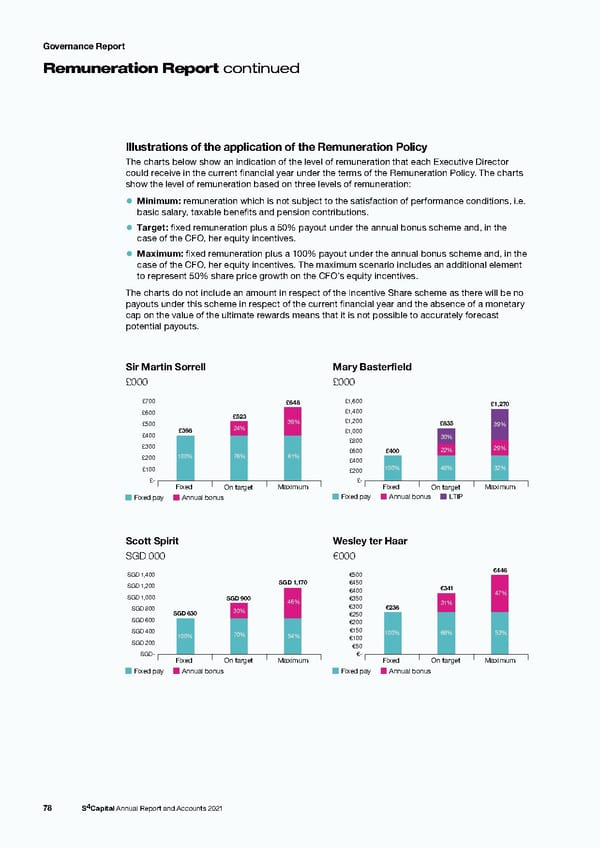
Governance Report Remuneration Report continued Illustrations of the application of the Remuneration Policy The charts below show an indication of the level of remuneration that each Executive Director could receive in the current financial year under the terms of the Remuneration Policy. The charts show the level of remuneration based on three levels of remuneration: • Minimum: remuneration which is not subject to the satisfaction of performance conditions, i.e. basic salary, taxable benefits and pension contributions. • Target: fixed remuneration plus a 50% payout under the annual bonus scheme and, in the case of the CFO, her equity incentives. • Maximum: fixed remuneration plus a 100% payout under the annual bonus scheme and, in the case of the CFO, her equity incentives. The maximum scenario includes an additional element to represent 50% share price growth on the CFO’s equity incentives. The charts do not include an amount in respect of the Incentive Share scheme as there will be no payouts under this scheme in respect of the current financial year and the absence of a monetary cap on the value of the ultimate rewards means that it is not possible to accurately forecast potential payouts. Sir Martin Sorrell Mary Basterfield £000 £000 £700 £648 £1,600 £1,270 £600 £523 £1,400 £500 39% £1,200 £835 39% £398 24% £1,000 £400 30% £800 £300 £600 £400 22% 29% £200 100% 76% 61% £400 £100 £200 100% 48% 32% £- £- Fixed On target Maximum Fixed On target Maximum Fixed pay Annual bonus Fixed pay Annual bonus LTIP Scott Spirit Wesley ter Haar SGD 000 €000 SGD 1,400 €500 €446 SGD 1,200 SGD 1,170 €450 €400 €341 47% SGD 1,000 SGD 900 46% €350 €300 €236 31% SGD 800 SGD 630 30% €250 SGD 600 €200 SGD 400 70% €150 100% 69% 53% 100% 54% €100 SGD 200 €50 SGD- €- Fixed On target Maximum Fixed On target Maximum Fixed pay Annual bonus Fixed pay Annual bonus 78 S4Capital Annual Report and Accounts 2021
 s4 capital annual report and accounts 2021 Page 79 Page 81