State of FinTech Report | PwC & SBC

THE STATE OF FINTECH CH TE N I F F O TE TA S E TH

State of FinTech Report | PwC & SBC - Page 1

Executive Summary FinTechhas transformed our daily lives thanks to personalised access to robo-advisors, innovative mobile payment solutions, instant cross-border transactions and many other applications. The evolving trend of FinTech products and services empower consumers and small businesses in ways that were unimaginable in the past. The potential disruptive innovation FinTechs bring in turn attracts significant funding from investors seeking the next BIG thing. This report draws out parallels seen between general tech trends on a macro scale and correlates them to the impact on FinTech. One highlight shows how China and India are spearheading the advancements that are shaping global trends in this sector. The cumulative total of FinTech investments in China alone outweighs all FinTech investments made in the entirety of the rest of the Asia Pacific region. The East is now in a position to innovate and not just adopt ideas coming from the west. FinTech might already seem mature, given the vast amount of funding poured into it, the increasing number of FinTech startups and corporate innovations being engineered today. Such a claim may have seemed farfetched 5 years ago when the level of funding in the FinTech industry stood at a meagre US$3.1m! Fast-forward to 2017, and in the first quarter alone, US$1.8bn has already been injected into the sector globally. CH The future of FinTech remains bright, in spite of claims that the current upward trend is a bubble. The World Bank Group TE (WBG) estimates that 42% of the global population still do not have access to a formal financial system. This presents a huge N opportunity to be tackled by FinTechs that cannot be addressed by traditional Financial Institutions. There are still untapped or I F new emerging markets waiting to be discovered. Asia has the largest percentage of the under-banked population and a large F O growing middle class who will soon need new solutions to address their wealth management and banking needs. TE TA Together, Startupbootcampand PwC have put together this report to provide a holistic view of the FinTech industry, starting S E from its current state, discussing where FinTech is headed, and the technological advances and geographical context that will TH lead it there. 2

Content 01 Global Tech Trends 02 Global FinTech Trends 03 Global State of FinTech CH TE N I F 04 The Future of Fintech in Asia Pacific F O TE TA S E TH 3

State of FinTech Report | PwC & SBC - Page 3

GLOBAL TECH TRENDS CH TE N I F F O TE TA S E TH

State of FinTech Report | PwC & SBC - Page 4

Global Tech Trends The top three global Tech Trends in 2017: z CH TE N I Artificial F Cybersecurity Mobile Payments F Intelligence & Advanced O Machine Learning TE TA S E TH 5

State of FinTech Report | PwC & SBC - Page 5

6 Artificial Intelligence & Advanced Machine Learning “We’re at an inflection point where artificial intelligence can help business make better and faster decisions. It requires an open mind—and a willingness to change—totakeadvantageofit.” Source: The humanfactor: Working with machines to make big decisions – PwC CH TE N I F F O TE TA S E TH Global Tech Trends: AI 6

State of FinTech Report | PwC & SBC - Page 6

Data Abundance Fuels Powerful Machine Learning Models The abundance of data has enabled platforms to scale and No. of software projects at Google using Deep generate new models as shown by the exponential growth in Learning number of AI related software projects being developed at 2700 Google. 2400 2100 At Startupbootcamp, we have noticed that an increased 1800 number of start-ups are putting data driven decision making 1500 and AI into the core of their products whereas many large 1200 corporations are still relying on intuition and experience when 900 it comes to making big decisions. 600 CH 300 TE N 0 I F F 2012 2013 2014 2015 O TE Source: Google TA S E TH Global Tech Trends: AI 7

Artificial Intelligence 2450+companiestracked,900fundedoverthepast5years MostActiveInvestors:In-Q-Tel,NEA,KhosiaVentures,YCombinator,IntelCapital,DataCollective Cumulativefundinginthesector: Infrastructure Applications US$539m US$493m US$457m US$1.1bn Machine Intelligence Computer Natural Language Enabling System Vision Processing Technology CH TE N I F F O TE US$98m US$7.7bn US$5bn US$908m TA S E Autonomous Enterprise Industry Consumer TH System Enables Global Tech Trends: AI 8

Funding Highlights - AI Overthepast10yearsAIapplicationsintheenterprise,industry andconsumersectorshave received a cumulative funding of US$13bnwhereasAIenablinginfrastructurereceivedUS$2.7bnoverthesameperiod. Cumulativefundinginthesector: US$13.bn US$2.7bn Applications Infrastructure Enterprise / Machine Intelligence Systems / US$539m US$7.7bn Computer Vision / US$493m Industry / CH US$5.0bn Natural Language Processing / US$457m TE N I Consumer / Enabling Technology / US$1.1bn F F US$908m O Autonomous System Enablers / US$98m TE TA S E TH Global Tech Trends: AI 9 9

Observations - AI Weareataninflectionpointwherecorporationsarerealising that artificial intelligence can supplement human judgement with data-driven insights and fundamentally changethewaytheymakedecisions. Within the US$13bn invested in AI applications, US$7.7bn has been invested in enterprise as more and more corporations realise that they need to be faster andmoresophisticatedwhenitcomestomakingimportantdecisions.Executives are now looking at mixing mind and machine to leverage data, understand risk, and gain a competitive edge. On the flip side, US$1.1bn has been invested in infrastructure enabling technology. Webelieve that funding in this segment will increase in the near future as CH it is the backbone for many AI applications. TE N I F F O TE TA S E TH Global Tech Trends: AI 10

State of FinTech Report | PwC & SBC - Page 10

Cybersecurity Damagecausedbycybercrimeisontherise: Amount of Monetary Damage Caused by Reported Cyber Crime (in millions U.S. dollars) 01 Data sourced from the FBI’s internet crime complaint center (IC3) reveals that reported 1250 1, 070.71 cyber crime damage has more than doubled over the past 5 years and experts are 1000 800.49 expecting the frequency of the attacks to 781.84 continue to rise. 750 581.44 485.25 02 Cyber attacks have steadily increased over time and in 2015, damage reported exceeded 500 US$1bnforthefirsttimeinhistory. CH 250 TE N I 0 F F O 2011 2012 2013 2014 2015 TE Source: FBI; IC3 US Department Justice, 2016 TA S E TH Global Tech Trends: Cybersecurity 11

Big Banks Join Forces Against Cybercriminal Networks As cyber threats become increasingly sophisticated, many financial institutions are coming together to share critical threat intelligence with peers, industry groups and governmentagencies. In 2016, for the first time ever, 8 of the largest US banks including JPMorgan, Bank of America and Goldman Sachs joined forces to share best practices on fighting cybercrime. CH In fact, PwC’s recent Global State of Information Security Survey in 2017 revealed that TE 55%ofsurveyedCIOsandCSOsworldwidecollaboratewithexternalpartners to N I F improvesecurityandreducerisk. F O TE This leads us to believe that there will be more cross industry collaboration to fight TA S powerful cybercrime networks. E TH Global Tech Trends: Cybersecurity 12

State of FinTech Report | PwC & SBC - Page 12

Enterprise Security US$1bn Software Suites 3130+ companies in the sector, 964 funded in past 5 years US$1bn US$3.6bn US$1.5bn US$718m Application Endpoint Anti- Email Security Security Fraud Security CH TE N I F F O US$4.2bn US$1bn US$4.2bn US$451m TE BYOD Website Network loT TA S Security Security Security Security E THCumulativefundinginthesector Global Tech Trends: Cybersecurity 13

Enterprise Security Most Active Investors: Intel Capital, US$2bn US$193m US$2.5bn US$20m Sequoia, BVP, NEA, Accel, KPCB, Data Industrial Identity & Access Server Paladin Capital, Greylock Security Security Management Security CH US$125m US$2.5bn US$689m US$1.6m TE Database Security Threat Cloud N I F Security Analytics Intelligence Security F O TE TA S E THCumulativefundinginthesector Global Tech Trends: Cybersecurity 14

Funding Highlights - Cybersecurity The network security segment has received the largest amount of funding with a total of US$4.2bn to date. However, the proliferation of smart devices has led to a rise in cyberattacks as these provide more access points (RFID, GPS, WiFi, etc.) and have historically been shipped with outdated software. And, although investments in this space have been historically low, we can expect funding to increase going forward. Cumulativefundinginthesector: US$451m US$4.2bn IoT Security Network Security CH TE Inside Secure (1995, IPO) Palo Alto Networks (2005, IPO) N I F F O TE TA S E TH Global Tech Trends: Cybersecurity 15

Observations - Cybersecurity PwC’s latest Global State of Information Security Survey revealed that: 01 62%ofrespondents worldwide have an Internet of Things security strategy in place or are currently implementingthisstrategy 02 Globally, 46% of surveyed organisations are investing in a security strategy for the Internet of Thingsoverthenext12months CH While network security has and will continue to attract a TE large part of investments, we believe that investments in N I F IoT security will grow as more and more organisations F O adoptIoTsecuritystrategies. TE TA S E TH

17 Mobile Payments Global Population and Mobile Penetration at Dec 2016 Smart phones and mobile connections are 100% everywhere. And, according to the World Bank: 80% 01 Wearehalfwaytoconnectingeveryone 60% 02 5.5 billion people above 14 years old have 40% close to 5 billion mobile phones 03 Out of the total mobile phones we have an 20% approximation of 2.5 billion smartphones 0 users % CH Developed China Latam MENA South Sub South SE Asia Other TE Market Asia Africa Mobile connectivity will continue to grow and Asia will N I continue to drive a large part of that growth as global F F Not Mobile economic power shifts from mature markets to O Mobile emergingeconomies. TE Smart Source: World Bank, TMW, CNNIC, a16z TA S E TH Global Tech Trends: Mobile First 17

State of FinTech Report | PwC & SBC - Page 17

Mobile Connectivity is Fueling Financial Inclusion Mobile and Contactless Payments Transaction Value A study from Juniper Research predicts that mobile and (in billions U.S. dollars) contactless payments will reach a global value of US$95bn 100 by2018. 80 Mobile payments is a step towards more for financial inclusion as it can lower the cost of providing basic financial services 60 by80%to90%. 40 For instance, the data collected through mobile payments enables lenders to assess the creditworthiness of borrowers 20 CH and can be used to create tools to help businesses better TE N managetheirfinances. 0 I F F 2015 2016 2017 2018 O TE Source: Juniper Research TA S E TH Global Tech Trends: Mobile First 18

Mobile Payments 1510+companiesinthesector,369fundedinpast5years MostActiveInvestors:SequoiaCaptial,EntreeCapital,AccelPartners Cumulativefundinginthesector: US$2.2bn US$2.4bn US$247m m-POS Wallet Carrier Billing CH TE N I F F O TE US$354m US$528m US$18m US$146m TA S E Technology Multi-Solutions Wearables Payment Gateway TH 19 Global Tech Trends: Mobile First 19

Funding Highlights – Mobile Payments In mobile first technologies, mobile wallets have attracted US$2.4bn in cumulative investment over the past 10 years. Cumulativefundinginthesector: Semi Closed / Paytm (2010, US$1.9bn) US$2.4bn P2P Money / Venmo(2009, US$1.3m, Acq.) Wallet White Label / Mozido (2008, US$302m) CH TE N I F F O TE TA S E TH Global Tech Trends: Mobile First 20

21 Observations - Mobile Payments The advancement of technology combined with ongoing infrastructure improvements has increased mobile phone penetration over the past years. This in turn has led to widespreadadoptionofmobilewallets. Rather than waiting a generation for incomes to rise and traditional banks to extend their reach, emerging economies have the opportunity to leverage mobile technologies to provide digital financial services for all, whichinturncanrapidlyunlockeconomicopportunityand CH accelerate social development. TE N I F F O TE TA S E TH Global Tech Trends: Mobile First 21

GLOBAL FINTECH TRENDS CH TE N I F F O TE TA S E TH

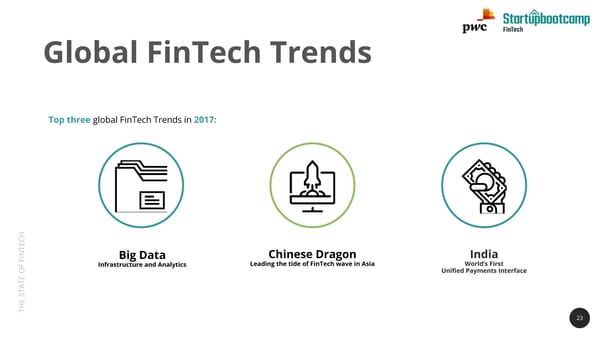
Global FinTech Trends Top three global FinTech Trends in 2017: z CH TE N I Big Data Chinese Dragon India F Infrastructure and Analytics Leading the tide of FinTech wave in Asia World’s First F Unified Payments Interface O TE TA S E TH 23

State of FinTech Report | PwC & SBC - Page 23

Big data and Moore’s Law According to Moore’s law, global data doubles every two years while the cost of storing data decreases at approximately the samerate. Data in Digital Universe vs. Data Storage Cost 10B US$0.2 Data Storage Cost 0 8B a e at US$0.1 g a D 5 r o f 6B t o s t f n o e B G CH aym 4B r P e TE p US$0.1 t N s I 0 F Co F 2B O TE Data in Digital Universes TA S 0 US$0.5 Source: IDC, May 2016 E 0 TH 2010 2011 2012 2013 2014 2015 Global FinTech Trends: Big Data 24

Storage Space For Big Data Worldwide Digital Data Created and Replicated 01 By 2020, the cumulative total of digital (in zettabytes) information is expected to grow from 3.2 35 zettabytesto40zettabytes. 30 In order to be able to meet these data storage 25 02 requirements, we would need the equivalent of 20 6,000 football fields. 15 CH 10 TE 5 N I F F O 0 TE 2006 2008 2010 2012 2014 2016 2018 2020 TA S E Source: Purefunds Big Data ETD (BDAT) TH Global FinTech Trends: Big Data 25

26 Scalend, part of the Startupbootcamp FinTech Singapore 2017 cohort, provides a ready to use data and insights discovery platform geared to solve data challenges faced by financial services companies. The platform brings data residing in multiple silos to a central secure data lake and applies machine learning and AI to generate customer journeys, fraud, and risk scores. Scalend’s mission is to deliver actionable insights now. CH RaviMadhira TE Co-founder,ScalendTechnologies N I F F O TE TA S E TH Global FinTech Trends: Big Data 26

State of FinTech Report | PwC & SBC - Page 26

Big Data Infrastructure 250+companiesinthesector,US$4.9bninfundingoverthepast5years MostActiveInvestors:DataCollective,Accel,NEA,Intel Capital Cumulativefundinginthesector: US$1.4bn US$1bn US$266m Big Data Stack Analytical Real Time Processing Processing CH TE N I F F O US$862m US$1.3bn US$161m TE TA S Management Operational E Tools Processing Application TH 27 Global FinTech Trends: Big Data 27

Big Data Analytics 480+companiesinthesector,US$5.78bninfundingoverthepast5years MostActiveInvestors:In-Q-Tel,AccelPartners,AndreessenHorowitz,NEA,Intel Cumulativefundinginthesector: US$985m US$989m US$897m Verticals Data Data Preparation Analytics CH TE N I F F O US$226m US$2.7bn US$131m TE TA Data Science Contextual Streaming S Platform Data Analytics Data Analytics E TH Global FinTech Trends: Big Data 28

Funding Highlights – Big Data Over the past year, Big Data Infrastructure and Big Data Analytics received a total funding of US$748m & US$1bn respectively. Cumulative funding in the sector: US$748m US$1bn Big Data Infrastructure Big Data Analytics Big Data Stack / US$1.4bn Verticals / US$985m Streaming Data Analytics / US$131m Analytical Processing / US$493m Data Analytics / US$989m CH Real Time Processing / US$266m Data Preparation / US$867m TE Management Tools / US$862m Big Data Analytics Suite / IPO N I F F Operational Processing / Data Science Platform / US$226m O US$1.3bn TE Contextual Data Analytics / TA Application / US$161m US$2.7bn S E TH Global FinTech Trends: Big Data 29

Observations - Big Data As technology advances, Big Data must have the necessary infrastructure in order to perform in-depth analytics. This is why both segments are highly correlated when it comestofunding. Both Big Data Infrastructure and Analytics have seen considerable investments over the past year, this can be explained by: 01 More Financial Institutions taking advantage of what the cloud can offer in termsofprotectionandscaleresultinginincreasesininfrastructureinvestment CH 02 An increasing amount of Financial Institutions building data driven insights TE into strategic decision making N I F F As a result, we believe that investments in both infrastructure as well as data and O TE analytics will continue to grow in the near future as more and more Financial TA Institutions put data at the heart of their strategy. S E TH Global FinTech Trends: Big Data 30

31 Chinese Dragons Are Leading The Tide of a Rising FinTech Wave in Asia According to the Economist, mainland China’s middle class is expected to account for more than a third of its population by 2030. By then, 35% of the population wil have annual disposable income in excess of US US$10,000, up from about 10 per cent today. And, while in the West, the major FinTech hubs (London, New York and Silicon Valley) have been innovating through incremental CH changes, China’s technology giants have been revolutionising many TE aspects of the financial services industry. N I F F O Countrywide adoption of FinTech by a growing tech savvy TE population, combined with considerable investments in TA S breakthrough innovation, leads us to believe that China will E continue to lead in FinTech innovation. TH Global FinTech Trends: Chinese Dragon 31

China Dominates Asia Pacific Investments Currently, total investment in China is higher than the combined investments from the rest of the countries in Asia Pacific. Some of the key reasons why China is dominatingtheFinTechspaceinclude: 01 China’s Internet giants  were the first to market whenitcametodevelopinge-commercethird-party payments. And, as a result, they now control 80% of the Chinese mobile paymentmarket 02 China’s eight FinTech unicorns have raised a CH total of US$9.4bn in funding and have a TE combinedvaluationofUS$96.4bn N I F 03 The four biggest FinTech unicorns in the world F O are Chinese: Ant Financial (US$60bn), Lufax TE (US$18.5bn), JD Finance (US$7bn), and Qufenqi TA S (US$5.9bn) E TH 32

FinTech China US$7.8bn US$7.4bn US$938m US$83m Alternative Horizontal Payment Crowdfunding Lending 940+ companies in the sector, 163 received funding rounds exceeding US$10m US$49m US$1.2bn US$1.2bn US$128m Most Active Investors: Sequoia Crypto InsurTech Consumer Mobile Capital, IDG, Matrix Partners, K2VC currency Finance Payments CH TE N I F F O US$1.3bn US$35m US$1.1bn US$1.8m TE Banking Enterprise TA Investment Tech S Remittance Tech Finance E TH Cumulativefundinginthesector Global FinTech Trends: Chinese Dragon 33

Funding Highlights – China Alternative lending is the sector that has attracted the most investment in China with a total cumulative funding amountingtoUS$7.8bn. Cumulativefundinginthesector: Commercial Loans / CTGZ (2013, US$162m) US$7.8bn Consumer Loans / YixinCapital (2015, US$1.13bn) Alternative Lending Horizontal / Ppmoney(2012, US$53.96m) Enabler/ Dimeng(2005, US$79m) CH TE N I F F O TE TA S E TH Global FinTech Trends: Chinese Dragon 34

35 Observations - China Alternative lending is the FinTech trend that has attracted the most investments in China. This has been driven by: 01 High demand for business and personal borrowing that remains unmet by thetraditionalstate-ownedbanksystem 02 Internet and technology platforms with huge market scale diversifying into newmarketsegments 03 Ahistorically unrestricted sector that remained unchecked by regulators Lowbarriers to entry combined with widespread internet access fueled a proliferation of alternative lending platforms in China. CH While some great platforms have emerged many have turned out to be giant Ponzi TE N I schemes – the most famous one being Euzabao where the founder allegedly escaped F F with over US$7.2bn from over 1 million investors. As a result of this Beijing has started O anationwidecrackdownonalternativelendingplatforms. TE TA S E TH Global FinTech Trends: Chinese Dragon 35

State of FinTech Report | PwC & SBC - Page 35

36 India Leading The Way For Digital Banking India has taken a number of steps that have ultimately enabled the launch of pureplaydigital banks, these include: 01 Aadhaar, launched in 2009 aims to provide a unique identification to all citizens of India. The authentication is based on biometrics and although this was originally intended to facilitate the delivery of government welfare services, it has now become an important part of customer onboardinganddigitalKYCverification 02 The United Payments Interface aims to make peer to peer transactions as CH fast and as easy as sending a text message. The other integral focus of UPI TE is interoperability (i.e. allowing transactions across banks). N I F F O TE TA S E TH Global FinTech Trends: India 36

37 India: World's First Unified Payment Interface India’s largest demonetisation was exercised on 8 November, 2016. All Rs 500 and Rs1,000 notes were abruptly withdrawn in a bid against black money, terror funding, corruption and fake currency proliferation. In search for a new alternative to replace cash, Indian citizens turned to digital transactions, which witnessed a 400 – 1,000% increase since the beginning of the demonetisation. At the same time, the National Payments Corporation of India (NPCI), the body that CH governs all retail payments in India, unveiled a new payment system called Unified TE PaymentInterfaceorUPI,whichenables: N I F 01 Payment systems to be fully interoperable across all payment system players, F O enabling funds to be transferred between mobile wallets from different financial TE institutions TA S E 02 Smartphones to double up as virtual debit cards for sending and receiving money TH instantly Global FinTech Trends: India 37

State of FinTech Report | PwC & SBC - Page 37

Payments Industry in India AsaresultofthedemonetizationandthedevelopmentofUPI: 01 Digital transactions grown by 4x in volume and value across various modes fromwalletstocardsandinterbanktransfersfromayearearlier 02 Card transactions at point of sale (PoS) terminals at merchant locations have surged 03 Thenumberofdebitcardtransactionsrosetomorethan1billioninJanuary from817millionlastyear 04 The number of ATM transactions have remained constant at around 700 million, the incremental growth has been driven mostly by card swipes at PoS terminals. CH TE The government has also been promoting smartphone-based transactions through N I F the UPI and the Bharat Interface for Money (BHIM). Both use the Immediate Payment F O Service (IMPS), which has seen a 160% increase in number of transactions amounting TE to 67 million in March up from 26 million one year ago. TA S E TH Global FinTech Trends: India 38

39 “Over the last five years, we have invested over S$5 billion in our technology and infrastructure, enabling us to develop products and platforms to meet our customers’ needs. From re-architecting our technology infrastructure to transforming our front end, we are becoming digital to the core. The bank’s customers, both individuals and corporates alike, are increasingly engaging and transacting more with us digitally. Some examples of our new services include digibank, India’s first branchless, paperless and signature-less bank; DBS iWealth, a platform that allows clients to conduct their banking transactions, manage their wealth and trade; and online account opening for SMEs. Coupled with a focus on agile methodology and journey thinking, we have been able to improve our speed to market and overall customer experience. This translates to more digitally-engaged customers, and higher returns per customer. Wehaverewired many parts of the bank, and changed the mindset of our employees. It CH is now easier for us to work with startups and we have partnered over 10 a year to deliver TE new products and services to our customers and staff. Through our talent management N I F hackathons, our employees are also given the opportunity to learn and work with F startups. We have also used hackathons to hire tech talent, interns and management O associates. TE TA S NealCross E TH Chief InnovationOfficer Global FinTech Trends: India 39

FinTech India US$396m US$64m US$527m US$4m Lending Software for Payment Crowdfunding Institutional Investor 1650+ companies in the sector, 213 werefunded the past 5 years Most Active Investors: Sequoia US$131m US$38m US$2.5bn Capital, Accel Partners, Blume InsurTech Consumer Mobile Ventures Finance Payments CH TE N I F F O US$338m US$49m US$1.8m TE Banking TA Investment Tech S Remittance Tech E TH Cumulativefundinginthesector Global FinTech Trends: India 40

Funding Highlights - India Over the past year, payments has attracted the largest part of investments in India, this is explained by a combination of maturepaymentplatformsexpandingintonewmarketsaswellasthedemonetisationofIndiancurrency. Cumulativefundinginthesector: Wallet / Paytm (2010, US$2.16bn) US$2.5bn mPOS/ Ezetap(2011, US$35m) Mobile Payments Money Transfer / Chillr (2013, US$7.5m) Payment Technology/ Juspay(2012, US$5.8m) CH TE N I F F O TE TA S E TH 41 Global FinTech Trends: India 41

Observations - India The introduction of UPI has been a game changer in the Indian FinTech scene. There has been a convergence of interest of various stakeholders, which has created an enabling environment for the development of mobile payments — the regulations on Payments Banks, the Central Government’s focus on financial inclusion and the near universal coverage of Aadhaar as a digital identity. While closed loop platforms with remittances at the core CH of their proposition have worked successfully in other TE parts of the developing world, similar attempts in India N I F have had limited success. A standardised interoperable F O system such as the UPI is a necessity for a multi- TE stakeholder ecosystem such as India. TA S E TH Global FinTech Trends: India 42

State of FinTech Report | PwC & SBC - Page 42

GLOBAL STATE OF FINTECH CH TE N I F F O TE TA S E TH

Global FinTech Funding Global FinTech Funding 01 In Q1 2017, US$1.8bn has been invested in 25 1845 2000 FinTech globally and, at the current run rate, 23.5 1800 1675 both deals and funding are on track to increase 20 20.8 1600 in 2017. 1452 ) 1400 B $ 15 1200 S unds It is worth noting that in 2016, there was an (U 1003 14.0 o 02 R t increase in funding of US$2.7B but a decrease n 1000 ou unding 10 651 800 F in the number of funding rounds. g Am n f i o d 600 r n be Fu 5 4.3 400 Num CH 3.1 200 TE 0 0 N I F 2012 2013 2014 2015 2016 F O Funding Amount (in USD billions) TE Number of Funding Rounds TA S E TH Source: Tracxn, March 2017 Global State of Fintech 44

Geographical Analysis - Fintech 18,400+companiesinthesector,4000+fundedsince2012 MostActiveInvestors:Startupbootcamp,500Startups,YCombinator Global FinTech Companies and Funding 100 100 80 80 s e 60 60 i d n e ofa ofd p n % m 40% % fu Co 40 40 38% 29% CH 28% TE 20 24% 24.8% 20 N 4.2% 2.7% 1.5% Percentage of Funded I F Percentage of Companies 3.9% 1.9% F 0 2.4% 0 Source: Tracxn, March 2017 O TE North- Europe APAC Others MENA South- TA America America S E TH Global State of Fintech 45

Global Funding Invested in FinTech 2016-17 32% North 9% America Europe US$8.3bn US$2.4bn Asia Pacific attracted the largest 56% amount of investment with a total of 1% US$14.8bn. However China South America Asia Pacific accounts for 88% of this, receiving US$182m 2% US$13.05bnin funding. MENA US$560m US$14.8bn CH TE N I F F O TE TA S E THFundingJanuary2016toFebruary2017 Global State of Fintech 46

Global Funding Invested in FinTech US$6.1bn US$24.3bn US$857m US$7.2bn Mobile Lending Investment Finance & Payment Tech Account 18,400+ companies in the sector, 4000+ funded since 2012 Most Active Investors: Startupbootcamp, 500 US$6.3bn US$6.1bn US$1.4bn US$583m Startups, Y Combinator Consumer Insurance Robo Blockchain Finance Tech Advisors CH TE N I F F O US$13bn US$2.1bn US$1.2bn US$1.1bn US$7.9bn TE Payments Remittance Crowdfunding Bitcoin TA Banking Tech S E THCumulativefundinginthesector 47

Global Funding Highlights The sectors that have received the most cumulative funding over the past year are Lending (US$24.3bn) and Payments (US$13bn). This comes with no surprise as the two largest markets in Asia Pacific, China and India, have been driven by lending and payments. Cumulativefundinginthesector: US$24.3bn US$13bn Lending Payments CH Business Loans/ Funding Circle (2010, US$373m) Gateway/ Stripe (2010, US$466m) TE Consumer Loans/ Lufax(2011, US$1.7bn) Wallet/ Mozido(2008, US$288.5m) N I F F Aggregators/ Nav(2012, US$52m) O TE TA S E TH Global State of Fintech 48

State of FinTech Report | PwC & SBC - Page 48

The Future of FinTech Asia Pacific CH TE N I F F O TE TA S E TH

State of FinTech Report | PwC & SBC - Page 49

The Future of FinTech 01 02 03 04 CH TE N I F Financial Wealth F RegTech InsurTech O Inclusion Management TE TA S E TH 50

State of FinTech Report | PwC & SBC - Page 50

Financial Inclusion The unmet deposit demand from the 100 Percentage of adults with traditional bank account un(der)banked demographic is estimatedtorepresentUS$360bn. 94% 80 The World Bank Group (WBG), 69% estimates that 2 billion or 42% of the global adult population does not have 60 52% 51% access to basic financial services. 46% 40 34% We believe that addressing the un(der)banked community, which is largely located in Asia Pacific, presents 20 CH 14% sizeable opportunities for both TE N startups and corporates. I 0 F F O Middle Sub-Saharan South Latin America Europe East Asia High-income TE East Africa Asia & & & OECD* TA Caribbean Central Asia Pacific countries S *Organization for Economic Co-Operation and Development E TH Source: Global Findex Database, 2014 The Future of FinTech in Asia Pacific: Financial Inclusion 51

State of FinTech Report | PwC & SBC - Page 51

A Global View of Financial Inclusion 01 Financial inclusion is a progression that develops in steps with payments as the optimal entry point 02 Using financial products does not necessarily transition to financial inclusion CH 03 Understanding the current state of financial TE inclusion is critical to determine future N I F priorities/focus areas. F O TE TA S E Source: Mastercard, 2014. TH 52

State of FinTech Report | PwC & SBC - Page 52

Microfinance Microfinance targets lower income levels 100 million people >US$20,000/yr For the past 50 years, Grameen Foundation has analysed micro financing trends and these demonstrate that lending to the poor haslowdefaultrates. 1.7 Billion People US$1,500 - US$20,000/yr Activities in Asia are developing thanks to microfinancing but many people still do not haveaccesstobasicfinancial services. Near Poor US$730 - Upper Poor US$1,500/yr CH < US$360 - Poor TE Commercial Banks US$730/yr 4 Billion N People I F F Credit Unions O < Destitute TE Microfinance US$360/yr TA S E TH Source: VISA International, World Bank, C.K Pralahad The Future of FinTech in Asia Pacific: Financial Inclusion 53

54 Micro-finance For The Unbanked Asia has the highest percentage of unbanked population in the world(21%inChina,47%inIndiaand64%inIndonesia). This is due to a number of factors: 01 Banks are difficult to access for people living in remote areas 02 Remittance and money transfer is not cost effective CH whentransferring small amounts TE N I F F 03 Financial institutions have not historically focused on O smallbusinessesleavingafundinggapinthemarket TE TA S E TH The Future of FinTech in Asia Pacific: Financial Inclusion 54

Microfinance Drivers •Microfinance is growing, this trend is primarily driven by: 01 High levels of mobile phone penetration in Asia, which in turn has led to the rise of internet platforms with massive scale. 02 Technology companies now have more transaction data than banks and they are CH funneling this into alternative lending platforms. TE N I F F O TE TA S E TH

State of FinTech Report | PwC & SBC - Page 55

Financial Inclusion – Asia Pacific MostActiveInvestors:GMOVentures,Legatum,KhosalaImpact,Accion,KinnevikAB LeadingandPaymentsectorhasreceivedthehighestamountoffunding Cumulativefundinginthesector: US$835m US$570m Alternative Leading Payments CH TE N I F F O US$166m US$139.5m US$77m TE TA S E Remittance Banking Tech Insurance Tech TH 56 The Future of FinTech in Asia Pacific: Financial Inclusion 56

Financial Inclusion – Asia Pacific Overthepastyear,alternativelending,whichisasubsectorofFinancialInclusion,hasreceivedthelargestpartoffunding with a total of US$835m invested to date. Cumulativefundinginthesector: Micro Loans Branch (2014, US$11m) US$835m Credit Builder Loans Oportun(2005, US$221m) Alternative Leading Unsecured Loans WeLab(2013, US$180m) CH TE N I F F O TE TA S E TH The Future of FinTech in Asia Pacific: Financial Inclusion 57

Observations – Financial Inclusion A study by Microfinance Information Exchange (MIX), revealed that the Asian microfinance market stands unrivalled in scale. Institutions facilitating microfinance in Asia will continue to play a critical role in improving access to finance for entrepreneurs, families and small business owners. And Asia is a prime market for alternative lenders, who usually use alternative means to assess creditworthiness, foregoing CH traditional credit scores altogether. TE N I F As a result, we believe that investments in micro F O financing will continue to grow and fuel economies in TE developing markets. TA S E TH 58 The Future of FinTech in Asia Pacific: Financial Inclusion 58

59 Expectation Gap Between Technology Capabilities And Demand in Wealth Management While high net worth individuals (HNWIs) enthusiastically adopt new technologies, the wealth management sector is one of the least tech literate segments of the Financial Services industry. PwC’s recent survey on the Wealth Management “Sink or Swim” revealed that 69% of high net worth individuals use online banking but only 1 out of 4 wealth managers offer digital channels that go beyond email. Additionally, by 2020, millennials and generation X will control over half of all CH investable assets and wealth management companies need to have a strategy to on- TE boardandretainthesegenerationsofdigitalnatives. N I F F O Wesee this as an opportunity for Wealth Managers to partner with FinTech companies to TE leverage on each others’ strengths to build products and services that cater for this wealthy TA S tech savvy generation. E TH The Future of FinTech in Asia Pacific: Wealth Management 59

Intelligent Things Are Disrupting the Wealth Management Sector CH TE Internet of Things Chatbots Robo-advisors N I F F A suite of technologies A computer program Digital financial advice O and applications that that engages in a based on mathematical TE TA provide information of conversation via rules or algorithms S E users to the providers auditory or textual TH methods The Future of FinTech in Asia Pacific: Wealth Management 60

The rise of Robo-advisors Intelligent things bring 2.2T Analysts estimate robo-advisors, including those run by banks will over see US$2.2. trillion both threats and 2.0 1.8 opportunities 1.6 Intelligent things are creating both opportunities and 1.4 challenges for the wealth management industry. 1.2 01 The internet of things provides Wealth Managers 1.0 with new data on their customers’ behaviour and 0.8 daily routines 0.6 0.4 02 Chatbots enable wealth managers to provide 24/7assistance anddigital concierge services 0.2 CH 0.0 03 Robo-advisors allow wealth management TE 2016 2017 2018 2019 2020 companies to effectively serve the mass-affluent N I F segment,thusexpandingtheirclientbase F O Shift from non-invested assets Source: A.T. Kearney TE Shift from invested assets TA S E TH The Future of FinTech in Asia Pacific: Wealth Management 61

State of FinTech Report | PwC & SBC - Page 61

Opportunities Bought by The Rise of Robo-advisors HNWIs around the globe utilising robo- advisors •Robo-advisors bring many opportunities to Europe wealthmanagers,someoftheseinclude: North 23% America 01 •Helping to deliver a low to high touch 6% toolkit that will free up relationship and portfolio managers to spend more time onvalueaddactivities 02 •Capturing a larger share of investable Asia- assets that a client may choose to Pacific CH allocate across different wealth solutions 14% 13% TE N I F of all HNWIs use robo- F03 •Allowing Wealth Management firms to advisors O effectively serve a mass affluent clientele TE TA S E TH The Future of FinTech in Asia Pacific: Wealth Management 62 Source: PwC Strategy & Global Wealth Management Survey 2016

63 By2020,wealthyindividuals will see their wealth managers as the trusted advisor. Not “ only do they trust their wealth managers with financial matters, they also trust that their financial advice takes into account their wider family and social needs and their life aspirations. A financial butler is another way of looking at this relationship. Two important pillars that will support this - the digitalization of the wealth managementbusinessandmakingadvicethecorebusiness,notproducts. The successful wealth managers of tomorrow will be client centric and will use technology to deliver personalised services to their clients. They will be able to mine data intelligently and use the insights to drive meaningful conversations with their CH clients. The future relationship between high net worth individuals and their asset TE managers will be founded on trust and value; not on products and fees. N I F F O Julia Leong, Partner, PwC Singapore TE TA S E TH The Future of FinTech in Asia Pacific: Wealth Management 63

Wealth Management –Asia Pacific 900+companiesinthesector,203fundedinlast5years,US$6.7Binvestedin2016–17. MostActiveInvestors:SequoiaCapital,K2VC,500Startups Cumulativefundinginthesector: US$158m US$818m Wealth Personal Finance Management Management Platform CH TE N I F F O US$10m US$6.4bn US$1.33bn TE TA Financial Financial Product S Literacy Conglomerate E Aggregators TH 64 The Future of FinTech in Asia Pacific: Wealth Management 64

Funding Highlights – Wealth Management Overthepast10years,wealthmanagementhasreceivedcumulativefundingofUS$158mandrecentlyalargepartofthis hasbeeninvestedinRobo-advisors. Cumulativefundinginthesector: Financial Planning US$158m Siyinjia (2014, US$30m) Investment Tools Wealth Caiyu (2014, US$3m) Management Robo-advisors Money Design (2013, US$12.18m) CH TE N I F F O TE TA S E TH The Future of FinTech in Asia Pacific: Wealth Management 65

66 Observations – Wealth Management To date, the segments that have received the largest amounts of funding are diversified FinTech companies such as Ant Financial; these have received cumulative funding of US$6.4bn to date. The second largest investment category are financial product aggregators that have received cumulative funding of US$1.33bn. Given the technology expectations gap and the opportunities bought by automation we can expect to see more and more emerging technologies being adopted by tech savvy Wealth CH Managers. However, incumbents that fail to put technology in TE the heart of their strategy run the risk of becoming irrelevant. N I F F O TE TA S E TH The Future of FinTech in Asia Pacific: Wealth Management 66

State of FinTech Report | PwC & SBC - Page 66

RegTech, a Sector on the Rise Ever since the 2008 financial crisis, regulators have been tightening legislation. Banks have responded to this by hiring thousands of compliance officers, thus solving an important problem by increasing headcount. This is even more the case in Asia where banks need to deal with many different regulatory regimes. Currently 80% of the AML budget of banks is related to headcount as many background checks are still done manually by large AML teams. And, while complex cases will continue to require human CH oversight, many of the lower-risk checks could be automated. TE N I F F And, unlike in FinTech, where there is some element of disruption O andcompetition, RegTech is an area where all parties benefit from TE TA working together. Which is why at Startupbootcamp we believe S E that RegTech is a sector on the rise. TH 67

State of FinTech Report | PwC & SBC - Page 67

Funding Highlights – Wealth Management Globally, US$819mhasbeeninvestedinRegTechhowever,only61.9%ofthishasbeeninvestedinAsiaPacific CATEGORY RegTechAsia Pacific RegTech Global 280+companies in the sector, 60+ funded in 1300+ companies in the sector, 320+ funded in last 5 last 5 years, US$771m invested in 2016 – 2017. years, US$2.23bn invested in 2016 – 2017. SUMMARY Most Active Investors: Startupbootcamp, IDG Most Active Investors: Startupbootcamp, Plug & Play Ventures India, Sequoia Capital, IDG Capital Tech Centre, Sequoia Capital, Intel Capital Partners CH TE Cumulative N I Funding US$61.9m US$819m F F O TE TA S E TH The Future of FinTech in Asia Pacific: RegTech 68

Observations – Wealth Management The total funding of RegTech in Asia Pacific represents less than 10% of the global RegTech funding. While there are many RegTech startups in Europe, Australia and India, there are surprisingly very few RegTech startups in Singapore and Hong Kong, which are the two major financial hubs in Asia. CH Given the central role that the regulators have had in TE driving the FinTech agenda in both Singapore and N I F HongKong,webelievethattherewillbeariseinboth F O government and non-governmental initiatives in the TE Regtechsector. TA S E TH

State of FinTech Report | PwC & SBC - Page 69

“ Picture 2020 in a urban centre somewhere in Asia. Insurance has changed. Insurance companies have changed, in fact some of them are unrecognisable. Customers are asking for brands by name and are giving insurance companies credit for “changing their lives” by helping them avoid risk. Health has become a central part of what insurance companies deliver. And much of the friction of buying insurance has been smoothed out, thanks to a couple of dozen Insurtechs that have stepped up and reimagined small bits of the way insurance used to be done. Agents are now augmented advisors. Claims are seamless and automatic. Solutions are intelligent and tailored. Further, risk products are being embedded into other categories. Behind all CH this is software enabling change through APIs. Still, some insurers and many TE insurtechs have fallen far behind and have been slow to let go or slow to partner. The N customers of those brands who have taken the lead are the real winners. I F F O Zia Zaman TE Chief Innovation Officer TA S E TH The Future of FinTech in Asia Pacific: InsurTech 70

Insurance Companies are Embracing Emerging Technologies More than half of the insurers are actively monitoring FinTech to respond This year, PwC’s Global FinTech Survey revealed that in 2017, competitively more than half insurance companies deal with FinTech 58% whereas in 2016 32% of insurance companies surveyed didnotdealwithFinTechatall. Almost half of the insurers are already engaging in partnerships with FinTech companies Insurance companiesarenowturningtoFinTechto: 45% 01 Reach and serve their clients in a highly targeted One-third of the respondents are hiring services from FinTech companies to improve internal operations and services manner 30% CH 02 Quantify and identify risk through sophisticated data TE 21% of incumbents set up start-up programs to incubate FinTech companies N modelsandanalytics I F F O 21% TE TA S Source: PwC Global FinTech Survey 2017 E TH The Future of FinTech in Asia Pacific: InsurTech 71 71

How InsurTech Empowers Incumbents Exploration InsurTechInvolvement Incumbents are actively monitoring Working with startups and fast growing new trends and innovations. Many of technology companies, whether this is these have established a presence in through open innovation programs or key innovation hubs to learn about through strategic partnerships, will the latest trends and technologies. enable insurance companies to learn and innovate at a faster pace. CH Sandbox testing New Product Development TE N I Setting up sandbox environments will Involvement in InsurTech will help F F enable incumbents test solutions and incumbents rethink the way that they O analyse results while minimizing risks. deliver products and services by taking a TE customer centric view. TA S E TH The Future of FinTech in Asia Pacific: InsurTech 72

InsurTech–Asia Pacific 280+companiesinthesector,70+fundedinlast5years MostActiveInvestors:Startupbootcamp,K2VC(XianfengEvergreen),CBCCapital,DWFund Cumulativefundinginthesector: US$931m US$53m US$34m Internet-First Employer P2P Insurers Insurance Insurance CH TE N I F F US$331m US$74m US$9m O TE TA Distribution Claims Management S Enablers Platform E & Resolution TH 73 The Future of FinTech in Asia Pacific: InsurTech 73

InsurTech–Asia Pacific Internet-First and digital insurers have received the largest part of funding across Asia Pacific with a total of US$932m invested to date. Cumulativefundinginthesector: US$931m ZhongAn Insurance 2014, US$931m Internet –First Tune Insurance2014 Insurers CH TE N I F F O TE TA S E TH The Future of FinTech in Asia Pacific: InsurTech 74

Observations - Insurtech Internet-First Insurers and digital insurance companies have accounted for the largest part of funding to date. The most prominent example being Zhong An Insurance from China that received US$931m. Internet-First Insurers enable a broader population to access insurance. As many people in Asia live in remote locations, a multitude of alternative digital distribution models have emerged. CH TE Although Internet-First Insurers have taken a large N I F part of historical funding, going forward investments F O will be channeled into new technologies that disrupt TE other segments of the insurance value chain, such as TA S claims managementandcustomeronboarding. E TH 75 The Future of FinTech in Asia Pacific: InsurTech 75

State of FinTech Report | PwC & SBC - Page 75

Conclusion CH TE N I F F O TE TA S E TH

Conclusion 01 In 2016, 6 out of 10 of the leading FinTech geographic regions are from Asia (i.e. China, Hong Kong, Singapore, SouthKorea,JapanandAustralia). 02 At Startupbootcamp, we have looked at thousands of FinTech startups from Asia and we are very excited with the growthrateshownbytheregion. CH 03 WeareconfidentthatAsiaPacificisanupandcomingregion TE in the FinTech ecosystem. N I F F O Follow us on “Facebook”, “Twitter” or “Linkedin” for more TE exciting FinTech news in Asia. TA S E TH 77

State of FinTech Report | PwC & SBC - Page 77

Startupbootcamp CH TE N I F F O TE TA S E TH

Global Leading Startup Edindhoven Accelerator London Amsterdam Chengdu 412 New York Berlin Startups Accelerated 18 Singapore Exits P 76% Istanbul M Graduated Funded Rome Miami TCA Barcelona O €217M Mexico Mumbai BO Total Funding Raised P RTU 2012 South Africa STA Jobs Created 79

Each Program has a Vertical Insurance Food Tech Industry Focus Startupbootcampprograms target a Smart Digital Transport specific industry to attract global Materials Health & Energy FinTech startups and partners P M TCA O BO P RTU ECommerce Mobile Smart City loT & Data & Living STACumulativefundinginthesector 80

Using a Proven Acceleration Model Scaling Startups Over 3 months The Program provides all the tools to take Founders are taken through a focused 3- a startup from its initial launch to month program to address all critical developing a highly scalable business areas of their business and prepare model with solid revenue growth operations for future scale P M Targeted Connections Industry Focus TCA O Partners and mentors of the program The program only supports startups BO provide startups with an unparalleled within a specific industry in order to P level of highly curated access, insights, optimise a founder’s time and provide RTU technology, and industry support the most targeted possible value STA 81

412 STARTUPS CH TE ACCELERATED N I F F O TE TA S E TH 82

Whilst Delivering Results to 100+ partners P M TCA O BO P RTU STA Examples of Startupbootcamp Partners 83

Our Partners P M TCA O BO P RTU STA 84

Building Trust in Society And Solving Important Problems CH TE N I F F O TE TA S E TH 85

CH TE N I F F O TE TA S E TH

Team Members Startupbootcamp STEVEN TONG YEW PING LIM Managing Director Analyst ASIA PwC CH TE N I F F O TE TA ANTONY WANYI WONG S E ELDRIDGE FinTech Director TH FinTech Leader 87

State of FinTech Report | PwC & SBC - Page 87

Come Talk To Us… CH TE N Steven Tong Antony Eldridge WanyiWong I F F Managing Director FinTech Leader FinTech Director O [email protected] [email protected] [email protected] TE TA S E TH 88

State of FinTech Report | PwC & SBC - Page 88

Thank You CH TE N I F F O TE TA S E TH