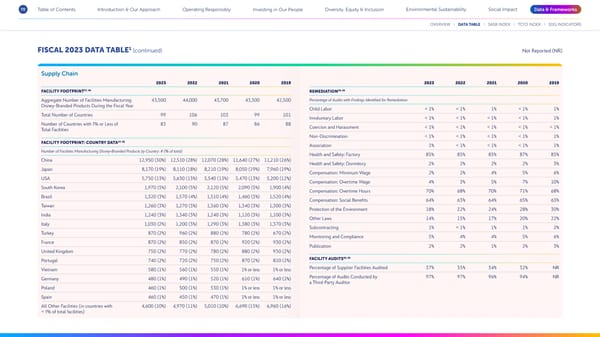
70 Table of Contents Introduction & Our Approach Operating Responsibly Investing in Our People Diversity, Equity & Inclusion Environmental Sustainability Social Impact Data & Frameworks OVERVIEW DATA TABLE SASB INDEX TCFD INDEX SDG INDICATORS FISCAL 2023 DATA TABLE1 (continued) Not Reported (NR) Supply Chain 2023 2022 2021 2020 2019 2023 2022 2021 2020 2019 47, 48 49, 50 FACILITY FOOTPRINT REMEDIATION Aggregate Number of Facilities Manufacturing 43,500 44,000 43,700 43,300 42,500 Percentage of Audits with Findings Identi昀椀ed for Remediation Disney-Branded Products During the Fiscal Year Child Labor < 1% < 1% 1% < 1% 1% Total Number of Countries 99 106 103 99 101 Involuntary Labor < 1% < 1% < 1% < 1% 1% Number of Countries with 1% or Less of 83 90 87 86 88 Coercion and Harassment < 1% < 1% < 1% < 1% < 1% Total Facilities Non-Discrimination < 1% < 1% < 1% < 1% 1% FACILITY FOOTPRINT: COUNTRY DATA47, 48 Association 1% < 1% < 1% < 1% 1% Number of Facilities Manufacturing Disney-Branded Products by Country: # (% of total) Health and Safety: Factory 85% 85% 85% 87% 85% China 12,950 (30%) 12,510 (28%) 12,070 (28%) 11,640 (27%) 11,210 (26%) Health and Safety: Dormitory 2% 2% 2% 2% 3% Japan 8,170 (19%) 8,110 (18%) 8,210 (19%) 8,050 (19%) 7,960 (19%) Compensation: Minimum Wage 2% 2% 4% 5% 6% USA 5,750 (13%) 5,630 (13%) 5,540 (13%) 5,470 (13%) 5,200 (12%) Compensation: Overtime Wage 4% 3% 5% 7% 10% South Korea 1,970 (5%) 2,100 (5%) 2,120 (5%) 2,090 (5%) 1,900 (4%) Compensation: Overtime Hours 70% 68% 70% 71% 68% Brazil 1,320 (3%) 1,570 (4%) 1,510 (4%) 1,460 (3%) 1,520 (4%) Compensation: Social Bene昀椀ts 64% 63% 64% 65% 63% Taiwan 1,260 (3%) 1,270 (3%) 1,360 (3%) 1,340 (3%) 1,300 (3%) Protection of the Environment 18% 22% 24% 28% 30% India 1,240 (3%) 1,340 (3%) 1,240 (3%) 1,120 (3%) 1,100 (3%) Other Laws 14% 15% 17% 20% 22% Italy 1,030 (2%) 1,200 (3%) 1,290 (3%) 1,380 (3%) 1,370 (3%) Subcontracting 1% < 1% 1% 1% 2% Turkey 870 (2%) 960 (2%) 880 (2%) 780 (2%) 670 (2%) Monitoring and Compliance 5% 4% 4% 5% 6% France 870 (2%) 850 (2%) 870 (2%) 920 (2%) 930 (2%) Publication 2% 2% 1% 2% 3% United Kingdom 750 (2%) 770 (2%) 780 (2%) 880 (2%) 930 (2%) Portugal 740 (2%) 720 (2%) 750 (2%) 870 (2%) 810 (2%) FACILITY AUDITS49, 50 Vietnam 580 (1%) 560 (1%) 550 (1%) 1% or less 1% or less Percentage of Supplier Facilities Audited 37% 35% 34% 32% NR Germany 480 (1%) 490 (1%) 520 (1%) 610 (1%) 640 (2%) Percentage of Audits Conducted by 97% 97% 96% 94% NR a Third-Party Auditor Poland 460 (1%) 500 (1%) 530 (1%) 1% or less 1% or less Spain 460 (1%) 450 (1%) 470 (1%) 1% or less 1% or less All Other Facilities (in countries with 4,600 (10%) 4,970 (11%) 5,010 (10%) 6,690 (15%) 6,960 (16%) < 1% of total facilities)
 Disney 2023 Sustainability & Social Impact Report Page 69 Page 71