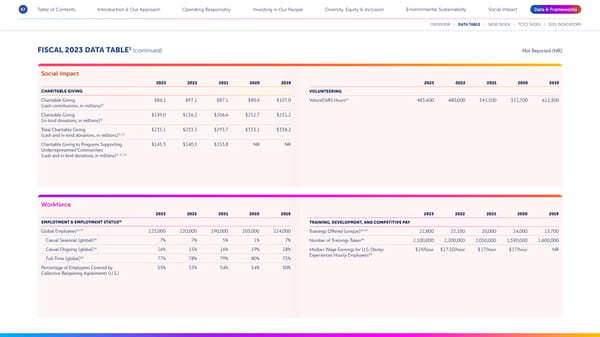
67 Table of Contents Introduction & Our Approach Operating Responsibly Investing in Our People Diversity, Equity & Inclusion Environmental Sustainability Social Impact Data & Frameworks OVERVIEW DATA TABLE SASB INDEX TCFD INDEX SDG INDICATORS FISCAL 2023 DATA TABLE1 (continued) Not Reported (NR) Social Impact 2023 2022 2021 2020 2019 2023 2022 2021 2020 2019 CHARITABLE GIVING VOLUNTEERING Charitable Giving $86.1 $97.1 $87.1 $80.4 $107.0 34 VoluntEARS Hours 483,600 480,000 341,500 321,700 612,300 31 (cash contributions, in millions) Charitable Giving $149.0 $136.2 $206.6 $252.7 $231.2 (in-kind donations, in millions)32 Total Charitable Giving $235.1 $233.3 $293.7 $333.1 $338.2 31, 32 (cash and in-kind donations, in millions) Charitable Giving to Programs Supporting $145.3 $140.3 $153.8 NR NR Underrepresented Communities 31, 32, 33 (cash and in-kind donations, in millions) Workforce 2023 2022 2021 2020 2019 2023 2022 2021 2020 2019 35 EMPLOYMENT & EMPLOYMENT STATUS TRAINING, DEVELOPMENT, AND COMPETITIVE PAY Global Employees36, 37 225,000 220,000 190,000 203,000 224,000 Trainings Offered (unique)38, 39 22,800 22,100 20,000 24,000 13,700 Casual Seasonal (global)36 7% 7% 5% 1% 7% 38 Number of Trainings Taken 2,100,000 2,200,000 2,050,000 1,590,000 1,600,000 36 Casual Ongoing (global) 16% 15% 16% 19% 18% Median Wage Earnings for U.S. Disney $19/hour $17.50/hour $17/hour $17/hour NR 40 Full-Time (global)36 77% 78% 79% 80% 75% Experiences Hourly Employees Percentage of Employees Covered by 55% 53% 54% 54% 50% Collective Bargaining Agreements (U.S.)
 Disney 2023 Sustainability & Social Impact Report Page 66 Page 68