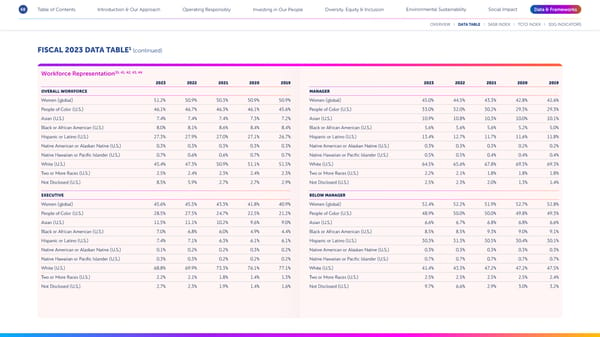
68 Table of Contents Introduction & Our Approach Operating Responsibly Investing in Our People Diversity, Equity & Inclusion Environmental Sustainability Social Impact Data & Frameworks OVERVIEW DATA TABLE SASB INDEX TCFD INDEX SDG INDICATORS FISCAL 2023 DATA TABLE1 (continued) 35, 41, 42, 43, 44 Workforce Representation 2023 2022 2021 2020 2019 2023 2022 2021 2020 2019 OVERALL WORKFORCE MANAGER Women (global) 51.2% 50.9% 50.3% 50.9% 50.9% Women (global) 45.0% 44.5% 43.3% 42.8% 42.6% People of Color (U.S.) 46.1% 46.7% 46.3% 46.1% 45.6% People of Color (U.S.) 33.0% 32.0% 30.2% 29.3% 29.3% Asian (U.S.) 7.4% 7.4% 7.4% 7.3% 7.2% Asian (U.S.) 10.9% 10.8% 10.3% 10.0% 10.1% Black or African American (U.S.) 8.0% 8.1% 8.6% 8.4% 8.4% Black or African American (U.S.) 5.6% 5.6% 5.6% 5.2% 5.0% Hispanic or Latino (U.S.) 27.3% 27.9% 27.0% 27.1% 26.7% Hispanic or Latino (U.S.) 13.4% 12.7% 11.7% 11.6% 11.8% Native American or Alaskan Native (U.S.) 0.3% 0.3% 0.3% 0.3% 0.3% Native American or Alaskan Native (U.S.) 0.3% 0.3% 0.3% 0.2% 0.2% Native Hawaiian or Paci昀椀c Islander (U.S.) 0.7% 0.6% 0.6% 0.7% 0.7% Native Hawaiian or Paci昀椀c Islander (U.S.) 0.5% 0.5% 0.4% 0.4% 0.4% White (U.S.) 45.4% 47.3% 50.9% 51.1% 51.5% White (U.S.) 64.5% 65.6% 67.8% 69.3% 69.3% Two or More Races (U.S.) 2.5% 2.4% 2.3% 2.4% 2.3% Two or More Races (U.S.) 2.2% 2.1% 1.8% 1.8% 1.8% Not Disclosed (U.S.) 8.5% 5.9% 2.7% 2.7% 2.9% Not Disclosed (U.S.) 2.5% 2.3% 2.0% 1.3% 1.4% EXECUTIVE BELOW MANAGER Women (global) 45.6% 45.5% 43.3% 41.8% 40.9% Women (global) 52.4% 52.2% 51.9% 52.7% 52.8% People of Color (U.S.) 28.5% 27.5% 24.7% 22.5% 21.2% People of Color (U.S.) 48.9% 50.0% 50.0% 49.8% 49.3% Asian (U.S.) 11.5% 11.1% 10.2% 9.6% 9.0% Asian (U.S.) 6.6% 6.7% 6.8% 6.8% 6.6% Black or African American (U.S.) 7.0% 6.8% 6.0% 4.9% 4.4% Black or African American (U.S.) 8.5% 8.5% 9.3% 9.0% 9.1% Hispanic or Latino (U.S.) 7.4% 7.1% 6.3% 6.1% 6.1% Hispanic or Latino (U.S.) 30.3% 31.3% 30.5% 30.4% 30.1% Native American or Alaskan Native (U.S.) 0.1% 0.2% 0.2% 0.3% 0.2% Native American or Alaskan Native (U.S.) 0.3% 0.3% 0.3% 0.3% 0.3% Native Hawaiian or Paci昀椀c Islander (U.S.) 0.3% 0.3% 0.2% 0.2% 0.2% Native Hawaiian or Paci昀椀c Islander (U.S.) 0.7% 0.7% 0.7% 0.7% 0.7% White (U.S.) 68.8% 69.9% 73.3% 76.1% 77.1% White (U.S.) 41.4% 43.3% 47.2% 47.2% 47.5% Two or More Races (U.S.) 2.2% 2.1% 1.8% 1.4% 1.3% Two or More Races (U.S.) 2.5% 2.5% 2.5% 2.5% 2.4% Not Disclosed (U.S.) 2.7% 2.3% 1.9% 1.4% 1.6% Not Disclosed (U.S.) 9.7% 6.6% 2.9% 3.0% 3.2%
 Disney 2023 Sustainability & Social Impact Report Page 67 Page 69