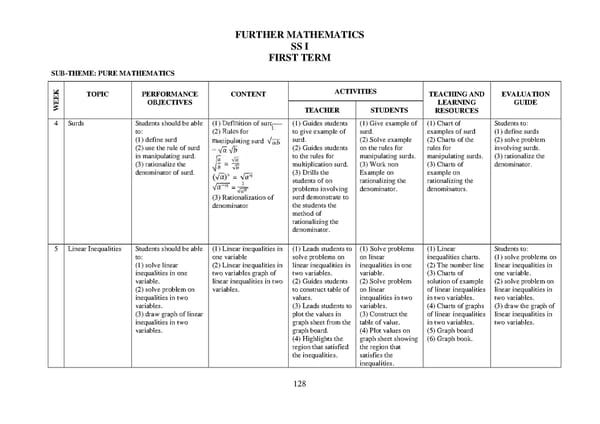
FURTHER MATHEMATICS SS I FIRST TERM SUB-THEME: PURE MATHEMATICS K TOPIC PERFORMANCE CONTENT ACTIVITIES TEACHING AND EVALUATION E OBJECTIVES LEARNING GUIDE WE TEACHER STUDENTS RESOURCES 4 Surds Students should be able (1) Definition of surd (1) Guides students (1) Give example of (1) Chart of Students to: to: (2) Rules for to give example of surd. examples of surd (1) define surds (1) define surd manipulating surd surd. (2) Solve example (2) Charts of the (2) solve problem (2) use the rule of surd √ (2) Guides students on the rules for rules for involving surds. = √ in manipulating surd. √ to the rules for manipulating surds. manipulating surds. (3) rationalize the (3) rationalize the = √ multiplication surd. (3) Work non (3) Charts of denominator. denominator of surd. √ (3) Drills the Example on example on n ( ) = √ √ students of on rationalizing the rationalizing the = √ problems involving denominator. denominators. √ surd demonstrate to (3) Rationalization of denominator the students the method of rationalizing the denominator. 5 Linear Inequalities Students should be able (1) Linear inequalities in (1) Leads students to (1) Solve problems (1) Linear Students to: to: one variable solve problems on on linear inequalities charts. (1) solve problems on (1) solve linear (2) Linear inequalities in linear inequalities in inequalities in one (2) The number line linear inequalities in inequalities in one two variables graph of two variables. variable. (3) Charts of one variable. variable. linear inequalities in two (2) Guides students (2) Solve problem solution of example (2) solve problem on (2) solve problem on variables. to construct table of on linear of linear inequalities linear inequalities in inequalities in two values. inequalities in two in two variables. two variables. variables. (3) Leads students to variables. (4) Charts of graphs (3) draw the graph of (3) draw graph of linear plot the values in (3) Construct the of linear inequalities linear inequalities in inequalities in two graph sheet from the table of value. in two variables. two variables. variables. graph board. (4) Plot values on (5) Graph board (4) Highlights the graph sheet showing (6) Graph book. region that satisfied the region that the inequalities. satisfies the inequalities. 128
 WAEC Further Mathematics Scheme of Work Page 2 Page 4