
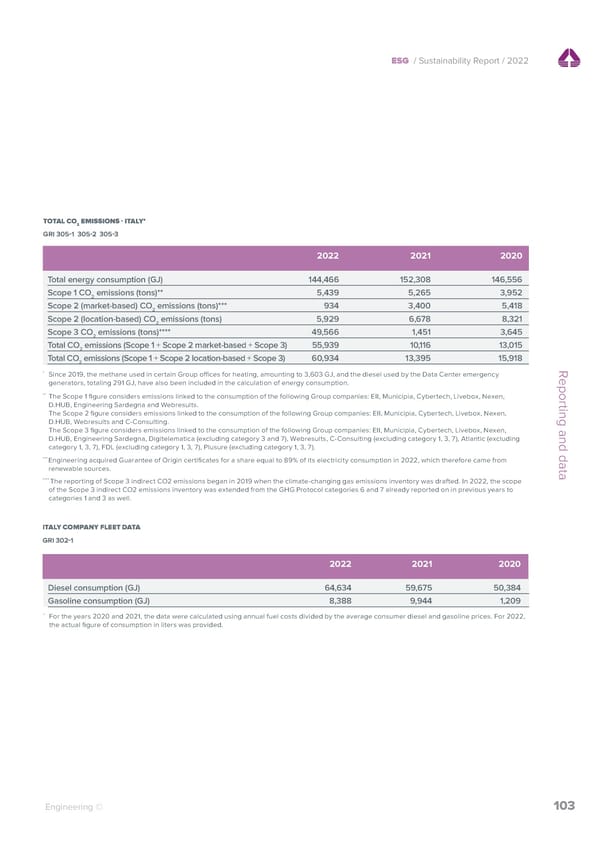
ESG / Sustainability Report / 2022 ESG / Sustainability Report / 2022 ENVIRONMENTAL DATA WATER TOTAL CO EMISSIONS - ITALY* 2 GRI 305 1 305 2 305 3 2022 2021 2020 2022 2021 2020 Withdrawals of groundwater* (millions of m3) 0.95 0.51 1.02 Discharges of industrial wastewater from cooling (millions of m3) 0.95 0.51 1.02Total energy consumption (GJ) 144,466 152,308 146,556 Scope 1 CO emissions (tons)** 5,439 5,265 3,952 * Water is withdrawn only to cool the Pont-Saint-Martin Data Center and it is not subjected to any industrial process aside from the change in 2 temperature; the increase in flow expected as part of the hydronic pump expansion project does not have significant impacts on the environment Scope 2 (market-based) CO emissions (tons)*** 934 3,400 5,418 2 and has already been authorized by the local authorities. The temperature of the water returned to the Lys stream is compliant with the technical Scope 2 (location-based) CO emissions (tons) 5,929 6,678 8,321 specifications of the Valle d’Aosta Region concession. 2 Scope 3 CO emissions (tons)**** 49,566 1,451 3,645 2 Total CO emissions (Scope 1 + Scope 2 market-based + Scope 3) 55,939 10,116 13,015 2 Total CO emissions (Scope 1 + Scope 2 location-based + Scope 3) 60,934 13,395 15,918 2 GROUP DATA CENTER ENERGY CONSUMPTION* Since 2019, the methane used in certain Group o ces for heating, amounting to 3,603 GJ, and the diesel used by the Data Center emergency Reporting and data GRI 302 1 generators, totaling 291 GJ, have also been included in the calculation of energy consumption. ** The Scope 1 figure considers emissions linked to the consumption of the following Group companies: EII, Municipia, Cybertech, Livebox, Nexen, PONT-SAINT-MARTIN 2022 2021 2020 D.HUB, Engineering Sardegna and Webresults. The Scope 2 figure considers emissions linked to the consumption of the following Group companies: EII, Municipia, Cybertech, Livebox, Nexen, D.HUB, Webresults and C-Consulting. Electricity consumption GWh 7.02 8.66 9.97 The Scope 3 figure considers emissions linked to the consumption of the following Group companies: EII, Municipia, Cybertech, Livebox, Nexen, Electricity consumption GJ 25,263 31,184 35,887D.HUB, Engineering Sardegna, Digitelematica (excluding category 3 and 7), Webresults, C-Consulting (excluding category 1, 3, 7), Atlantic (excluding category 1, 3, 7), FDL (excluding category 1, 3, 7), Plusure (excluding category 1, 3, 7). Power Usage E ectiveness (PUE) 1.48 1.51 1.52*** Engineering acquired Guarantee of Origin certificates for a share equal to 89% of its electricity consumption in 2022, which therefore came from Reporting and data renewable sources. TURIN 2022 2021 2020 **** The reporting of Scope 3 indirect CO2 emissions began in 2019 when the climate-changing gas emissions inventory was drafted. In 2022, the scope of the Scope 3 indirect CO2 emissions inventory was extended from the GHG Protocol categories 6 and 7 already reported on in previous years to categories 1 and 3 as well. Electricity consumption GWh 1.36 1.7 1.99 Electricity consumption GJ 4,912 6,130 7,159ITALY COMPANY FLEET DATA Power Usage E ectiveness (PUE) 1.84 1.84 1.80 GRI 302 1 VICENZA 2022 2021 2020 2022 2021 2020 Electricity consumption GWh 2.93 3.03 3.32Diesel consumption (GJ) 64,634 59,675 50,384 Electricity consumption GJ 10,532 10,913 11,934Gasoline consumption (GJ) 8,388 9,944 1,209 Power Usage E ectiveness (PUE) 1.82 1.84 1.75* For the years 2020 and 2021, the data were calculated using annual fuel costs divided by the average consumer diesel and gasoline prices. For 2022, the actual figure of consumption in liters was provided. ASSAGO 2022 2021 2020 Electricity consumption GWh 0.55 2.42 3.17 Electricity consumption GJ 1,962 8,728 11,412 Power Usage E ectiveness (PUE) 2.20 2.20 2.14 102 Engineering © Engineering © 103
 2022 | ESG Report Page 102 Page 104