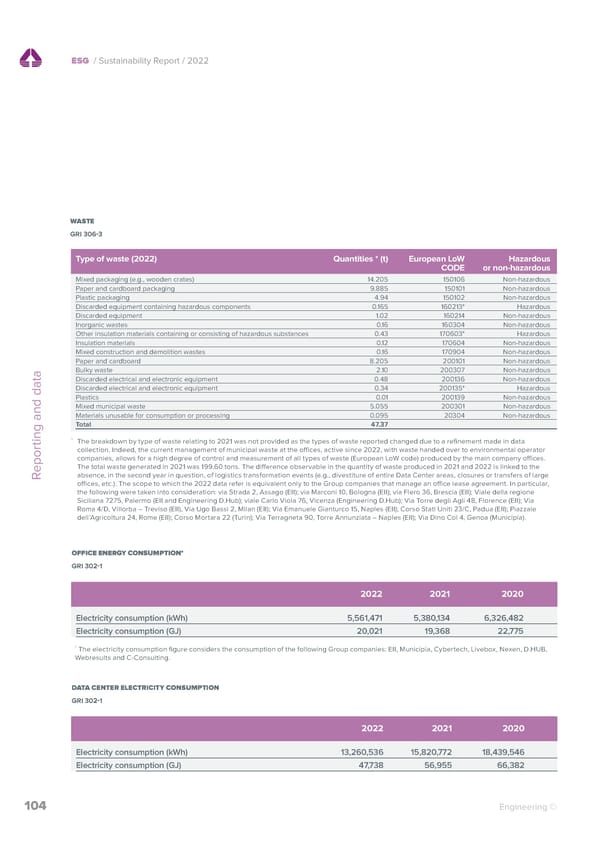
ESG / Sustainability Report / 2022 ESG / Sustainability Report / 2022 WASTE HEALTH AND SAFETY GRI 306 3 GRI 403 8 403 9 Type of waste (2022) Quantities * (t) European LoW Hazardous Workers covered by an occupational health CODE or non-hazardous and safety management system Unit of measurement 2022 2021 2020 Mixed packaging (e.g., wooden crates) 14.205 150106 Non-hazardous ITALY* Paper and cardboard packaging 9.885 150101 Non-hazardous Number and percentage of all employees n. 7,943 6,532 3.77 Plastic packaging 4.94 150102 Non-hazardous covered by such a system % 73.5% 68% 40% Discarded equipment containing hazardous components 0.165 160213* Hazardous Discarded equipment 1.02 160214 Non-hazardous Number and percentage of all employees Inorganic wastes 0.16 160304 Non-hazardous covered by such a system that has been n. 7,943 6,532 3.77 Other insulation materials containing or consisting of hazardous substances 0.43 170603* Hazardous internally audited % 73.5% 68% 40% Insulation materials 0.12 170604 Non-hazardous Mixed construction and demolition wastes 0.16 170904 Non-hazardous Number and percentage of all employees covered Paper and cardboard 8.205 200101 Non-hazardous by such a system that has been internally n. 7,943 6,532 3.77 Bulky waste 2.10 200307 Non-hazardous audited or certified by an external party % 73.5% 68% 40% Reporting and data Discarded electrical and electronic equipment 0.48 200136 Non-hazardous Discarded electrical and electronic equipment 0.34 200135* Hazardous Total number of employees n. 10,803 9,605 9,427 Plastics 0.01 200139 Non-hazardous * Mixed municipal waste 5.055 200301 Non-hazardous The reference scope for the year 2022 includes the following entities: Engineering Ingegneria Informatica; Engineering DHUB; Municipia; WebResults; Materials unusable for consumption or processing 0.095 20304 Non-hazardous Nexen; Engineering Sardegna; Digitelematica; Livebox. This scope coincides with that reported on in 2021, with the exception of Digitelematica and Total 47.37 Livebox, which were included in the scope during the 2022 reporting year. * The breakdown by type of waste relating to 2021 was not provided as the types of waste reported changed due to a refinement made in data collection. Indeed, the current management of municipal waste at the o ces, active since 2022, with waste handed over to environmental operator companies, allows for a high degree of control and measurement of all types of waste (European LoW code) produced by the main company o ces. The total waste generated in 2021 was 199.60 tons. The di erence observable in the quantity of waste produced in 2021 and 2022 is linked to the Work-related injuries Reporting and data absence, in the second year in question, of logistics transformation events (e.g., divestiture of entire Data Center areas, closures or transfers of large from January 1 to December 31 Unit of measurement 2022 o ces, etc.). The scope to which the 2022 data refer is equivalent only to the Group companies that manage an o ce lease agreement. In particular, the following were taken into consideration: via Strada 2, Assago (EII); via Marconi 10, Bologna (EII); via Flero 36, Brescia (EII); Viale della regione ITALY* Siciliana 7275, Palermo (EII and Engineering D.Hub); viale Carlo Viola 76, Vicenza (Engineering D.Hub); Via Torre degli Agli 48, Florence (EII); Via Hours worked n. 16,773,041.73 Roma 4/D, Villorba – Treviso (EII), Via Ugo Bassi 2, Milan (EII); Via Emanuele Gianturco 15, Naples (EII); Corso Stati Uniti 23/C, Padua (EII); Piazzale dell’Agricoltura 24, Rome (EII); Corso Mortara 22 (Turin); Via Terragneta 90, Torre Annunziata – Naples (EII); Via Dino Col 4, Genoa (Municipia). Total number of recordable work-related injuries (including fatalities) n. 3 Total number of high-consequence work-related injuries n. 0 of which number of fatalities n. 0 OFFICE ENERGY CONSUMPTION* GRI 302 1 Rate of recordable work-related injuries*** 0.18 Rate of high-consequence work-related injuries*** 0 Rate of fatalities 0 2022 2021 2020 * The reference scope for the year 2022 includes the following entities: Engineering Ingegneria Informatica; Engineering DHUB; Municipia; WebResults; Electricity consumption (kWh) 5,561,471 5,380,134 6,326,482 Nexen; Engineering Sardegna; Digitelematica; Livebox. The majority of injuries (14/17) took place while commuting on the road, in vehicles or on motorcycles (transport not managed by the organization), so they are not reported as injuries on the basis of the requirements of the GRI standard. Electricity consumption (GJ) 20,021 19,368 22,775 Furthermore, in the course of 2020 there were 34 injuries recorded, of which 21 while commuting. In the course of 2021, there were 41 injuries recorded, of which 11 while commuting. For the 2020 and 2021 two-year period, it was not possible to verify the injury rate due to the unavailability of * the data. The electricity consumption figure considers the consumption of the following Group companies: EII, Municipia, Cybertech, Livebox, Nexen, D.HUB, Webresults and C-Consulting. ** Injuries from COVID-19 are not included in injury statistics. Furthermore, until August 31, 2022, 100% telecommuting was favored due to the COVID-19 pandemic. Starting from September 2022, the presence of workers at the o ces can be estimated at roughly 2 days per week. The negative trend in DATA CENTER ELECTRICITY CONSUMPTION the number of commuting injuries recorded resulted from increased commuting for the year 2022 compared to 2021. *** GRI 302 1 The rate of recordable work-related injuries is equal to the ratio between the total number of work-related injuries and the total hours worked in the same period, multiplied by 1,000,000. The rate of high-consequence work-related injuries (excluding fatalities) is equal to the ratio between the total number of high-consequence work-related injuries (excluding fatalities) and the total hours worked in the same period, multiplied by 1,000,000. 2022 2021 2020 Electricity consumption (kWh) 13,260,536 15,820,772 18,439,546 Electricity consumption (GJ) 47,738 56,955 66,382 104 Engineering © Engineering © 105
 2022 | ESG Report Page 103 Page 105