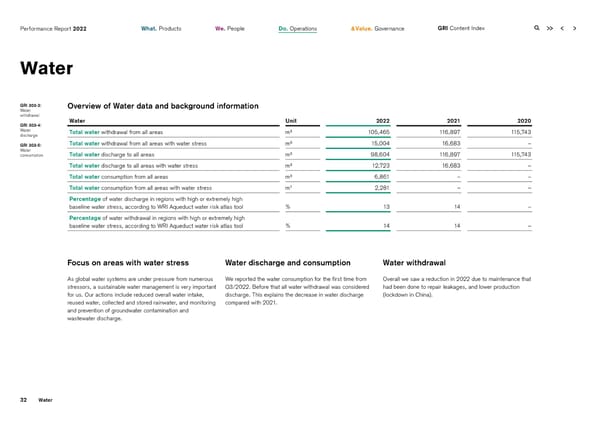
Performance Report 2022 What. Products We. People Do. Operations & Value. Governance GRI Content Index Water GRI 303-3: Overview of Water data and background information Water withdrawal Water Unit 2022 2021 2020 GRI 303-4: Water Total water withdrawal from all areas m³ 105,465 116,897 115,743 discharge GRI 303-5: Total water withdrawal from all areas with water stress m³ 15,004 16,683 – Water Total water discharge to all areas m³ 98,604 116,897 115,743 consumption Total water discharge to all areas with water stress m³ 12,723 16,683 – Total water consumption from all areas m³ 6,861 – – Total water consumption from all areas with water stress m3 2,281 – – Percentage of water discharge in regions with high or extremely high baseline water stress, according to WRI Aqueduct water risk atlas tool % 13 14 – Percentage of water withdrawal in regions with high or extremely high baseline water stress, according to WRI Aqueduct water risk atlas tool % 14 14 – Focus on areas with water stress Water discharge and consumption Water withdrawal As global water systems are under pressure from numerous We reported the water consumption for the first time from Overall we saw a reduction in 2022 due to maintenance that stressors, a sustainable water management is very important Q3/2022. Before that all water withdrawal was considered had been done to repair leakages, and lower production for us. Our actions include reduced overall water intake, discharge. This explains the decrease in water discharge (lockdown in China). reused water, collected and stored rainwater, and monitoring compared with 2021. and prevention of groundwater contamination and wastewater discharge. 32 Water
 2022 | ESG Report Page 31 Page 33