
2022 | ESG Report
Performance Report and GRI Content Index
Performance Report and GRI Content Index 2022
Performance Report 2022 What. Products We. People Do. Operations & Value. Governance GRI Content Index About Beckers About Beckers What. We. Do. & Value. 2 About Beckers Optimized for display with Adobe Acrobat
Performance Report 2022 What. Products We. People Do. Operations & Value. Governance GRI Content Index CEO Editorial Multidimensional positive impact scope and scale of our innovation, we are building a new Sustainable Innovation Centre in the UK to help unlock 2022 was an important year for our sustainability work. the potential of more sustainable coil coating technologies. We have been taking big steps and made progress towards Innovation and new solutions in sustainability are key our 2030 Sustainability Goals thanks to the passion of the for Beckers to lead the transformation in coil coatings. We GRI 2 – 22 Dear Stakeholders Beckers people. This sustainability report is a testament continuously challenge ourselves to rethink what we do, to that and includes a lot of significant concrete actions, not just when it comes to R&D and our formulations, but which are articulated around our three pillars: people, in how we work with suppliers, how we design our own While 2022 was definitely a challenging products and operations with impact. processes and how we can optimize our customers’ year, at Beckers we look forward with processes. I am incredibly grateful for our employees and confidence that is based on the passion of We brought the world’s first ultraviolet and electron-beam partners who are with us on this journey! our people, our strong business strategy paint to the market, reduced our energy use by 12 percent and value-adding products combined with and reached our 2030 Goal of 70 percent renewable electricity. Our Beckers Sustainability Index, a transparent Value creation through sustainable actions our commitment to sustainable innovation. product classification tool that maps and measures full systems’ sustainability, has been assessed and its In 2023 we started to evaluate Beckers’ performance The Russian war against Ukraine and the ongoing functionality confirmed by an independent auditor. It with a new value creation model which has been developed COVID-19 pandemic impacted companies, the economy, classifies the sustainable impact of coating systems along by Lindéngruppen, our parent company. We will include and society in an already challenging macro environment both material and functional dimensions and shows us how economic, environmental and social considerations together in 2022. Our business, like others, was affected severely sustainable a certain product is. We continued our efforts in our value creation and measure our performance with it. by raw material shortages, price volatility, disrupted supply for diversity, equity and inclusion and pushed for that By doing this, we promote accountability and transparency chains, and record high energy prices. The rapid rise and through our allyship initiative, our care for safety and our in what we do on sustainability, and we send a strong further risk of inflation exacerbated the uncertainty of mental health programs. These are only a few of the message to our employees and customers: Beckers wants increasing costs. All of this affected our results, but we numerous examples of Beckers’ commitment to set an to make coatings a force for good at every touchpoint! found answers, weathered these challenges and continue example! our path to becoming a sustainable business. We have high expectations for our core strategic segment coil coatings. We believe that coil coatings offer plenty of “Sustainability is our business. We believe headroom for growth, and this is where we want to build in creating a positive impact through market leadership with innovation and new solutions intentional actions and have thus redefined in sustainability. In our industrial coatings segment we will the meaning of value creation, focusing focus specifically on the strategic development of the on generating profits via a positive impact Christophe Sabas agricultural, construction and earth-moving equipment CEO business. on the environment and society.” Berlin, Germany, May 2023 We continue to contribute to decarbonization by transforming our product portfolio, and collaborate with our customers and suppliers to drive our products, people and processes for positive change. To accelerate the 3 CEO Editorial
Performance Report 2022 What. Products We. People Do. Operations & Value. Governance GRI Content Index Content Content 03 CEO Editorial What. Products Do. Operations & Value. Governance 05 About Beckers Group 09 Materials 21 Energy 34 Anti-Corruption 06 O ur 2030 Sustainability Goals 23 Carbon Emissions 35 Anti-Competitive Behavior 26 Carbon Emissions details 37 Supplier due diligence We. People 28 Air pollution 29 Waste 11 Employees 32 Water GRI Content Index 2022 14 Diversity 39 GRI Content Index 2022 16 Anti-Discrimination 17 Health & Safety 48 Contact 19 Community 04 Content
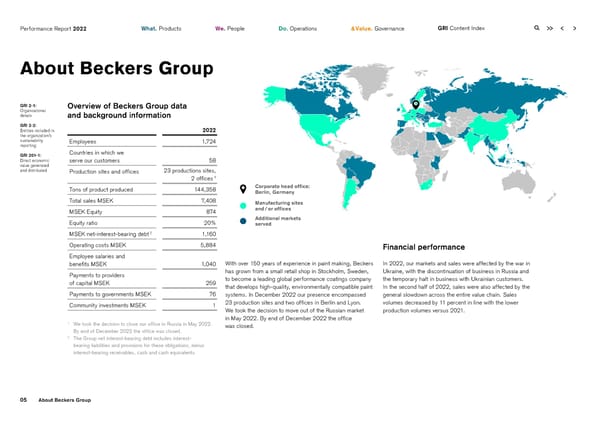
Performance Report 2022 What. Products We. People Do. Operations & Value. Governance GRI Content Index About Beckers Group GRI 2-1: Overview of Beckers Group data Organizational details and background information GRI 2-2: Entities included in 2022 the organization’s sustainability Employees 1,724 reporting GRI 201-1: Countries in which we Direct economic serve our customers 58 value generated and distributed Production sites and offices 23 productions sites, 1 2 offices Tons of product produced 144,358 Corporate head office: Berlin, Germany Total sales MSEK 7,408 Manufacturing sites MSEK Equity 874 and / or offices Equity ratio 20% Additional markets served 2 MSEK net-interest-bearing debt 1,160 Operating costs MSEK 5,884 Financial performance Employee salaries and benefits MSEK 1,040 With over 150 years of experience in paint making, Beckers In 2022, our markets and sales were affected by the war in Payments to providers has grown from a small retail shop in Stockholm, Sweden, Ukraine, with the discontinuation of business in Russia and of capital MSEK 259 to become a leading global performance coatings company the temporary halt in business with Ukrainian customers. that develops high-quality, environmentally compatible paint In the second half of 2022, sales were also affected by the Payments to governments MSEK 76 systems. In December 2022 our presence encompassed general slowdown across the entire value chain. Sales Community investments MSEK 1 23 production sites and two offices in Berlin and Lyon. volumes decreased by 11 percent in line with the lower We took the decision to move out of the Russian market production volumes versus 2021. in May 2022. By end of December 2022 the office 1 We took the decision to close our office in Russia in May 2022. was closed. By end of December 2022 the office was closed. 2 The Group net interest-bearing debt includes interest- bearing liabilities and provisions for these obligations, minus interest-bearing receivables, cash and cash equivalents. 05 About Beckers Group
Performance Report 2022 What. Products We. People Do. Operations & Value. Governance GRI Content Index Our 2030 Sustainability Goals GRI 3-3: Progress towards target Management of 1 material topics Stream Material topics Our 2030 Goals Unit Base year 2021 2022 (base year to 2030) What. Sustainable product Net sustainable sales >50% of revenue Products portfolio from BSI Achiever class % 34 – 34 Baseline set in 2022 Zero products from BSI Concern class % 7 – 7 Baseline set in 2022 Breakthrough Net-sustainable innovation: 100% of all innovation new products from BSI Achiever class % – – – Baseline to be set We. Diverse, motivated Female employees >31% % 26 26 26 0% People and empowered Female executives >40% % 19 21 26 34% employees Female new hires >40% % 37 32 36 0% Employee engagement survey indexes 2 in line with top performing companies – – – – 49% Safety and well-being Zero accidents No. 7 17 15 0% Social engagement Total number of children and youth impacted positively – – – – Goal to be set Do. Climate action >55% CO2e reduction (absolute) 3 Operations of scope 1 & 2 % 0 33 42 78% >50% CO2e reduction (intensity) 3 4 from third-party logistics % 0 18 +5 0% Resource efficiency Renewable energy use >70% % 36 44 56 58% Zero landfill waste ton 301 185 73 76% Waste efficiency
Performance Report 2022 What. Products We. People Do. Operations & Value. Governance GRI Content Index Our 2030 Sustainability Goals GRI 3-3: Progress towards target Management of 1 material topics Stream Material topics Our 2030 Goals Unit Base year 2021 2022 (base year to 2030) Do. Resource efficiency Incinerated waste reduction (absolute, tons) Operations 70% without heat recovery % 0 34 46 65% 2 2 15% with heat recovery % 0 +17 +6 0% Energy efficiency 85% raw material suppliers EcoVadis assessed and approved % 75 78 81 56% 100% of high-risk suppliers audited % 0 0 0 0% 1 The base year for all 2030 Goals indicators is 2020. Exceptions are marked. 2 This indicator increased. 07 Our 2030 Sustainability Goals
Performance Report 2022 What. Products We. People Do. Operations & Value. Governance GRI Content Index People 09 Materials What. Products What. Products 08
Performance Report 2022 What. Products We. People Do. Operations & Value. Governance GRI Content Index Materials GRI 301-1: Overview of Materials data and background information Materials used by weight or volume Materials Unit 2022 2021 2020 GRI 301-2: 1 Recycled input Total weight of production and packaging materials tons 140,016 164,650 141,625 materials used Of which non-renewable materials used tons 139,223 163,623 140,612 Of which renewable materials used tons 793 1,027 1,106 Recycled input materials used to manufacture the organization’s primary products and services % 0 0 – 1 This figure is based on the purchased volume of raw materials and does not include packaging materials. Improving the sustainability Basing our assessments on the BSI, we promote the use of Reused and recycled packaging material of our raw materials renewable raw materials, avoid using any minerals that are scarce or endangered, and sell coatings that provide proven Although we exclude recycled packing material from the Regarding our raw materials, we are working with key functional sustainability benefits for customers and society calculation for the GRI 301-2 indicator, we have numerous partners upstream to build strong and effective collaboration. while in service. We are looking at using bio-sourced raw initiatives in this regard such as the reuse of steel drums or Following our net-sustainable R&D strategy, our upstream materials and recycled plastic content in Beckers’ product plastic IBCs so they can be filled again and again. collaboration focuses on getting access to more sustainable formulations. The BSI provides a data-driven, objective raw materials. To achieve this, we use the Beckers means to measure and track the development of our Sustainability Index (BSI) – our tool that describes our sustainable product portfolio. products’ sustainability from two complimentary dimensions, Material Sustainability and Functional Sustainability. These reflect our view that coatings’ sustainability is always a combination of both the sustainable nature of the materials and processes we use to make our coatings and how our coatings are then used to add sustainable value to the article that is being coated. 09 Materials
Performance Report 2022 What. Products We. People Do. Operations & Value. Governance GRI Content Index People 11 Employees 14 Diversity 16 Anti-Discrimination 17 Health & Safety 19 Community We. People We. People 10
Performance Report 2022 What. Products We. People Do. Operations & Value. Governance GRI Content Index Employees GRI 2-7: Overview of Employee data and background information Employees GRI 401-1: Northern Southern New employee Total Asia & Middle East Europe & Americas Europe & Africa hires and employee 1 2 turnover Employee data 2022 2021 2020 2022 2021 2022 2021 2022 2021 Total Employees Total 1,724 1,775 1,741 523 568 642 662 559 545 Female 440 456 446 119 128 179 187 142 141 Male 1,284 1,319 1,295 404 440 463 475 417 404 Permanent Employees Total 1,586 1,596 1,566 428 434 613 626 545 536 Female 389 399 398 85 – 168 – 136 – Male 1,197 1,197 1,168 343 – 445 – 409 – Temporary Employees Total 138 179 175 95 134 29 36 14 9 Female 51 57 48 34 – 11 – 6 – Male 87 122 127 61 – 18 – 8 – Full-time Employees Total 1,686 1,735 1,693 522 567 625 645 539 523 Female 407 424 413 118 – 166 – 123 – Male 1,279 1,311 1,280 404 – 459 – 416 – Part-time Employees Total 38 40 48 1 1 17 17 20 22 Female 33 32 33 1 – 13 – 19 – Male 5 8 15 – – 4 – 1 – New Employees Total 196 216 133 67 75 82 98 47 43 Female 70 69 53 25 – 31 – 14 – Male 126 147 80 42 – 51 – 33 – 50 years 20 28 7 1 – 18 – 1 – 1 We use an in-house HR information system. This is maintained and updated by our HR representatives at each site. There are no exclusions. 2 We are not disclosing regional data for 2020 because the regions were reconfigured during that year. 11 Employees
Performance Report 2022 What. Products We. People Do. Operations & Value. Governance GRI Content Index Employees GRI 2-7: Northern Southern Employees Total Asia & Middle East Europe & Americas Europe & Africa GRI 405-2: 1 2 ratio of basic Employee data 2022 2021 2020 2022 2021 2022 2021 2022 2021 salary and remuneration Number of employee Total of women to turnover 262 176 134 126 64 101 80 35 32 men Ratio of the basic salary GRI 2-30: Collective and benefits between women bargaining agreements and men Total 0.97 1.01 – – – – – – – Employees covered by collective bargaining 3 agreements Total 1,022 1,029 920 – – – – – – 1 We use an in-house HR information system. This is maintained and updated by our HR representatives at each site. There are no exclusions. 2 We are not disclosing regional data for 2020 because the regions were reconfigured during that year. 3 We operate in some countries where the right to exercise freedom of association and collective bargaining may be at risk. We ensure that systems are in place for employee involvement and engagement in line with company values and our Code of Conduct. Decreased headcount Vietnam. This also affected the number of female employees. Regarding the demographic, it was the 30-50 The overall headcount for the Group decreased in 2022 year age group that decreased most. mainly due to reorganizations in Sweden, China and Germany. However, we we had increased headcounts in For our Management Approach concerning People headcounts in Turkey, the the US, UK, UAE, Turkey and with Impact, please click here. 12 Employees
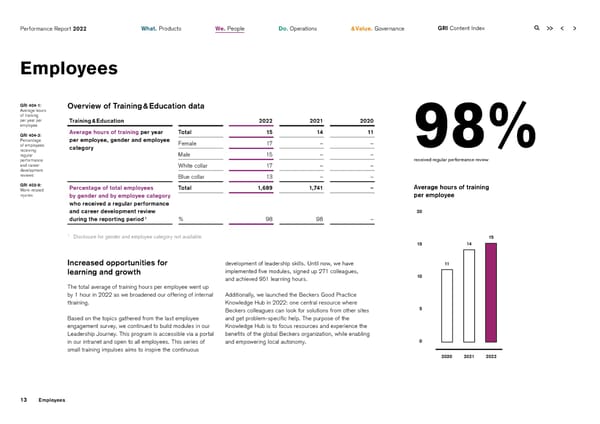
Performance Report 2022 What. Products We. People Do. Operations & Value. Governance GRI Content Index Employees GRI 404-1: Overview of Training & Education data Average hours of training per year per Training & Education 2022 2021 2020 employee GRI 404-3: Average hours of training per year Total 15 14 11 Percentage per employee, gender and employee Female 17 – – of employees category 98% receiving Male 15 – – regular performance received regular performance review and career White collar 17 – – development reviews Blue collar 13 – – GRI 403-9: Percentage of total employees Total 1,689 1,741 – Average hours of training Work-related injuries by gender and by employee category per employee who received a regular performance and career development review 20 1 during the reporting period % 98 98 – 1 Disclosure for gender and employee category not available. 15 15 14 Increased opportunities for development of leadership skills. Until now, we have 11 learning and growth implemented five modules, signed up 271 colleagues, and achieved 951 learning hours. 10 The total average of training hours per employee went up by 1 hour in 2022 as we broadened our offering of internal Additionally, we launched the Beckers Good Practice ttraining. Knowledge Hub in 2022: one central resource where Beckers colleagues can look for solutions from other sites 5 Based on the topics gathered from the last employee and get problem-specific help. The purpose of the engagement survey, we continued to build modules in our Knowledge Hub is to focus resources and experience the Leadership Journey. This program is accessible via a portal benefits of the global Beckers organization, while enabling in our intranet and open to all employees. This series of and empowering local autonomy. 0 small training impulses aims to inspire the continuous 2020 2021 2022 13 Employees
Performance Report 2022 What. Products We. People Do. Operations & Value. Governance GRI Content Index Diversity GRI 405-1: Overview of Diversity data and background information Diversity of governance bodies and 2022 2021 2020 employees GRI 2-9: Diversity Headcount % Headcount % Headcount % Governance Board of Directors Female 4 57 4 50 4 44 structure and composition Male 3 43 4 50 5 56 Total 7 – 8 – 9 – Executive Committee Female 2 25 1 14 1 17 Male 6 75 6 86 5 83 Total 8 – 7 – 6 – Management Positions (Tier 0-2) Female 16 26 10 21 7 19 Male 45 74 38 79 30 81 Total 61 – 48 – 37 – Employees Female 440 26 456 26 446 26 Male 1,284 74 1,319 74 1,295 74 50 499 – 500 – 469 – Total 1,724 – 1,775 – 1,741 – 14 Diversity
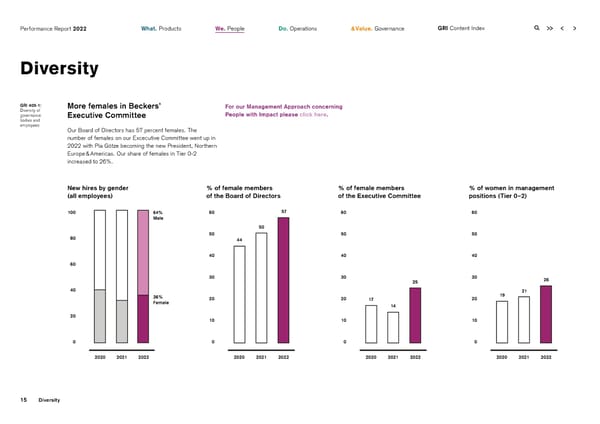
Performance Report 2022 What. Products We. People Do. Operations & Value. Governance GRI Content Index Diversity GRI 405-1: More females in Beckers’ For our Management Approach concerning Diversity of People with Impact please click here. governance Executive Committee bodies and employees Our Board of Directors has 57 percent females. The number of females on our Excecutive Committee went up in 2022 with Pia Götze becoming the new President, Northern Europe & Americas. Our share of females in Tier 0-2 increased to 26%. New hires by gender % of female members % of female members % of women in management (all employees) of the Board of Directors of the Executive Committee positions (Tier 0–2) 100 64% 60 57 60 60 Male 50 50 50 50 80 44 40 40 40 60 30 30 30 26 25 40 21 36% 20 20 20 19 Female 17 14 20 10 10 10 0 0 0 0 2020 2021 2022 2020 2021 2022 2020 2021 2022 2020 2021 2022 15 Diversity
Performance Report 2022 What. Products We. People Do. Operations & Value. Governance GRI Content Index Anti-Discrimination GRI 406-1: Overview of Anti-Discrimination data and background information Incidents of discrimination and corrective Anti-Discrimination 2022 2021 2020 actions taken Total number of incidents of discrimination during the reporting period 1 3 1 Incident reviewed by the organization 1 3 1 Remediation plans being implemented 1 3 1 Remediation plans that have been implemented, with results reviewed 1 through routine internal management review processes 2 2 1 Incident no longer subject to action 2 2 1 1 At the end of the reporting phase, one case was still subject to remedial action plans being implemented in 2021. Strong governance Our Anti-discrimination and -harassment policy is valid for the whole organization. Complaints are registered through At Beckers, we value every employee equally and actively our grievance system or other programs. The incident promote an increasingly inclusive work environment with mentioned in 2022 was reported directly to the CHRO. The zero discrimination, equal opportunities and inclusion. We case has been handled according to our procedure and is are aware of the possible risks of workplace discrimination no longer subject to action. and accompanying challenges, and face these strongly. Accordingly, we condemn all forms of discrimination. For our Management Approach concerning Governance, please click here. 16 Anti-Discrimination
Performance Report 2022 What. Products We. People Do. Operations & Value. Governance GRI Content Index Health & Safety GRI 403-8 Overview of Health & Safety data and background information Workers covered by an occupational 2022 2021 2020 health and safety Health & Safety No. Rate or % No. Rate or % No. Rate or % management system The number and percentage of all employees and GRI 403-9: workers who are not employees but whose work and/or Work-related workplace is controlled by the organization, covered by injuries 1 1 1 GRI 403-10: a health and safety management system 1,724 100% 1,775 100% 1,741 100% Work-related All employees who are covered by such a system ill health that has been audited or certified by an external party 865 50% 835 47 827 48 Number and rate of fatalities as a result of work-related injury 0 0 0 0 – – Number and rate of high-consequence work-related injuries (excluding fatalities) 0 0 0 0 – – Number and rate of total recordable 2 work-related injuries (TRI) 15 4.6 17 5.3 7 2.2 3 Number and rate of lost time injuries (LTI) 6 1.9 10 3.1 4 1.3 Total number of hours worked 3,240,388 – 3,178,173 – 3,147,627 – Number of fatalities as a result of work-related ill health 0 0 0 0 – – 4 Number of recordable work-related ill health 0 0 0 0 – – 1 This number only includes our own employees and not contract workers. 2 Total Recordable Injuries (TRI) and TRI frequency per million hours worked. 3 Lost Time Injury (LTI) and LTI frequency per million hours worked. 4 There are no cases of ill health that we are aware of. 17 Health & Safety
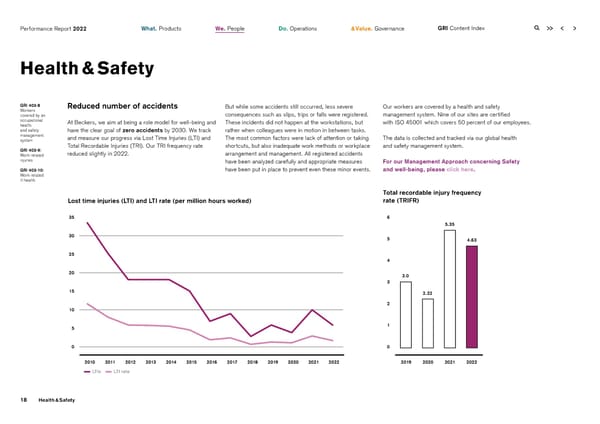
Performance Report 2022 What. Products We. People Do. Operations & Value. Governance GRI Content Index Health & Safety GRI 403-8 Reduced number of accidents But while some accidents still occurred, less severe Our workers are covered by a health and safety Workers consequences such as slips, trips or falls were registered. management system. Nine of our sites are certified covered by an occupational At Beckers, we aim at being a role model for well-being and These incidents did not happen at the workstations, but with ISO 45001 which covers 50 percent of our employees. health and safety have the clear goal of zero accidents by 2030. We track rather when colleagues were in motion in between tasks. management and measure our progress via Lost Time Injuries (LTI) and The most common factors were lack of attention or taking The data is collected and tracked via our global health system Total Recordable Injuries (TRI). Our TRI frequency rate shortcuts, but also inadequate work methods or workplace and safety management system. GRI 403-9: reduced slightly in 2022. arrangement and management. All registered accidents Work-related injuries have been analyzed carefully and appropriate measures For our Management Approach concerning Safety GRI 403-10: have been put in place to prevent even these minor events. and well-being, please click here. Work-related ill health Total recordable injury frequency Lost time injuries (LTI) and LTI rate (per million hours worked) rate (TRIFR) 35 6 35 5.35 30 5 28 4.63 25 21 4 20 3.0 3 15 2.22 14 2 10 7 1 5 0 0 0 2010 2011 2012 2013 2014 2015 2016 2017 2018 2019 2020 2021 2022 2019 2020 2021 2022 LTIs LTI rate 18 Health & Safety
Performance Report 2022 What. Products We. People Do. Operations & Value. Governance GRI Content Index Community Own Overview of Community data and background information disclosure Local Communities Community Unit 2022 2021 2020 Percentage of countries with operations where Beckers’ employees support local social initiatives % 76 77 50 Total hours spent on external commitments and community work hours 1,220 170 – Community investments SEK 1,223,179 694,271 – Doubled investments into community We committed ourselves to one global Common Cause to drive our community engagement: Children and youth. We started the monthly reporting of hours spent on They are the focus of our activities and therefore the community engagement in Q1 2022. In 2021, reporting investments were mainly focused on this target group. was still on a voluntary basis which explains part of the difference. We almost doubled our community investments in 2022, which included voluntary donations and contributions to organizations within our communities and beyond. 19 Community
Performance Report 2022 What. Products We. People Do. Operations & Value. Governance GRI Content Index Do. Operations 21 Energy 23 Carbon Emissions 26 Carbon Emissions details 28 Air pollution 29 Waste 32 Water Do. Operations 20 Do. Operations
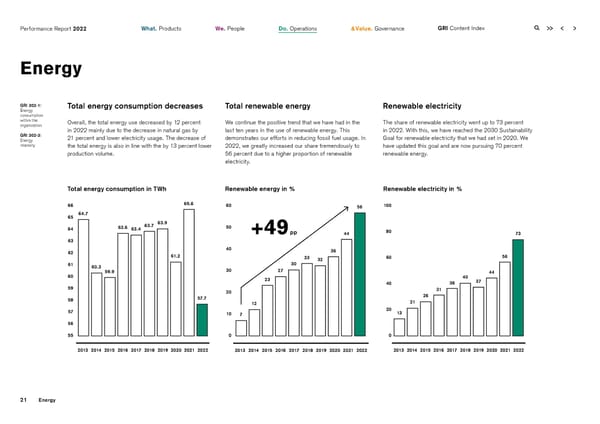
Performance Report 2022 What. Products We. People Do. Operations & Value. Governance GRI Content Index Energy GRI 302-1: Total energy consumption decreases Total renewable energy Renewable electricity Energy consumption within the Overall, the total energy use decreased by 12 percent We continue the positive trend that we have had in the The share of renewable electricity went up to 73 percent organization in 2022 mainly due to the decrease in natural gas by last ten years in the use of renewable energy. This in 2022. With this, we have reached the 2030 Sustainability GRI 302-3: 21 percent and lower electricity usage. The decrease of demonstrates our efforts in reducing fossil fuel usage. In Goal for renewable electricity that we had set in 2020. We Energy intensity the total energy is also in line with the by 13 percent lower 2022, we greatly increased our share tremendously to have updated this goal and are now pursuing 70 percent production volume. 56 percent due to a higher proportion of renewable renewable energy. electricity. Total energy consumption in TWh Renewable energy in % Renewable electricity in % 66 65.6 60 56 100 65 64.7 63.7 63.9 64 63.6 63.4 50 +49 pp 44 80 73 63 62 40 36 61.2 33 32 60 56 61 60.3 30 59.9 30 27 44 60 23 40 40 36 37 59 20 31 57.7 26 58 12 21 57 20 13 10 7 56 55 0 0 2013 2014 2015 2016 2017 2018 2019 2020 2021 2022 2013 2014 2015 2016 2017 2018 2019 2020 2021 2022 2013 2014 2015 2016 2017 2018 2019 2020 2021 2022 21 Energy
Performance Report 2022 What. Products We. People Do. Operations & Value. Governance GRI Content Index Energy GRI 302-1: Overview of Energy data and background information Total fuel consumption Energy consumption within the Energy Unit 2022 2021 2020 We significantly reduced the use of natural gas in 2022, organization Total fuel consumption MWh mainly due to decreasing the use of heating systems at GRI 302-3: European sites, and replacing gas heating with energy Energy from non-renewable sources 15,761 19,892 17,867 intensity recovery pump systems at our biggest site in Montbrison, Total fuel consumption MWh France. Furthermore diesel consumption also fell due to from renewable sources 0 13 0 the use of alternatives such as replacing diesel with Total consumption electrical equipment. electricity MWh 35,287 38,232 36,407 renewable electrictiy % 73 56 44 heating MWh 6,602 7,425 6,883 Energy intensity ratio cooling MWh 0 0 0 We have not managed to improve our energy intensity steam MWh 0 0 0 ratio. The energy used to produce a ton of product has Total sold stayed roughly the same since 2015. electricity MWh 126 15 19 Energy intensity, MWh/ton product heating MWh 0 0 0 0.5 cooling MWh 0 0 0 0.5 steam MWh 0 0 0 Total energy consumption¹ MWh 57,650 65,562 61,157 0.4 Total renewable energy % 56 44 36 0.4 Energy intensity ratio² MWh/ton product 0.40 0.40 0.39 0.3 0.3 ¹ Energy consumption is documented and follows our internal reporting system. We use conversion factors from SEAI (Sustainable Energy Authority of Ireland) with local Standard Operating Procedures to ensure data consistency. 2013 2014 2015 2016 2017 2018 2019 2020 2021 2022 ² The organization-specific nominator for the energy intensity ratio is the tons of volume produced on-site. The ratio uses energy consumption within the organization only. All types of energy are included, and also renewable energy generated on-site. 22 Energy
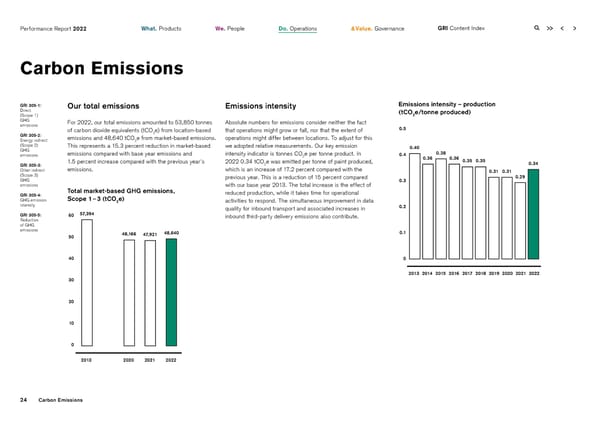
Performance Report 2022 What. Products We. People Do. Operations & Value. Governance GRI Content Index Carbon Emissions GRI 305-1: Overview of Emissions data & methodology Direct (Scope 1) GHG 1 4 Emissions Unit 2022 2021 2020 2013 emissions GRI 305-2: Total market-based GHG emissions² tons CO2e 48,640 47,921 48,166 57,394 Energy indirect Direct (Scope 1) GHG emissions tons CO e (Scope 2) 2 GHG Gross direct emissions tons CO e 8,147 9,546 9,860 12,763 emissions 2 GRI 305-3: Biogenic emissions tons CO2e 0 0.23 0 – Other indirect (Scope 3) Energy indirect (Scope 2) GHG emissions tons CO e GHG 2 emissions Gross location-based indirect emissions tons CO e 11,740 13,652 13,516 2 GRI 305-4: Gross market-based indirect emissions tons CO e 7,648 8,918 11,516 14,804 GHG emission 2 intensity Other indirect (Scope 3) GHG emissions tons CO2e GRI 305-5: Reduction Gross other indirect emissions tons CO e 32,845 29,457 26,790 29,827 of GHG 2 emissions 3 GHG emission intensity GHG emissions intensity ratio COe per ton product 0.34 0.29 0.31 0.40 2 GHG emissions reduced as a direct result of reduction initiatives tons CO2e 920 2,911 – – ¹ We calculate greenhouse gas emissions from all operations as well as from certain parts of scope 3. We use the calculation tool Our Impacts. The calculations follow the GHG Protocol and are performed by experts. We started the EKPI reporting in 2011. From 2013 on, the data accuracy and analysis capabilities matched our global standard. All processes were in place, boundary conditions were set and all Methodology entities included. The overall boundaries for our assessment are those displayed on page 27. According to our Recalculation Policy, there is no need to recalculate the base year, since the changes to the emission factors in 2022 do not significantly impact the results. The In order to collect relevant and correct activity data for emission factors are included in the tool Our Impacts and are updated and revised regularly. For GWP, IPCC 2007 values are used. the carbon emission assessment, Beckers assigns a ² The market-based method takes into account whether Beckers’ sites purchase renewable electricity and use specific emission factors for climate reporter at all its sites and offices around the world. the contractual instruments. For sites that do not make an active choice, a residual-mix factor is applied instead, where such residual factors This network of climate reporters collects and documents are available. Gases included: CO2, CH4, NO2, HFCs, NF3, SF6 and PFCs (when applicable). Consolidation approach: Operational control. 3 Organization-specific denominator: Volume produced. Types of GHG emissions included (Sc1, Sc2, Sc3). Gases included: CO , CH , relevant parameters into our web-based tool. This data is 2 4 consolidated to form the global climate footprint of the NO2, HFCs, NF3, SF6 and PFCs (when applicable). Absolute numbers for emissions neither consider the fact that operations might grow or fall, nor that the extent of operations might differ between locations. In order to adjust for this, a relative measurement has company. been adopted. The emissions intensity has been measured using Key Performance Indicators (KPI). The KPIs for 2022 include: products (volume of product produced in metric tonnes). Beckers has been communicating carbon data since 2011, 4 Emissions in the base year. A new market-based/location-based scope 2 approach was introduced in 2015 by GHG Protocol. when we were measuring emissions from our 18 sites. In 2022, we had 25 locations (23 sites and 2 offices) to monitor. 23 Carbon Emissions
Performance Report 2022 What. Products We. People Do. Operations & Value. Governance GRI Content Index Carbon Emissions GRI 305-1: Our total emissions Emissions intensity Emissions intensity – production Direct (tCO e/tonne produced) (Scope 1) 2 GHG For 2022, our total emissions amounted to 53,850 tonnes Absolute numbers for emissions consider neither the fact emissions 0.5 of carbon dioxide equivalents (tCO2e) from location-based that operations might grow or fall, nor that the extent of GRI 305-2: emissions and 48,640 tCO e from market-based emissions. operations might differ between locations. To adjust for this Energy indirect 2 (Scope 2) This represents a 15.3 percent reduction in market-based we adopted relative measurements. Our key emission 0.40 GHG emissions compared with base year emissions and intensity indicator is tonnes CO e per tonne product. In 0.38 emissions 2 0.4 0.36 0.36 1.5 percent increase compared with the previous year’s 2022 0.34 tCO e was emitted per tonne of paint produced, 0.35 0.35 0.34 GRI 305-3: 2 Other indirect emissions. which is an increase of 17.2 percent compared with the 0.31 0.31 (Scope 3) previous year. This is a reduction of 15 percent compared 0.29 GHG 0.3 emissions with our base year 2013. The total increase is the effect of GRI 305-4: Total market-based GHG emissions, reduced production, while it takes time for operational GHG emission Scope 1 – 3 (tCO2e) activities to respond. The simultaneous improvement in data intensity quality for inbound transport and associated increases in 0.2 GRI 305-5: 60 57,394 inbound third-party delivery emissions also contribute. Reduction of GHG emissions 48,166 48,640 0.1 50 47,921 40 0 2013 2014 2015 2016 2017 2018 2019 2020 2021 2022 30 20 10 0 2013 2020 2021 2022 24 Carbon Emissions
Performance Report 2022 What. Products We. People Do. Operations & Value. Governance GRI Content Index Carbon Emissions GRI 305-1: Scope 1 + 2 reduction compared Scope 1 + 2 absolute reduction (in %) Increase in scope 3 emissions Direct compared with base year 2013 (Scope 1) with base year GHG For scope 3, we saw a rise mainly due to the increase in emissions 60 Beckers’ 2030 climate goal for our own operations is 55 inbound transport as we have taken the transport of goods GRI 305-2: 55 percent absolute reduction in scope 1 & 2 (base year or intermediates between our sites into account in 2022. Energy indirect (Scope 2) 2013), meaning a reduction from 27,567 tonnes CO e to Furthermore, a significant increase can also be seen in GHG 2 50 emissions 12,405 tonnes CO2e by 2030. The results for 2022 show business travel due to fewer COVID restrictions, however a 43 percent reduction in emissions in scopes 1 and 2 43 not at the same level as before the pandemic. For outbound GRI 305-3: combined, compared with the base year. The decrease in transport, the use of fuels other than diesel such as Other indirect 40 (Scope 3) scope 1 in 2022 stems mainly from the reduced usage of HVO and LNG, however brought some reduction on some GHG 33 emissions natural gas and the decrease in VOC. In scope 2, reduced of our sites. GRI 305-4: electricity usage as well as the installation and use of solar 30 GHG emission panels on our sites or the transition to renewable electricity intensity from the grid, impacted the result positively. 22 GRI 305-5: 20 Reduction 14 of GHG 12 emissions 11 10 8 8 9 0 2014 2015 2016 2017 2018 2019 2020 2021 2022 2030 Goal 25 Carbon Emissions
Performance Report 2022 What. Products We. People Do. Operations & Value. Governance GRI Content Index Carbon Emissions details GRI 305-1: Carbon emissions by activity Carbon emissions by activities¹ Direct (Scope 1) GHG We monitor and report our emissions in terms of activities. Inbound third-party deliveries 37.25% Waste 0.20% emissions (25% in 2021) (0.4% in 2021) These are business operations that we actively quantify GRI 305-2: to convert to tonnes of carbon dioxide equivalents using Energy indirect (Scope 2) globally accepted emission factors. Analyzing our emissions GHG in terms of activities has enabled us to develop a foundation emissions for climate goals and in 2020 we set targets for major Product transport – GRI 305-3: business operations. The major contributors to Beckers’ Production gases 8.89% owned & leased vehicles 0.26% Other indirect (10% in 2021) (0.3% in 2021) (Scope 3) emissions are premises (29 percent), inbound third-party GHG emissions deliveries (37 percent), and outbound third-party deliveries Outbound third-party deliveries 18.64% GRI 305-4: (18 percent). (26% in 2021) GHG emission Company-owned vehicles 1.44% intensity (2% in 2021) GRI 305-5: Reduction Comparison with base year of GHG emissions and previous results Premises 29.08% Business travel 4.21% (34% in 2021) (2% in 2021) Premises entails activities carried out on the site and mainly comprises various forms of energy consumption and water usage. The graph also depicts that over 80 percent of Beckers’ emissions are a result of activities in premises and third-party delivery logistics. Comparing with last year, the ¹ Data are calculated according to a market-based approach. material activities with significant changes in emissions are premises, business travel, inbound third-party deliveries, and outbound third-party deliveries. 26 Carbon Emissions details
Performance Report 2022 What. Products We. People Do. Operations & Value. Governance GRI Content Index Carbon Emissions details GRI 305-1: Historical emission details and 2022 percentage of total Direct (Scope 1) GHG Emissions (tCO e) 2022 (Market) 2021 (Market) Base year (2013) Percentage of total 2022 emissions 2 GRI 305-2: Premises 14,144 16,493 20,036 29.08% Energy indirect Outbound third-party deliveries 9,068 12,399 14,368 18.64% (Scope 2) GHG Inbound third-party deliveries 18,118 12,060 11,585 37.25% emissions GRI 305-3: Production gases 4,323 4,693 6,833 8.89% Other indirect (Scope 3) Business travel 2,047 1,031 2,737 4.21% GHG emissions Company-owned vehicles 701 892 1,382 1.44% GRI 305-4: Waste 95 178 432 0.20% GHG emission intensity Product transport – owned & leased vehicles 126 163 – 0.26% GRI 305-5: Reduction Paper 18 12 22 0.04% of GHG emissions Total 48,640 47,921 57,393 27 Carbon Emissions details
Performance Report 2022 What. Products We. People Do. Operations & Value. Governance GRI Content Index Air pollution GRI 305-7: Overview of Emissions data & methodology Nitrogen oxides (NOx), sulfur oxides Significant air emissions¹ Unit 2022 2021 2020 (SOx), and other NOx kg 38,619 44,934 – signi昀椀cant air emissions SOx kg 37,586 41,257 – Volatile organic compounds (VOC) kg 432,270 469,270 470,800 Particulate matter (PM10) kg 4,454 5,088 – Other standard categories of air emissions identified 2 in relevant regulations kg 11,085 14,778 – ¹ The source for the emission factors for air emissions is ecoinvent and the Swedish Environmental Protection Agency. We calculate air emissions from all operations and per relevant activity in Scope 1 and 2. The data is based on activity data from the climate reporting. For vehicles, PM emission factors are reported aggregated and are labeled PM (unspecified) in these calculations. 2 PM 2.5 28 Air pollution
Performance Report 2022 What. Products We. People Do. Operations & Value. Governance GRI Content Index Waste GRI 306-3: Overview of Waste data & methodology Waste generated Waste Unit 2022 2021 2020 GRI 306-4: Waste diverted Total weight of waste generated tons 7,482 8,375 8,114 from disposal GRI 306-5: Total weight of hazardous waste tons 5,527 6,358 5,870 Waste directed Total weight of non-hazardous waste tons 1,955 2,017 2,244 to disposal GRI 306-3 Waste intensity kg/ ton product 52 51 52 (2016): Signi昀椀cant Waste to landfill tons 73 185 301 spills Percentage waste to landfill of total waste % 1 2 4 Percentage waste recycled/reused of total waste % 55 54 54 Percentage hazardous waste of total waste % 74 76 72 Total weight of waste diverted from disposal tons 4,146 4,526 4,353 Total weight of hazardous waste diverted from disposal tons 2,620 3,070 2,616 Of which preparation for reuse tons 1,553 1,808 1,213 Of which recycling tons 1,067 1,262 1,404 Of which other recovery operations tons 0 0 0 Total weight of non-hazardous waste diverted from disposal tons 1,526 1,456 1,737 Of which preparation for reuse tons 608 555 896 Of which recycling tons 918 901 841 Of which other recovery operations tons 0 0 0 29 Waste
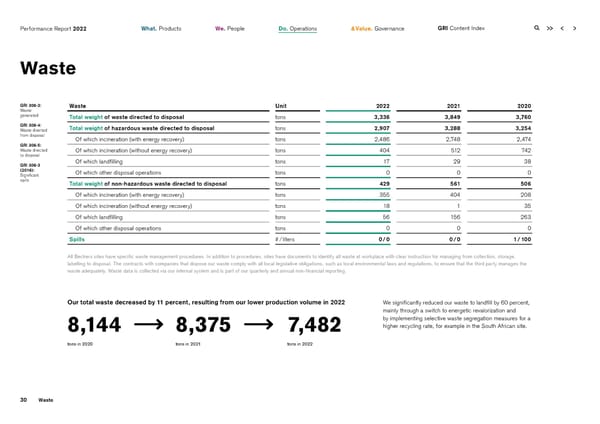
Performance Report 2022 What. Products We. People Do. Operations & Value. Governance GRI Content Index Waste GRI 306-3: Waste Unit 2022 2021 2020 Waste generated Total weight of waste directed to disposal tons 3,336 3,849 3,760 GRI 306-4: Total weight of hazardous waste directed to disposal tons 2,907 3,288 3,254 Waste diverted from disposal Of which incineration (with energy recovery) tons 2,486 2,748 2,474 GRI 306-5: Waste directed Of which incineration (without energy recovery) tons 404 512 742 to disposal GRI 306-3 Of which landfilling tons 17 29 38 (2016): Of which other disposal operations tons 0 0 0 Signi昀椀cant spills Total weight of non-hazardous waste directed to disposal tons 429 561 506 Of which incineration (with energy recovery) tons 355 404 208 Of which incineration (without energy recovery) tons 18 1 35 Of which landfilling tons 56 156 263 Of which other disposal operations tons 0 0 0 Spills # / liters 0 / 0 0 / 0 1 / 100 All Beckers sites have specific waste management procedures. In addition to procedures, sites have documents to identify all waste at workplace with clear instruction for managing from collection, storage, labelling to disposal. The contracts with companies that dispose our waste comply with all local legislative obligations, such as local environmental laws and regulations, to ensure that the third party manages the waste adequately. Waste data is collected via our internal system and is part of our quarterly and annual non-financial reporting. Our total waste decreased by 11 percent, resulting from our lower production volume in 2022 We significantly reduced our waste to landfill by 60 percent, mainly through a switch to energetic revalorization and by implementing selective waste segregation measures for a 8,144 8,375 7,482 higher recycling rate, for example in the South African site. tons in 2020 tons in 2021 tons in 2022 30 Waste
Performance Report 2022 What. Products We. People Do. Operations & Value. Governance GRI Content Index Waste GRI 306-3: Total weight of Waste in 2022 Landfill waste Waste generated Non-Hazardous Reused In 2022, we reduced our landfill waste by GRI 306-4: 1,955 tons 2,161 tons Waste diverted Domestic waste and certain industrial Materials used back into the from disposal waste that is not considered a risk to market without major remanufacturing GRI 306-5: human health and environment as per processes to alter it. Waste directed regulations in country of operation. to disposal 83.333333 29% 26% 60% Recycled compared with 2021 1,985 tons 66.666667 Used materials that are broken down to make raw materials for manufacturing new products. Waste intensity in kg/ton product 80 26% 80 50.000000 Hazardous Incinerated 70 5,527 tons 3,263 tons of which Waste from chemicals or contaminated 2,841 tons was with heat recovery Combustion of waste with the 60 by chemicals that have a risk to 60 human health or environment as per possibility to recover energy from regulations in country of operation. heat generated. 33.333333 50 40 74% 44% 40 16.666667 Landfilled 30 73 tons Disposal by dumping waste in 20 government-designated areas. 20 1% 10 0.000000 0 0 by type by disposal 2013 2014 2015 2016 2017 2018 2019 2020 2021 2022 method Total waste excluding reused waste Total waste including reused waste 31 Waste
Performance Report 2022 What. Products We. People Do. Operations & Value. Governance GRI Content Index Water GRI 303-3: Overview of Water data and background information Water withdrawal Water Unit 2022 2021 2020 GRI 303-4: Water Total water withdrawal from all areas m³ 105,465 116,897 115,743 discharge GRI 303-5: Total water withdrawal from all areas with water stress m³ 15,004 16,683 – Water Total water discharge to all areas m³ 98,604 116,897 115,743 consumption Total water discharge to all areas with water stress m³ 12,723 16,683 – Total water consumption from all areas m³ 6,861 – – Total water consumption from all areas with water stress m3 2,281 – – Percentage of water discharge in regions with high or extremely high baseline water stress, according to WRI Aqueduct water risk atlas tool % 13 14 – Percentage of water withdrawal in regions with high or extremely high baseline water stress, according to WRI Aqueduct water risk atlas tool % 14 14 – Focus on areas with water stress Water discharge and consumption Water withdrawal As global water systems are under pressure from numerous We reported the water consumption for the first time from Overall we saw a reduction in 2022 due to maintenance that stressors, a sustainable water management is very important Q3/2022. Before that all water withdrawal was considered had been done to repair leakages, and lower production for us. Our actions include reduced overall water intake, discharge. This explains the decrease in water discharge (lockdown in China). reused water, collected and stored rainwater, and monitoring compared with 2021. and prevention of groundwater contamination and wastewater discharge. 32 Water
Performance Report 2022 What. Products We. People Do. Operations & Value. Governance GRI Content Index 34 Anti-Corruption 35 Anti-Competitive Behavior & Value.37 Supplier due diligence Governance 3333 Water
Performance Report 2022 What. Products We. People Do. Operations & Value. Governance GRI Content Index Anti-Corruption GRI 205-1: Overview of Anti-Corruption data and background information Operations assessed for risks related 2022 2021 2020 to corruption GRI 205-2: Anti-Corruption No. % No. % No. % Communication Total number and percentage of operations assessed for risks related to corruption 23 100 23 100 – – and training about anti- Total number and percentage of governance body members that the organization’s corruption policies and anti-corruption policies and procedures have been communicated to, broken down by region 7 100 8 100 9 100 procedures GRI 205-3: Total number and percentage of governance body members that have received training Con昀椀rmed on anti-corruption, broken down by region 7 100 8 100 9 100 incidents of corruption and Total number and percentage of employees that have received training on anti-corruption, actions taken 1 broken down by employee category and region 636 37 632 36 377 22 Total number and nature of confirmed incidents of corruption 0 0 0 0 0 0 Total number of confirmed incidents in which employees were dismissed or disciplined for corruption 0 0 0 0 0 0 Total number of confirmed incidents when contracts with business partners were terminated or not renewed due to violations related to corruption 0 0 0 0 0 0 Public legal cases regarding corruption brought against the organization or its employees during the reporting period and the outcomes of such cases 0 0 0 0 0 0 Number of new cases reported through Whistleblowing channel 3 0 1 0 3 0 1 Breakdown by employee category and region not available No bribery and corruption With the introduction of our Anti-Corruption Due Diligence Procedure for Agents and Distributors in 2021, Beckers is At Beckers, we have zero tolerance for bribery and taking active steps against corruption. corruption. We have not had monitored any legal actions for corruption and bribery in 2022. All new cases reported through the whistleblowing channels were investigated and handled according to internal policy. 34 Anti-Corruption
Performance Report 2022 What. Products We. People Do. Operations & Value. Governance GRI Content Index Anti-Competitive Behavior GRI 206-1: Overview of Anti-Competitive data and background information Legal actions for anti- competitive Anti-Competitive Behavior No. 2022 2021 2020 behavior, anti-trust, Number of legal actions pending or completed during the reporting period and monopoly practices regarding anti-competitive behavior and violations of anti-trust and monopoly legislation in which the organization has been identified as a participant 0 0 0 0 Anti-Competitive Behavior As there were no legal actions regarding anti-competitive behavior in recent years, we have nothing to report on the outcomes. 35 Anti-Competitive Behavior
Performance Report 2022 What. Products We. People Do. Operations & Value. Governance GRI Content Index Supplier due diligence Own Overview of Supplier Due Diligence data disclosure: Raw materials evaluated Supplier Due Diligence Unit 2022 2021 2020 as per standardized Total number of direct material suppliers No. 842 897 866 CSR guidelines GRI 308-1: Total number of new suppliers No. 749 1,159 – New suppliers Number of direct material suppliers evaluated towards Code of Conduct No. 570 557 472 that were screened using environmental Number of new suppliers that were screened using environmental and social criteria No. 135 327 156 criteria GRI 308-2: Number of supplier audits carried out No. 0 0 0 Negative Percentage of direct material suppliers evaluated % 68 62 55 environmental impacts in the Percentage of new suppliers evaluated % 18 28 – supply chain and actions taken 1 Spending on local suppliers % 17 – – GRI 414-1: New suppliers 1 The percentage is of 70% direct spend of our total purchase. that were screened using social criteria GRI 414-2: Supplier screening Audits Spend on local suppliers Negative social impacts in the 98 percent of our direct spend on raw materials and We did not conduct in-house audits in 2022. Due to the Local suppliers are suppliers within a distance of 322 km supply chain and actions packaging is evaluated towards Code of Conduct. 135 new still ongoing pandemic, the audits scheduled for 2022 had of our Beckers sites. In 2022, 17 percent of our 70 percent taken active suppliers (direct and indirect spend) have been to be postponed. Audits could not be carried out virtually direct spend on raw materials and packaging went to local evaluated towards our Code of Conduct. We ask all our raw as they involve on-site visits to inspect a supplier’s suppliers. The KPI was tracked for the first time in 2022. material suppliers to conduct EcoVadis sustainability process controls, quality, sustainability, and continuous assessments. A supplier must score a minimum of 40 points improvement. 17 local suppliers in South Africa were in each of four segments to achieve Beckers’ approval. audited. However, as these were local audits with slightly 81 percent of our suppliers are approved by an EcoVadis different criteria, we do not count this for supplier audits. assessment. 36 Supplier due diligence
Performance Report 2022 What. Products We. People Do. Operations & Value. Governance GRI Content Index Supplier due diligence Own Approved suppliers by our Supplier Responsible Sourcing: Chain-Up! disclosure: third-party assessment, in % Raw materials evaluated as per Step 1: Sign and adhere to the Supplier standardized 100 action plan towards a reassessment. This process allows CSR guidelines Code of Conduct us to take our suppliers with us as we move our industry in GRI 308-1: 81 It is essential that we have an effective way of managing the the right direction. The procurement team monitors the raw New suppliers 78 suppliers that support us at different locations around the material spending with EcoVadis approved suppliers on a that were 80 75 screened using world. To do this, we have used a collaborative tool that global level, and check the suppliers’ EcoVadis scorecard environmental helps our sites manage the process locally and monitor the when they are newly introduced. criteria 83.333333 GRI 308-2: status of every single supplier since the introduction of our Negative 60 Supplier Code of Conduct in 2017. environmental Step 3: Conduct in-house audits impacts in the supply chain We conduct our own in-house audits on selected key and actions 40 Step 2: Conduct third-party assessments suppliers to verify their compliance with our Corporate taken 66.666667 GRI 414-1: We ask all our raw material suppliers to conduct EcoVadis Social Responsibility and quality expectations. Our New suppliers assessments. EcoVadis is a global provider of sustainability procurement team selects suppliers to audit based on a that were 20 ratings. Its ratings cover a broad range of non-financial risk assessment that includes factors such as geographic screened using social criteria management systems including environment, labor and location, industry or sector, self-assessment results, length GRI 414-2: 50.000000human rights, ethics and sustainable procurement impacts. of relationship and previous performance. We work together Negative social These are rated via in-depth assessments that require with the audited supplier to improve quality control and impacts in the 0 suppliers to provide proof for each of their claims. A supplier sustainability performance, share proposals for improvement supply chain and actions must score a minimum of 40 points in each of the four and request action plans within a specific time period. This taken 2020 2021 2022 segments of the assessment to achieve Beckers’ approval. approach has brought about remarkable improvements. Those who fail must work through a transparent corrective Step 1 Step 2 Step 3 Sign and adhere to the Conduct third-party assessments Conduct in-house audits Supplier Code of Conduct 37 Supplier due diligence
Performance Report 2022 What. Products We. People Do. Operations & Value. Governance GRI Content Index GRI. Content Index 3838 Supplier due diligence
Performance Report 2022 What. Products We. People Do. Operations & Value. Governance GRI Content Index GRI Content Index Beckers has reported in accordance with the 2021 GRI Standards for the period from 01.01.2022 to 31.12.2022. GRI Standard/ Own disclosure Disclosure Reference (page/link) Comments/Omission GRI 2: General Disclosures 2021 GRI 2-1: Organizational details Meet Beckers Group About Beckers Contact GRI 2-2: Entities included in the organization’s sustainability reporting Meet Beckers Group About Beckers GRI 2-3: Reporting period, frequency and contact point Contact GRI Content Index GRI 2-4: Restatements of information No restatements GRI 2-5: External assurance Contact GRI 2-6: Activities, value chain and other business relationships Meet Beckers Group Our value chain GRI 2-7: Employees Employees GRI 2-8: Workers who are not employees Information unavailable/ incomplete Data is not fully centralized and is in process of consolidation. GRI 2-9: Governance structure and composition Meet our leadership Diversity GRI 2-10: Nomination and selection of the highest governance body Meet our leadership GRI 2-11: Chair of the highest governance body Meet our leadership GRI 2-12: Role of the highest governance body in overseeing the management of impacts Meet our leadership 39 GRI Content Index
Performance Report 2022 What. Products We. People Do. Operations & Value. Governance GRI Content Index GRI Content Index GRI Standard/ Own disclosure Disclosure Reference (page/link) Comments/Omission GRI 2-13: Delegation of responsibility for managing impacts Meet our leadership GRI 2-14: Role of the highest governance body in sustainability reporting Meet our leadership GRI 2-15: Conflicts of interest Meet our leadership GRI 2-16: Communication of critical concerns Meet our leadership GRI 2-17: Collective knowledge of the highest governance body Meet our leadership GRI 2-18: Evaluation of the performance of the highest governance body Meet our leadership GRI 2-19: Remuneration policies Meet our leadership GRI 2-20: Process to determine remuneration Meet our leadership GRI 2-21: Annual total compensation ratio Information unavailable/ incomplete. Beckers report this disclosure internally and prepare to report it in the future. GRI 2-22: Statement on sustainable development strategy CEO editorial GRI 2-23: Policy commitments Our stakeholder engagement Our governance Human rights Code of Conduct 40 GRI Content Index
Performance Report 2022 What. Products We. People Do. Operations & Value. Governance GRI Content Index GRI Content Index GRI Standard/ Own disclosure Disclosure Reference (page/link) Comments/Omission GRI 2-24: Embedding policy commitments Our sustainability governance structure Meet our leadership Our 2030 Sustainability Strategy Our sustainable product portfolio Our breakthrough innovations Our diverse, motivated and empowered employees Our safety and well-being Our social engagement Our climate action Our resource efficiency Our supply chain sustainability Our governance Human rights Our value chain GRI 2-25: Processes to remediate negative impacts Our governance GRI 2-26: Mechanisms for seeking advice and raising concerns Our governance GRI 2-27: Compliance with laws and regulations Our governance GRI 2-28: Membership associations Our governance Our stakeholder engagement GRI 2-29: Approach to stakeholder engagement Our stakeholder engagement Internal communication GRI 2-30: Collective bargaining agreements Employees Our stakeholder engagement 41 GRI Content Index
Performance Report 2022 What. Products We. People Do. Operations & Value. Governance GRI Content Index GRI Content Index GRI Standard/ Own disclosure Disclosure Reference (page/link) Comments/Omission GRI 3: Material Topics 2021 GRI 3-1: Process to determine material topics Our material topics GRI 3-2: List of material topics Our material topics GRI 3-3: Management of material topics Our 2030 Sustainability Goals Our breakthrough innovations Our diverse, motivated and empowered employees Our safety and well-being Our social engagement Our climate action Our resource efficiency Our supply chain sustainability Our governance Human rights GRI 201: Economic Performance 2016 GRI 201-1: Direct economic value generated and distributed About Beckers Sustainable product portfolio & Breakthrough innovations GRI 301: Materials 2016 GRI 301-1: Materials used by weight or volume Materials GRI 301-2: Recycled input materials used Materials Product Stewardship Own disclosure: Raw materials evaluated as per standardized CSR guidelines Supplier due diligence 42 GRI Content Index
Performance Report 2022 What. Products We. People Do. Operations & Value. Governance GRI Content Index GRI Content Index GRI Standard/ Own disclosure Disclosure Reference (page/link) Comments/Omission Diverse, motivated and empowered employees GRI 401: Employment 2016 GRI 401-1: New employee hires and employee turnover Employees GRI 405: Diversity and Equal Opportunity 2016 GRI 405-1: Diversity of governance bodies and employees Diversity GRI 405-2: Ratio of basic salary and remuneration of women to men Employees GRI 406: Non-discrimination 2016 GRI 406-1: Incidents of discrimination and corrective actions taken Anti-Discrimination Safety and well-being GRI 403: Occupational Health and Safety 2018 GRI 403-1: Occupational health and safety management system Our safety & well-being GRI 403-2: Hazard identification, risk assessment and incident investigation Our safety & well-being GRI 403-3: Occupational health services Our safety & well-being GRI 404-4: Worker participation, consultation, and communication on occupational health and safety Our safety & well-being GRI 403-5: Worker training on occupational health and safety Our safety & well-being GRI 403-6: Promotion of worker health Our safety & well-being GRI 403-7: Prevention and mitigation of occupational health and safety impacts directly linked by business relationships Our safety & well-being 43 GRI Content Index
Performance Report 2022 What. Products We. People Do. Operations & Value. Governance GRI Content Index GRI Content Index GRI Standard/ Own disclosure Disclosure Reference (page/link) Comments/Omission GRI 403-8: Workers covered by an occupational health and safety management system Health & Safety GRI 403-9: Work-related injuries Health & Safety GRI 403-10: Work-related ill health Health & Safety GRI 404: Training and Education 2016 GRI 404-1: Average hours of training per year per employee Employees GRI 404-2: Programs for upgrading employee Our diverse, motivated and empowered employees skills and transition assistance programs GRI 404-3: Percentage of employees receiving regular Employees performance and career development reviews Social engagements Own disclosure: Local Communities Community Climate action GRI 302: Energy 2016 GRI 302-1: Energy consumption within the organization Energy GRI 302-3: Energy intensity Energy GRI 305: Emissions 2016 GRI 305-1: Direct (Scope 1) GHG emissions Emissions GRI 305-2: Energy indirect (Scope 2) GHG emissions Emissions GRI 305-3: Other indirect (Scope 3) GHG emissions Emissions GRI 305-4: GHG emissions intensity Emissions 44 GRI Content Index
Performance Report 2022 What. Products We. People Do. Operations & Value. Governance GRI Content Index GRI Content Index GRI Standard/ Own disclosure Disclosure Reference (page/link) Comments/Omission GRI 305-5: Reduction of GHG emissions Emissions GRI 305-7: Nitrogen oxides (NOx), sulfur oxides (SOx), and other significant air emissions Air pollution Resource efficiency GRI 303: Water and Effluents 2018 GRI 303-1: Interactions with water as a shared resource Our resource efficiency GRI 303-3: Water withdrawal Water GRI 303-4: Water discharge Water GRI 303-5: Water consumption Water GRI 306: Waste 2020 GRI 306-1: Waste generation and significant waste-related impacts Our resource efficiency Waste Our sustainable product portfolio Our breakthrough innovations GRI 306-2: Management of significant waste-related impacts Our sustainable product portfolio Our breakthrough innovations Our resource efficiency GRI 306-3: Waste generated Waste GRI 306-4: Waste diverted from disposal Waste GRI 306-5: Waste directed to disposal Waste GRI 306: Effluents and Waste 2016 GRI 306-3: Significant spills Waste 45 GRI Content Index
Performance Report 2022 What. Products We. People Do. Operations & Value. Governance GRI Content Index GRI Content Index GRI Standard/ Own disclosure Disclosure Reference (page/link) Comments/Omission Human rights GRI 408: Child Labor 2016 GRI 408-1: Operations and suppliers at significant risk for incidents of child labor Human rights GRI 409: Forced or Compulsory Labor 2016 GRI 409-1: Operations and suppliers at significant risk for incidents of forced or compulsory labor Human rights Governance GRI 205: Anti-corruption 2016 GRI 205-1: Operations assessed for risks related to corruption Anti-Corruption Human rights Our governance GRI 205-2: Communication and training about anti-corruption policies and procedures Anti-Corruption GRI 205-3: Confirmed incidents of corruption and actions taken Anti-Corruption 46 GRI Content Index
Performance Report 2022 What. Products We. People Do. Operations & Value. Governance GRI Content Index GRI Content Index GRI Standard/ Own disclosure Disclosure Reference (page/link) Comments/Omission GRI 206: Anti-competitive Behavior 2016 GRI 206-1: Legal actions for anti-competitive behavior, Our governance anti-trust, and monopoly practices Anti-Competitive Behavior GRI 308: Supplier Environmental Assessment 2016 GRI 308-1: New suppliers that were screened using environmental criteria Supplier due diligence GRI 308-2: Negative environmental impacts in the supply chain and actions taken Supplier due diligence GRI 414: Supplier Social Assessment 2016 GRI 414-1: New suppliers that were screened using social criteria Supplier due diligence GRI 414-2: Negative social impacts in the supply chain and actions taken Supplier due diligence 47 GRI Content Index
Performance Report 2022 What. Products We. People Do. Operations & Value. Governance GRI Content Index Contact Questions? About this report Beckers has been reporting its sustainability performance since 2011. In this report, you will find the complete set of Beckers’ environmental, Contact social and governance (ESG) performance data and our GRI content index. Other data and information on our sustainability work are shared in our Sustainability Report. This report has been prepared in accordance Beckers Group with the 2021 GRI Standards. Becker Industrial Coatings Holding AB All of Beckers’ 25 legal entities in 17 countries are included in the report. [email protected] The GRI Content Index in this document compiles disclosure information www.beckers-group.com and explains any omissions to the reported data. The data have not been externally audited. 48 Contact Consulting, concept, editing and design I SILVESTER GROUP, Hamburg I www.silvestergroup.com