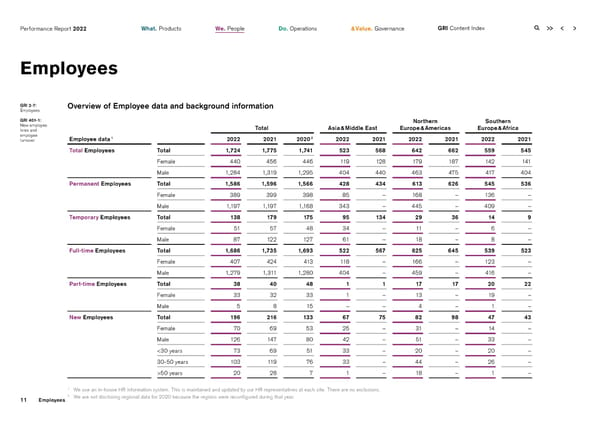
Performance Report 2022 What. Products We. People Do. Operations & Value. Governance GRI Content Index Employees GRI 2-7: Overview of Employee data and background information Employees GRI 401-1: Northern Southern New employee Total Asia & Middle East Europe & Americas Europe & Africa hires and employee 1 2 turnover Employee data 2022 2021 2020 2022 2021 2022 2021 2022 2021 Total Employees Total 1,724 1,775 1,741 523 568 642 662 559 545 Female 440 456 446 119 128 179 187 142 141 Male 1,284 1,319 1,295 404 440 463 475 417 404 Permanent Employees Total 1,586 1,596 1,566 428 434 613 626 545 536 Female 389 399 398 85 – 168 – 136 – Male 1,197 1,197 1,168 343 – 445 – 409 – Temporary Employees Total 138 179 175 95 134 29 36 14 9 Female 51 57 48 34 – 11 – 6 – Male 87 122 127 61 – 18 – 8 – Full-time Employees Total 1,686 1,735 1,693 522 567 625 645 539 523 Female 407 424 413 118 – 166 – 123 – Male 1,279 1,311 1,280 404 – 459 – 416 – Part-time Employees Total 38 40 48 1 1 17 17 20 22 Female 33 32 33 1 – 13 – 19 – Male 5 8 15 – – 4 – 1 – New Employees Total 196 216 133 67 75 82 98 47 43 Female 70 69 53 25 – 31 – 14 – Male 126 147 80 42 – 51 – 33 – 50 years 20 28 7 1 – 18 – 1 – 1 We use an in-house HR information system. This is maintained and updated by our HR representatives at each site. There are no exclusions. 2 We are not disclosing regional data for 2020 because the regions were reconfigured during that year. 11 Employees
 2022 | ESG Report Page 10 Page 12