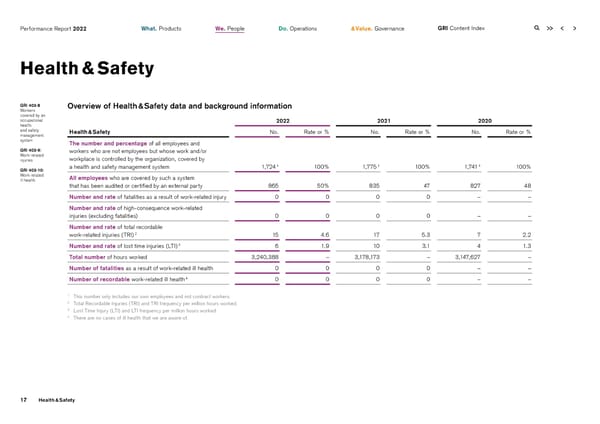
Performance Report 2022 What. Products We. People Do. Operations & Value. Governance GRI Content Index Health & Safety GRI 403-8 Overview of Health & Safety data and background information Workers covered by an occupational 2022 2021 2020 health and safety Health & Safety No. Rate or % No. Rate or % No. Rate or % management system The number and percentage of all employees and GRI 403-9: workers who are not employees but whose work and/or Work-related workplace is controlled by the organization, covered by injuries 1 1 1 GRI 403-10: a health and safety management system 1,724 100% 1,775 100% 1,741 100% Work-related All employees who are covered by such a system ill health that has been audited or certified by an external party 865 50% 835 47 827 48 Number and rate of fatalities as a result of work-related injury 0 0 0 0 – – Number and rate of high-consequence work-related injuries (excluding fatalities) 0 0 0 0 – – Number and rate of total recordable 2 work-related injuries (TRI) 15 4.6 17 5.3 7 2.2 3 Number and rate of lost time injuries (LTI) 6 1.9 10 3.1 4 1.3 Total number of hours worked 3,240,388 – 3,178,173 – 3,147,627 – Number of fatalities as a result of work-related ill health 0 0 0 0 – – 4 Number of recordable work-related ill health 0 0 0 0 – – 1 This number only includes our own employees and not contract workers. 2 Total Recordable Injuries (TRI) and TRI frequency per million hours worked. 3 Lost Time Injury (LTI) and LTI frequency per million hours worked. 4 There are no cases of ill health that we are aware of. 17 Health & Safety
 2022 | ESG Report Page 16 Page 18