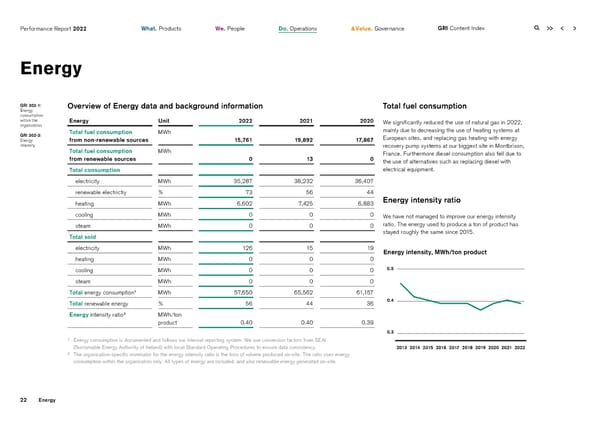
Performance Report 2022 What. Products We. People Do. Operations & Value. Governance GRI Content Index Energy GRI 302-1: Overview of Energy data and background information Total fuel consumption Energy consumption within the Energy Unit 2022 2021 2020 We significantly reduced the use of natural gas in 2022, organization Total fuel consumption MWh mainly due to decreasing the use of heating systems at GRI 302-3: European sites, and replacing gas heating with energy Energy from non-renewable sources 15,761 19,892 17,867 intensity recovery pump systems at our biggest site in Montbrison, Total fuel consumption MWh France. Furthermore diesel consumption also fell due to from renewable sources 0 13 0 the use of alternatives such as replacing diesel with Total consumption electrical equipment. electricity MWh 35,287 38,232 36,407 renewable electrictiy % 73 56 44 heating MWh 6,602 7,425 6,883 Energy intensity ratio cooling MWh 0 0 0 We have not managed to improve our energy intensity steam MWh 0 0 0 ratio. The energy used to produce a ton of product has Total sold stayed roughly the same since 2015. electricity MWh 126 15 19 Energy intensity, MWh/ton product heating MWh 0 0 0 0.5 cooling MWh 0 0 0 0.5 steam MWh 0 0 0 Total energy consumption¹ MWh 57,650 65,562 61,157 0.4 Total renewable energy % 56 44 36 0.4 Energy intensity ratio² MWh/ton product 0.40 0.40 0.39 0.3 0.3 ¹ Energy consumption is documented and follows our internal reporting system. We use conversion factors from SEAI (Sustainable Energy Authority of Ireland) with local Standard Operating Procedures to ensure data consistency. 2013 2014 2015 2016 2017 2018 2019 2020 2021 2022 ² The organization-specific nominator for the energy intensity ratio is the tons of volume produced on-site. The ratio uses energy consumption within the organization only. All types of energy are included, and also renewable energy generated on-site. 22 Energy
 2022 | ESG Report Page 21 Page 23