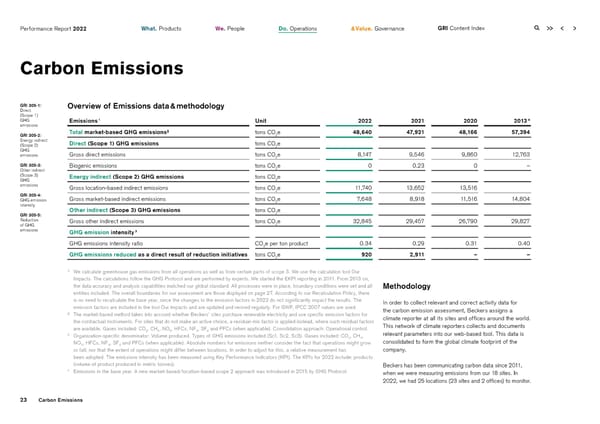
Performance Report 2022 What. Products We. People Do. Operations & Value. Governance GRI Content Index Carbon Emissions GRI 305-1: Overview of Emissions data & methodology Direct (Scope 1) GHG 1 4 Emissions Unit 2022 2021 2020 2013 emissions GRI 305-2: Total market-based GHG emissions² tons CO2e 48,640 47,921 48,166 57,394 Energy indirect Direct (Scope 1) GHG emissions tons CO e (Scope 2) 2 GHG Gross direct emissions tons CO e 8,147 9,546 9,860 12,763 emissions 2 GRI 305-3: Biogenic emissions tons CO2e 0 0.23 0 – Other indirect (Scope 3) Energy indirect (Scope 2) GHG emissions tons CO e GHG 2 emissions Gross location-based indirect emissions tons CO e 11,740 13,652 13,516 2 GRI 305-4: Gross market-based indirect emissions tons CO e 7,648 8,918 11,516 14,804 GHG emission 2 intensity Other indirect (Scope 3) GHG emissions tons CO2e GRI 305-5: Reduction Gross other indirect emissions tons CO e 32,845 29,457 26,790 29,827 of GHG 2 emissions 3 GHG emission intensity GHG emissions intensity ratio COe per ton product 0.34 0.29 0.31 0.40 2 GHG emissions reduced as a direct result of reduction initiatives tons CO2e 920 2,911 – – ¹ We calculate greenhouse gas emissions from all operations as well as from certain parts of scope 3. We use the calculation tool Our Impacts. The calculations follow the GHG Protocol and are performed by experts. We started the EKPI reporting in 2011. From 2013 on, the data accuracy and analysis capabilities matched our global standard. All processes were in place, boundary conditions were set and all Methodology entities included. The overall boundaries for our assessment are those displayed on page 27. According to our Recalculation Policy, there is no need to recalculate the base year, since the changes to the emission factors in 2022 do not significantly impact the results. The In order to collect relevant and correct activity data for emission factors are included in the tool Our Impacts and are updated and revised regularly. For GWP, IPCC 2007 values are used. the carbon emission assessment, Beckers assigns a ² The market-based method takes into account whether Beckers’ sites purchase renewable electricity and use specific emission factors for climate reporter at all its sites and offices around the world. the contractual instruments. For sites that do not make an active choice, a residual-mix factor is applied instead, where such residual factors This network of climate reporters collects and documents are available. Gases included: CO2, CH4, NO2, HFCs, NF3, SF6 and PFCs (when applicable). Consolidation approach: Operational control. 3 Organization-specific denominator: Volume produced. Types of GHG emissions included (Sc1, Sc2, Sc3). Gases included: CO , CH , relevant parameters into our web-based tool. This data is 2 4 consolidated to form the global climate footprint of the NO2, HFCs, NF3, SF6 and PFCs (when applicable). Absolute numbers for emissions neither consider the fact that operations might grow or fall, nor that the extent of operations might differ between locations. In order to adjust for this, a relative measurement has company. been adopted. The emissions intensity has been measured using Key Performance Indicators (KPI). The KPIs for 2022 include: products (volume of product produced in metric tonnes). Beckers has been communicating carbon data since 2011, 4 Emissions in the base year. A new market-based/location-based scope 2 approach was introduced in 2015 by GHG Protocol. when we were measuring emissions from our 18 sites. In 2022, we had 25 locations (23 sites and 2 offices) to monitor. 23 Carbon Emissions
 2022 | ESG Report Page 22 Page 24