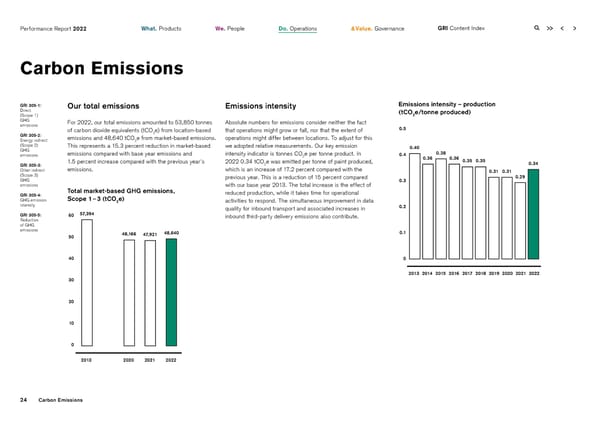
Performance Report 2022 What. Products We. People Do. Operations & Value. Governance GRI Content Index Carbon Emissions GRI 305-1: Our total emissions Emissions intensity Emissions intensity – production Direct (tCO e/tonne produced) (Scope 1) 2 GHG For 2022, our total emissions amounted to 53,850 tonnes Absolute numbers for emissions consider neither the fact emissions 0.5 of carbon dioxide equivalents (tCO2e) from location-based that operations might grow or fall, nor that the extent of GRI 305-2: emissions and 48,640 tCO e from market-based emissions. operations might differ between locations. To adjust for this Energy indirect 2 (Scope 2) This represents a 15.3 percent reduction in market-based we adopted relative measurements. Our key emission 0.40 GHG emissions compared with base year emissions and intensity indicator is tonnes CO e per tonne product. In 0.38 emissions 2 0.4 0.36 0.36 1.5 percent increase compared with the previous year’s 2022 0.34 tCO e was emitted per tonne of paint produced, 0.35 0.35 0.34 GRI 305-3: 2 Other indirect emissions. which is an increase of 17.2 percent compared with the 0.31 0.31 (Scope 3) previous year. This is a reduction of 15 percent compared 0.29 GHG 0.3 emissions with our base year 2013. The total increase is the effect of GRI 305-4: Total market-based GHG emissions, reduced production, while it takes time for operational GHG emission Scope 1 – 3 (tCO2e) activities to respond. The simultaneous improvement in data intensity quality for inbound transport and associated increases in 0.2 GRI 305-5: 60 57,394 inbound third-party delivery emissions also contribute. Reduction of GHG emissions 48,166 48,640 0.1 50 47,921 40 0 2013 2014 2015 2016 2017 2018 2019 2020 2021 2022 30 20 10 0 2013 2020 2021 2022 24 Carbon Emissions
 2022 | ESG Report Page 23 Page 25