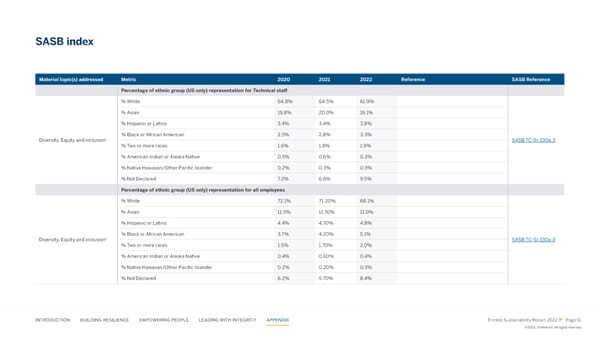
SASB index Material topic(s) addressed Metric 2020 2021 2022 Reference SASB Reference Percentage of ethnic group (US only) representation for Technical sta昀昀 % White 64.8% 64.5% 61.9% % Asian 19.8% 20.0% 19.1% % Hispanic or Latino 3.4% 3.4% 3.8% % Black or African American 2.5% 2.8% 3.3% 1 Diversity, Equity and Inclusion SASB TC-SI-330a.3 % Two or more races 1.6% 1.8% 1.9% % American Indian or Alaska Native 0.5% 0.6% 0.3% % Native Hawaiian/Other Paci昀椀c Islander 0.2% 0.3% 0.3% % Not Declared 7.2% 6.6% 9.5% Percentage of ethnic group (US only) representation for all employees % White 72.1% 71.20% 68.1% % Asian 11.5% 11.70% 11.0% % Hispanic or Latino 4.4% 4.70% 4.8% % Black or African American 3.7% 4.20% 5.1% 1 SASB TC-SI-330a.3 Diversity, Equity and Inclusion % Two or more races 1.5% 1.70% 2.0% % American Indian or Alaska Native 0.4% 0.60% 0.4% % Native Hawaiian/Other Paci昀椀c Islander 0.2% 0.20% 0.3% % Not Declared 6.2% 5.70% 8.4% INTRODUCTION BUILDING RESILIENCE EMPOWERING PEOPLE LEADING WITH INTEGRITY APPENDIX Trimble Sustainability Report 2022 Page 51 ©2023, Trimble Inc. All rights reserved.
 2022 Sustainability Report Page 50 Page 52