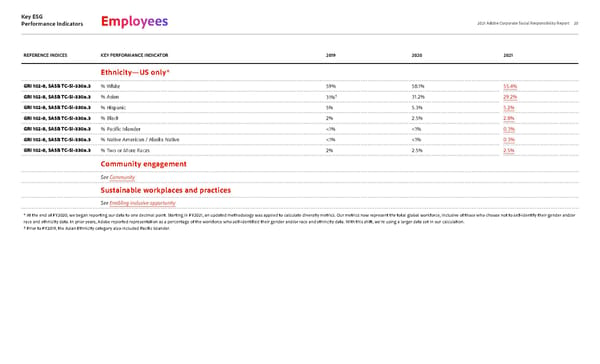
Key ESG Performance Indicators 20 2021 Adobe Corporate Social Responsibility Report REFERENCE INDICES KEY PERFORMANCE INDICATOR 2019 2020 2021 Ethnicity—US only * GRI 102-8, SASB TC-SI-330a.3 % White 59% 58.1% 55.4% GRI 102-8, SASB TC-SI-330a.3 % Asian 31% † 31.2% 29. 2% GRI 102-8, SASB TC-SI-330a.3 % Hispanic 5% 5.3% 5.2% GRI 102-8, SASB TC-SI-330a.3 % Black 2% 2.5% 2.8% GRI 102-8, SASB TC-SI-330a.3 % Pacific Islander <1% <1% 0.3% GRI 102-8, SASB TC-SI-330a.3 % Native American / Alaska Native <1% <1% 0.3% GRI 102-8, SASB TC-SI-330a.3 % Two or More Races 2% 2.5% 2.5% Community engagement See Community Sustainable workplaces and practices See Enabling inclusive opportunity * At the end of FY2020, we began reporting our data to one decimal point. Starting in FY2021, an updated methodology was applied to calculate diversity metrics. Our metrics now represent the total global workforce, inclusive of those who choose not to self-identify their gender and/or race and ethnicity data. In prior years, Adobe reported representation as a percentage of the workforce who self-identified their gender and/or race and ethnicity data. With this shift, we’re using a larger data set in our calculation. † Prior to FY2019, the Asian Ethnicity category also included Pacific Islander. Employees
 Adobe Sustainability Social Report Page 19 Page 21