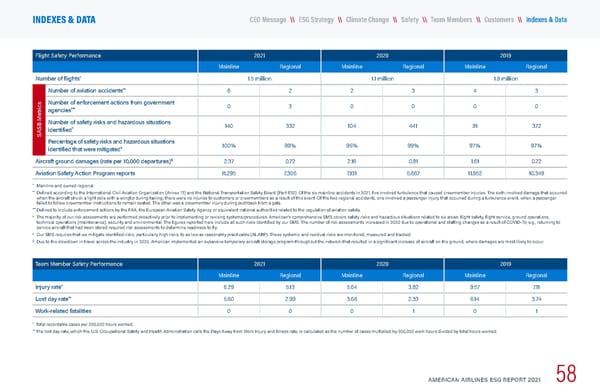
Flight Safety Performance 2021 2020 2019 Mainline Regional Mainline Regional Mainline Regional Number of flights * 1.5 million 1.1 million 1.9 million SASB Metrics Number of aviation accidents ** 6 2 2 3 4 3 Number of enforcement actions from government agencies *** 0 3 0 0 0 0 Number of safety risks and hazardous situations identified † 140 332 104 441 81 372 Percentage of safety risks and hazardous situations identified that were mitigated ‡ 100% 99% 95% 99% 97% 97% Aircraft ground damages (rate per 10,000 departures) § 2.37 0.72 2.16 0.81 1.61 0.72 Aviation Safety Action Program reports 11,295 7,306 7,131 5,667 11,952 10,349 * Mainline and owned regional. ** Defined according to the International Civil Aviation Organization (Annex 13) and the National Transportation Safety Board (Part 830). Of the six mainline accidents in 2021, five involved turbulence that caused crewmember injuries. The sixth involved damage that occurred when the aircraft struck a light pole with a wingtip during taxiing; there were no injuries to customers or crewmembers as a result of this event. Of the two regional accidents, one involved a passenger injury that occurred during a turbulence event, when a passenger failed to follow crewmember instructions to remain seated. The other was a crewmember injury during pushback from a gate. *** Defined to include enforcement actions by the FAA, the European Aviation Safety Agency or equivalent national authorities related to the regulation of aviation safety. † The majority of our risk assessments are performed proactively prior to implementing or revising systems/procedures. American’s comprehensive SMS covers safety risks and hazardous situations related to six areas: flight safety, flight service, ground operations, technical operations (maintenance), security and environmental. The figures reported here include all such risks identified by our SMS. The number of risk assessments increased in 2020 due to operational and staffing changes as a result of COVID-19; e.g., returning to service aircraft that had been stored required risk assessments to determine readiness to fly. ‡ Our SMS requires that we mitigate identified risks, particularly high risks, to as low as reasonably practicable (ALARP). These systemic and residual risks are monitored, measured and tracked. § Due to the slowdown in travel across the industry in 2020, American implemented an expansive temporary aircraft storage program throughout the network that resulted in a significant increase of aircraft on the ground, where damages are most likely to occur. Team Member Safety Performance 2021 2020 2019 Mainline Regional Mainline Regional Mainline Regional Injury rate * 6.29 5.13 5.64 3.82 9.57 7.11 Lost day rate ** 5.60 2.99 3.66 2.33 6.14 3.74 Work-related fatalities 0 0 0 1 0 1 * Total recordable cases per 200,000 hours worked. ** The lost day rate, which the U.S. Occupational Safety and Health Administration calls the Days Away from Work Injury and Illness rate, is calculated as the number of cases multiplied by 200,000 work hours divided by total hours worked. AMERICAN AIRLINES ESG REPORT 2021 58 \\ Customers \\ Team Members \\ Climate Change \\ Safety \\ ESG Strategy CEO Message INDEXES & DATA \\ Indexes & Data
 American Airlines ESG Report Page 58 Page 60